

Introduction
According to the most recent Census Bureau projections, non-Latino Whites will become a numerical minority in the United States by 2045 (U.S. Census Bureau Reference Bureau2017).Footnote 1 Ongoing demographic changes are driven primarily by the growth of the Latino population through immigration and differential fertility.
How are White Americans responding to Latino growth, and outgroup growth more broadly? A growing literature examines this question. Studies link Latino size and growth to more negative attitudes toward Latinos among Whites via mechanisms of racial status threat and increased conservatism. Recent research further suggests the effects of outgroup growth can spill over to other groups. For example, Latino growth has also been linked to more negative attitudes toward Blacks among Whites.
This study extends this recent line of research which is predominately experimental and has thus far relied on convenience samples and on perceived or manipulated––as opposed to real––demographic change. I ask: Is Latino growth across U.S. communities associated with White residents’ anti-Black resentment? The analyses rely on the 2018 Cooperative Congressional Election Study (CCES) to examine the attitudes of nearly 39,000 U.S. Whites.
To anticipate the main finding: county-level Latino growth is associated with more anti-Black resentment among Whites. This finding invites a further question: What accounts for this association? I explore two possible mechanisms: perceived threats to Whites’ status and ideological conservativism, both of which, as I show, are themselves associated with Latino growth. I uncover prima facie evidence that both racial threat and conservatism mediate the relationship with anti-Black resentment.
The findings lend external validity to those of earlier work; they also contribute to our understanding of the mechanisms through which the growth of one group, specifically Latinos, can affect Whites’ attitudes toward another group, specifically Blacks. First, Whites interpret Latino growth as a threat to their dominant racial status, which they try to defend by excluding multiple non-White groups. Second, demographic change and the uncertainty it engenders fuels ideological conservatism, which is itself associated with racial resentment.
To start, I briefly review research on the association between outgroup growth and attitudes toward the growing group, before delving into recent research on outgroup growth, especially among Latinos, and attitudes toward other groups. I then discuss racial status threat and conservatism as potential mechanisms through which outgroup growth can affect racial attitudes more broadly.
Responses to the Growing Latino Population
A sizable body of work examines how U.S. Whites respond to the growing Latino population. This work builds on an earlier empirical literature on Whites’ responses to the relative size or growth of local Black populations. Earlier studies show, for example, that Whites who live in communities where Blacks make up a larger share of the population are less likely to support integration (Fossett and Kiecolt, Reference Fossett and Kiecolt1989), Black civil rights (Glaser Reference Glaser1994), and government assistance to Blacks (Glaser Reference Glaser1994; Taylor Reference Taylor1998; though see Oliver and Mendelberg, Reference Oliver and Mendelberg2000). They also report more punitive attitudes (King and Wheelock, Reference King and Wheelock2007).
Likewise, Whites exposed to larger or growing Latino or immigrant populations express greater resentment toward Latinos and immigrants and less progressive stances on policies that affect them. Whites in counties where the Latino population grew more are more likely to view immigration as a threat to “America’s cultural life,” a net fiscal burden, and a cause of increasing crime (Newman Reference Newman2013). These views coincide with support for more restrictive immigration policies. In communities where the Latino population is larger or growing, Whites are more likely to report that the number of immigrants allowed to come to the United States should be decreased (Newman Reference Newman2013; Stein et al., Reference Stein, Post and Rinden2000).Footnote 2 Relatedly, Daniel J. Hopkins (Reference Hopkins2010) finds that local immigrant population growth predicts White support for curbing immigration when immigration is made salient by national media coverage. And, in a field experiment with Boston commuters, Ryan D. Enos (Reference Enos2014) finds that superficial exposure to Spanish speakers promotes support for more restrictive immigration policies, though the effect dissipates with time (also see Hopkins et al., Reference Hopkins, Tran and Williamson2014).
Similar patterns extend to voting behavior. For example, Whites in California counties with relatively larger Latino populations were more likely to vote for Proposition 187, an initiative to bar undocumented immigrants from non-emergency services (Campbell et al., Reference Campbell, Wong and Citrin2006), and for Proposition 209, an initiative to end affirmative action (Tolbert and Grummel, Reference Tolbert and Grummel2003). And Whites in states with relatively larger Latino populations were more likely to vote for Bush in 2000 and 2004 (Abrajano and Hajnal, Reference Abrajano and Hajnal2015); they are also more likely to identify as ideologically conservative and with the Republican Party. More recently, Christopher Maggio (Reference Maggio2020) finds that voters in counties that underwent rapid Latino population growth were more likely to vote for Trump in the 2016 general election (also see Knowles and Tropp, Reference Knowles and Tropp2018).
Does the growing Latino population also predict Whites’ attitudes toward other non-White groups, such as Blacks, and their support for policies that affect them? This question has recently commanded empirical attention. Experimental work suggests that Latino population growth engenders anti-Black and anti-Asian sentiments among Whites. Maureen A. Craig and Jennifer A. Richeson (Reference Craig and Richeson2014a) find that Whites who are prompted to think about diversification driven by Latino growth express more negative implicit and explicit attitudes toward Blacks and Asians. And in the context of an incentivized experiment, Whites respond to perceived Latino growth with relatively less generous monetary contributions to Black versus White strangers (Abascal Reference Abascal2015). Similarly, H. Robert Outten and colleagues (Reference Outten, Schmitt, Miller and Garcia2012) find that Whites who are prompted to think about diversification express greater anger and fear toward minorities in general.
In a related vein, Cybelle Fox (Reference Fox2004) finds that Whites in states with larger Latino populations report more negative stereotypes about Blacks’ work ethic. And, in states where Latinos are overrepresented, the more positive Whites’ stereotypes about Latinos’ work ethic, the more they oppose welfare, a finding Fox explains by invoking the co-construction of attitudes toward Blacks and Latinos: “whites in states with more Latinos may be holding Latinos as the model minority against which they judge blacks” (Reference Fox2004, p. 616). The historical record also furnishes evidence that, in the wake of immigration, Blacks become targets of Whites’ ire. Susan Olzak and Suzanne Shanahan (Reference Olzak and Shanahan2003) find that annual growth in immigration between 1869 and 1924 was associated with the hazard of collective violence incidents against Blacks.
More broadly, the notion that exposure to one group can affect attitudes toward other groups is consistent with research on the positive consequences of intergroup contact. This research has uncovered evidence of a “secondary transfer effect,” wherein positive intergroup contact can reduce prejudice toward a third, “noninvolved” outgroup that is thought to be similar to the contacted outgroup in terms of status and stereotypes (for a review, see Pettigrew Reference Pettigrew2009). In a recent study, for example, Helen B. Marrow and colleagues (Reference Marrow, Tropp, van der Linden, Okamoto and Jones-Correa2019) find that Whites who have more frequent interpersonal contact with Blacks also express more positive attitudes toward Mexican and Indian immigrants. If the positive effects of contact transfer, so might its negative effects.
The Role of Size Versus Growth
Observational research suggests that outgroup growth is a more reliable correlate of attitudes than outgroup size (e.g., Hopkins Reference Hopkins2010; Maggio Reference Maggio2020; Newman Reference Newman2013).Footnote 3 In fact, a substantial body of research suggests that stable interpersonal contact can actually reduce intergroup hostility and prejudice (Pettigrew and Tropp, Reference Pettigrew and Tropp2006). To be sure, outgroup size does not automatically lead to interpersonal contact between different groups (Marrow et al., Reference Marrow, Tropp, van der Linden, Okamoto and Jones-Correa2019); it does, however, constrain the encounters to which residents have access.
Also, as a theoretical matter, growth is the more plausible driver of outgroup hostility. For one, people’s perceptions of local and national population composition are notoriously inaccurate (e.g., Alba et al., Reference Alba, Rumbaut and Marotz2005). For cognitive reasons, though, people are attentive to change (Kahneman and Tversky, Reference Kahneman and Tversky1979). As Hopkins (Reference Hopkins2010) explains, “While levels of ethnic heterogeneity might escape notice, changes are less likely to do so” (p. 42). Indeed, work by Benjamin J. Newman and Yamil Velez (Reference Newman and Velez2014) confirms that people more accurately assess changes in the local immigrant and Latino populations than their size. Hubert M. Blalock (Reference Blalock1967) formalized the primacy of change in his racial threat curve. By his account, a change in outgroup size is more consequential in contexts where the outgroup is less familiar––in other words, where change is highly salient. In this study, I focus on measures of Latino population growth, controlling for the initial share of Latinos in respondents’ communities.
Racial Status Threat
Why might the growth of one group, like Latinos, affect Whites’ attitudes toward another group, like Blacks? The most prominent explanation draws on the same theoretical rationale used to explain why the growth of one group would affect attitudes toward that same group. This rationale regards prejudice and discrimination as products of competition for scarce material resources, like political power and economic opportunities (Blalock Reference Blalock1967; Key Reference Key1949), as well as symbolic ones, like status. Competition for group status is rooted in both a universal desire to belong to a group that is positively evaluated (Tajfel and Turner, Reference Tajfel and Turner1979) as well as a felt “sense of group position,” that is, a deeply held vision of a groups’ status vis-à-vis other groups (Blumer Reference Blumer1958, p. 3; Bobo Reference Bobo1983; Bobo and Hutchings, Reference Bobo and Hutchings1996).
Against this backdrop, dominant groups may view changes in relative group size as a possible threat to their group’s privileged status. From Whites’ perspective, non-White growth may heighten competition in labor markets and dilute Whites’ political power. Non-White growth may also devalue the esteem associated with Whiteness by challenging Whites’ hegemony in symbolic exchange markets (McVeigh Reference McVeigh2009; see discussion in Abascal Reference Abascal2020).Footnote 4 Supporting this view, experimental studies link perceptions of demographic change to Whites’ identification and solidarity with their own racial group. For example, Whites exposed to information about diversification are more likely to express a preference for interacting with other Whites (Craig and Richeson, Reference Craig and Richeson2014a) and greater sympathy toward other Whites (Outten et al., Reference Outten, Schmitt, Miller and Garcia2012). They also police the boundary around Whiteness more aggressively, by excluding racially ambiguous people from their ranks (Abascal Reference Abascal2020).
Racial status threat can explain not only why Latino growth predicts stronger pro-White attitudes as well as stronger anti-Latino attitudes among Whites, but also why it might predict anti-Black attitudes. Whites may interpret Latino growth as a threat to their group’s status within a multi-group system that includes other non-White groups. In response, Whites may attempt to shore up their group’s threatened status by withholding material and symbolic resources not only from the growing group, i.e., Latinos, but from other groups as well. Consistent with this interpretation, Craig and Richeson (Reference Craig and Richeson2014a) find that the effects of demographic shift on attitudes toward Blacks and Latinos are mediated by the perceived threat to Whites’ status.
Conservatism
Latino growth may also arouse anti-Black attitudes, and specifically resentment, through another channel: ideological conservatism. Racial demographics predict support for conservative policiesFootnote 5 (Craig and Richeson, Reference Craig and Richeson2014b; Wetts and Willer, Reference Wetts and Willer2018), political parties (Abrajano and Hajnal, Reference Abrajano and Hajnal2015) and candidates, including Donald Trump (Knowles and Tropp, Reference Knowles and Tropp2018; Major et al., Reference Major, Blodorn and Blascovich2016). These associations may flow, in part, through White racial status threat, because conservative positions on race-targeted policies, like affirmative action, and race-coded policies, like redistribution, can be a strategy for hoarding resources from beneficiaries that are (or are perceived to be) non-White (Wetts and Willer, Reference Wetts and Willer2018). However, racial status threat cannot explain why diversification also predicts greater conservatism on race-neutral policies, such as support for defense spending (Craig and Richeson, Reference Craig and Richeson2014b).
There are theoretical grounds to expect that diversification will fuel conservatism in general, not just through status threat and accompanying efforts to hoard resources from outgroup members. The key is to recognize conservatism as a form of “motivated social cognition,” that is, as an ideology that meets deep-seated psychological needs for order and structure (Jost et al., Reference Jost, Glaser, Kruglanski and Sulloway2003, p. 339). As a result, feelings of uncertainty and systemic instability arouse conservative views. In the real world, uncertainty and instability can stem from myriad sources, including physical threats (Oxley et al., Reference Oxley, Smith, Alford, Hibbing, Miller, Scalora, Hatemi and Hibbing2008), terrorist attacks (Bonanno and Jost, Reference Bonanno and Jost2006), and large-scale demographic shifts (though see Craig and Richeson, Reference Craig and Richeson2014b).Footnote 6
This compulsion toward conservatism may be especially consequential for anti-Black resentment, the subject of the present study. Anti-Black resentment is not only associated with conservativism (Green and McElwee, Reference Green and McElwee2019; Knowles et al., Reference Knowles, Lowery, Shulman and Schaumberg2013; Parker and Barreto, Reference Parker and Barreto2014), it is, by some accounts, partly driven by conservative principles of limited government and individualism (Sniderman and Carmines, Reference Sniderman and Carmines1997). Stanley Feldman and Leonie Huddy (Reference Feldman and Huddy2004), for example, find that resentment among conservatives is associated with general opposition to race-conscious policies, regardless of the race of the presumed beneficiaries. In sum, by engendering uncertainty and instability, demographic shift may promote support for conservative views that themselves predict agreement with survey items that gauge resentment.
Hypotheses
The nascent literature on outgroup growth and Whites’ attitudes toward other outgroups is predominately experimental. Studies like Craig and Richeson (Reference Craig and Richeson2014a) and my own (Abascal Reference Abascal2015) ask whether manipulated perceptions of Latino growth predict Whites’ treatment of other Non-White groups, especially Blacks. Do actual levels of Latino growth predict Whites’ attitudes toward Blacks? This question is the focus of the current paper. More specifically, I ask whether Latino population growth at the county level is associated with White residents’ anti-Black resentment. Drawing on recent work, I hypothesize:
H1. Whites in communities where the Latino population grew more will report stronger anti-Black resentment.
I focus on resentment, because, along with racial policy preferences, it is more robustly associated with demographic factors than “abstract” or “old-fashioned” racial attitudes, including stereotypes. For example, some studies find that Whites express more negative stereotypes of Blacks in communities with relatively larger Black populations (Dixon Reference Dixon2006; Taylor Reference Taylor1998); others do not (Glaser Reference Glaser1994; Oliver and Mendelberg, Reference Oliver and Mendelberg2000). Mixed results might be due to limited variation in terms of the racial stereotypes that Whites openly express (Bobo et al., Reference Bobo, Charles, Krysan, Simmons and Marsden2012), perhaps as a consequence of social desirability pressures. By comparison, Whites report more variation in terms of anti-Black resentment.
Latino growth could predict anti-Black resentment through its effect on racial status threat. If Whites interpret Latino growth as a threat to their group’s status within a multi-group system, threat could drive resentment toward other non-White groups, like Blacks. If this is the case, I would hypothesize:
H2a. Whites in communities where the Latino population grew more will be more likely to perceive a threat to Whites’ racial status.
H2b. Perceived threat to Whites’ racial status will fully or partially account for the association between Latino growth and anti-Black resentment.
Alternatively, or in addition, Latino growth could predict anti-Black resentment through its effect on ideological conservativism. By engendering uncertainty and instability, Latino growth may promote support for conservative views that themselves predict resentment. If this is the case, I would hypothesize:
H3a. Whites in communities where the Latino population grew more will report more ideological conservatism.
H3b. Whites’ ideological conservatism will fully or partially account for the association between Latino growth and anti-Black resentment.
Data and Methods
I examine these questions using data from the 2018 Cooperative Congressional Election Survey (CCES). The CCES is a national stratified sample survey of U.S. adults; it is administered online by YouGov/Polimetrix. In election years, like 2018, the survey is administered in two waves: a pre-election wave in October and a post-election wave in November.
YouGov/Polimetrix uses a two-stage, sample matching method to select respondents. In the first stage, they construct a stratified random sample of U.S. adults from the American Community Survey (ACS); in the second stage, they match each ACS respondent to one or more respondents in their panel.Footnote 7 The final, weighted sample resembles the target population of U.S. adults in terms of measured characteristics.Footnote 8 Under standard assumptions, it also resembles them in terms of unmeasured characteristics. 38,809 respondents identified as non-Latino White and participated in both the pre- and post-election waves. The outcome and mediating variables were collected in the post-election wave.
Outcome Variable
Anti-Black resentment, the main outcome, is captured by agreement with the following statements:
-
• “The Irish, Italians, Jews, and many other minorities overcame prejudice and worked their way up. Blacks should do the same without any special favors.”
-
• “Generations of slavery and discrimination have created conditions that make it difficult for Blacks to work their way out of the lower class.”
-
• “Over the past few years, Blacks have gotten less than they deserve.”
-
• “It’s really a matter of some people not trying hard enough. If Blacks would only try harder they could be just as well off as Whites.”
Agreement with each statement is recorded on a five-point scale that ranges from “Strongly agree” to “Strongly disagree.” Together, these four statements make up the “Symbolic Racism Scale” (Henry and Sears, Reference Henry and Sears2002). Responses exhibit high internal consistency (Cronbach’s α = 0.92). I reverse-coded responses to the first and fourth statements then summed responses to all statements to produce an index of anti-Black resentment.
Mediator Variables
Racial status threat is captured by (dis)agreement with the following statement: “White people in the U.S. have certain advantages because of the color of their skin.” Responses are recorded on a five-point scale from “Strongly agree” to “Strongly disagree.” A “feeling of proprietary claim to certain areas of privilege and advantage” is central to a dominant group’s sense of group position (Blumer Reference Blumer1958, p. 4). Accordingly, a White respondent who reports that White people no longer possess “certain advantages” is expressing a felt threat to their group’s position. Supporting this interpretation, the belief that White people are targets of discrimination––now a majority view among White Americans (Gonyea Reference Gonyea2017)––is negatively correlated with the belief that Black people are targets of discrimination, among White Americans (Norton and Sommers, Reference Norton and Sommers2011).
I operationalize conservatism using a seven-point scale for self-reported political ideology that ranges from “very liberal” to “very conservative.” The goal is to capture adherence to an ideology that meets psychological needs for order and structure and that is analytically distinct from political partisanship. Therefore, the multiple regression models also control for political party identification.
Key Explanatory Variables
The CCES includes information on respondents’ states and counties of residence. I use county codes to link CCES respondents with five-year, county-level estimates from the ACS (2005–2009 and 2014–2018) and 2013 rural/urban classification codes from the Economic Research Service of the U.S. Department of Agriculture (ERS-USDA).
Latino and Black growth variables reflect the percentage point growth for that group over a roughly ten-year period from 2005–2009 to 2014–2018 (hereafter 2009 and 2018). For example, a county with 5% Latino residents in 2009 and 10% Latino residents in 2018 saw a five-percentage point growth in that period.Footnote 9 These measures account for overall changes in county population size. For example, a county where the population grew evenly across racial/ethnic groups between 2009 and 2018 did not experience a change in relative group sizes; the values for Latino and Black growth would therefore be zero. The regression models also control for the share of the county population that identified as Latino or Black at the start of the period (2009).
In addition to being interesting predictors in their own right, Black share and growth are also important as controls: as the share of one group rises in an area, the shares of other groups shrink, ceteris paribus. To make the case that Latino growth is associated with anti-Black resentment, I must address the possibility that the association is in fact due to changes in the size of the Black population. I rule out multicollinearity as a concern by calculating variance inflation factors (VIF) between Latino share, Latino growth, Black share, and Black growth in models with all four predictors. In all cases, VIF values fall within an acceptable range (< 5).
I leave it to future work to isolate the effects of growth across Latinos who differ in terms of nativity, country of origin, and legal status. Although the Latino population is heterogeneous in terms of national background, immigrant status, and phenotype (among other characteristics), they may be viewed as relatively homogeneous by non-Latinos.
Additional Controls
At the individual level, I control for variables that are linked—theoretically or empirically—to racial and political attitudes. These variables include age, gender, family income, educational attainment, employment status, homeownership, generation since immigration, and political party identification. Age is measured in years. Gender is represented by a binary variable, where 1 corresponds to female-identified respondents and 0 corresponds to male-identified ones. Family income was initially recorded on a sixteen-point scale. I assigned mid-point dollar values to each category, and I derived the value of open-ended categories via linear extrapolation. In the regressions, family income is rescaled such that its coefficient represents the statistical effect of a $10,000 increase. Educational attainment is represented by binary variables for less than high school (reference); high school education; some college education or Associate’s degree; Bachelor’s degree; and graduate or professional degree. Employment status is represented by binary variables for full- or part-time employed (reference); unemployed or laid off; retired, students, homemakers, or permanently disabled; or other. HomeownershipFootnote 10 is represented by binary variables for respondents who own their homes (reference); rent; or other. Generation since immigration is represented by binary variables for third generation or higher (reference); second generation; or first-generation immigrant. Finally, party identification is represented by binary variables for Democrats (reference); Republicans; and respondents who identify as “Independent,” “Other,” or “not sure.”
I also control for differences between respondents’ counties. Counties are of course a rough approximation for communities as they are perceived and experienced by people. Practically speaking, however, the county is among the smallest geographic units to which CCES respondents are linked. Importantly, prior research shows that U.S. Americans are attuned to demographic changes at the county level (Newman and Velez, Reference Newman and Velez2014).Footnote 11
The first county control captures residential stability: the percent of residents who lived in the same house during the previous year. It comes from the 2014–2018 ACS. Community affluence is represented by median household income (in constant 2010 dollars). This measure, too, comes from the 2014–2018 ACS. In the regressions, median household income is rescaled such that its coefficient represents the statistical effect of a $10,000 increase. Rural/urban continuum codes from the USDA (2013) provide a measure of urbanization. Rural counties (value = 1) are those classified as “Nonmetro,” not adjacent to a metro area, and with urban populations less than 20,000.
Regressions also include a binary variable for the South, defined as former member states of the Confederacy. The South’s legacy of troubled race relations is manifest in the racial attitudes of many residents, although Southern exceptionalism can be explained, in part, by demographic factors (Taylor Reference Taylor1998).
Missing Data and Multiple Imputation
Of 38,809 self-identified White respondents in the pre- and post-election waves, 14.74% are missing values for one or more individual-level variables. I multiply imputed missing values of individual-level variables by chained equations using the R function mice. Continuous variables were imputed via predictive mean matching, binary variables were imputed via logistic regression, and categorical variables with three or more values were imputed via Bayesian polytomous regression. Following recommendations by Ian R. White and colleagues (Reference White, Royston and Wood2011), I generated fifteen imputed datasets, then pooled parameter estimates. Dependent variables were used in the imputation models and imputed values of these variables were retained.Footnote 12
Summary Statistics
Table 1 reports weighted summary statistics for non-imputed values of all variables.
Table 1. Weighted summary statistics

Note: Non-imputed values; N = 34771–38809
The average White respondent falls between neither agreeing nor disagreeing and somewhat agreeing with each anti-Black resentment statement. She neither agrees nor disagrees that “White people in the U.S. have certain advantages because of the color of their skin.” Ideologically, she falls between “middle of the road” and “somewhat conservative.” In addition, the average White respondent lives in a county that was 10.49% Latino in 2005–2009 and where the Latino population grew by 2.16% points over about the next ten years.
Analytic Strategy
I model anti-Black resentment, views of White disadvantage, and conservatism using linear regressions for interpretability. Results are substantively similar using ordered logistic regressions.
The data exhibit a hierarchical, or multilevel, structure with individual respondents clustered geographically. As a result, the responses of individual respondents might be similarly affected by unobserved, geographic differences.Footnote 13 I address differences across respondents’ counties via the county-level controls described above. However, Whites may also respond to demographic (and other) factors at higher geographic levels, most notably, the state (e.g., Abrajano and Hajnal, Reference Abrajano and Hajnal2015). Therefore, in addition to county predictors, I also include random, or un-modeled, state intercepts in the regressions. The multilevel estimation strategy yields information about the nature of the clustering; in the tables, I present this information as the standard deviation of the state intercept, or random effect. In general, the larger this figure, the more attitudes are explained by unobserved differences across states.
Selection represents an important concern for contextual analyses, like the ones reported here. If more tolerant Whites are more likely to move into or remain in counties where the Latino population is large or growing, then the following analyses will underestimate the association between Latino growth, on the one hand, and anti-Black resentment, on the other. Importantly, the models control for homeownership, a proxy for residential stability.
The analyses proceed as follows: first, I model anti-Black resentment as a function of county Latino share, county Latino population growth, as well as individual and county controls. I similarly model racial status threat and conservatism as functions of county Latino share, county Latino population growth, and individual and county controls. Finally, to explore mediation, I reestimate the models predicting anti-Black resentment controlling for racial status threat and conservatism, separately.
Results
Associations between Latino Growth and Resentment, Threat, Conservatism
Is anti-Black resentment among Whites associated with the growth of the local Latino population? The first column in Table 2 reports the results of a linear regression predicting anti-Black resentment by individual and contextual predictors, including county Latino growth between 2009 and 2018.Footnote 14 Latino growth is associated with stronger anti-Black resentment (p < 0.001). Specifically, holding other variables constant, a ten-percentage-point increase in the county Latino population is associated with a 0.59-point increase in anti-Black resentment (on a sixteen-point scale). To put this in context, the statistical effect on anti-Black resentment of a ten-percentage-point increase in the county Latino population is comparable to that of identifying as a Republican as opposed to a Democrat.
Table 2. Linear regressions predicting anti-Black resentment, perceived threat to Whites’ racial status, and conservatism
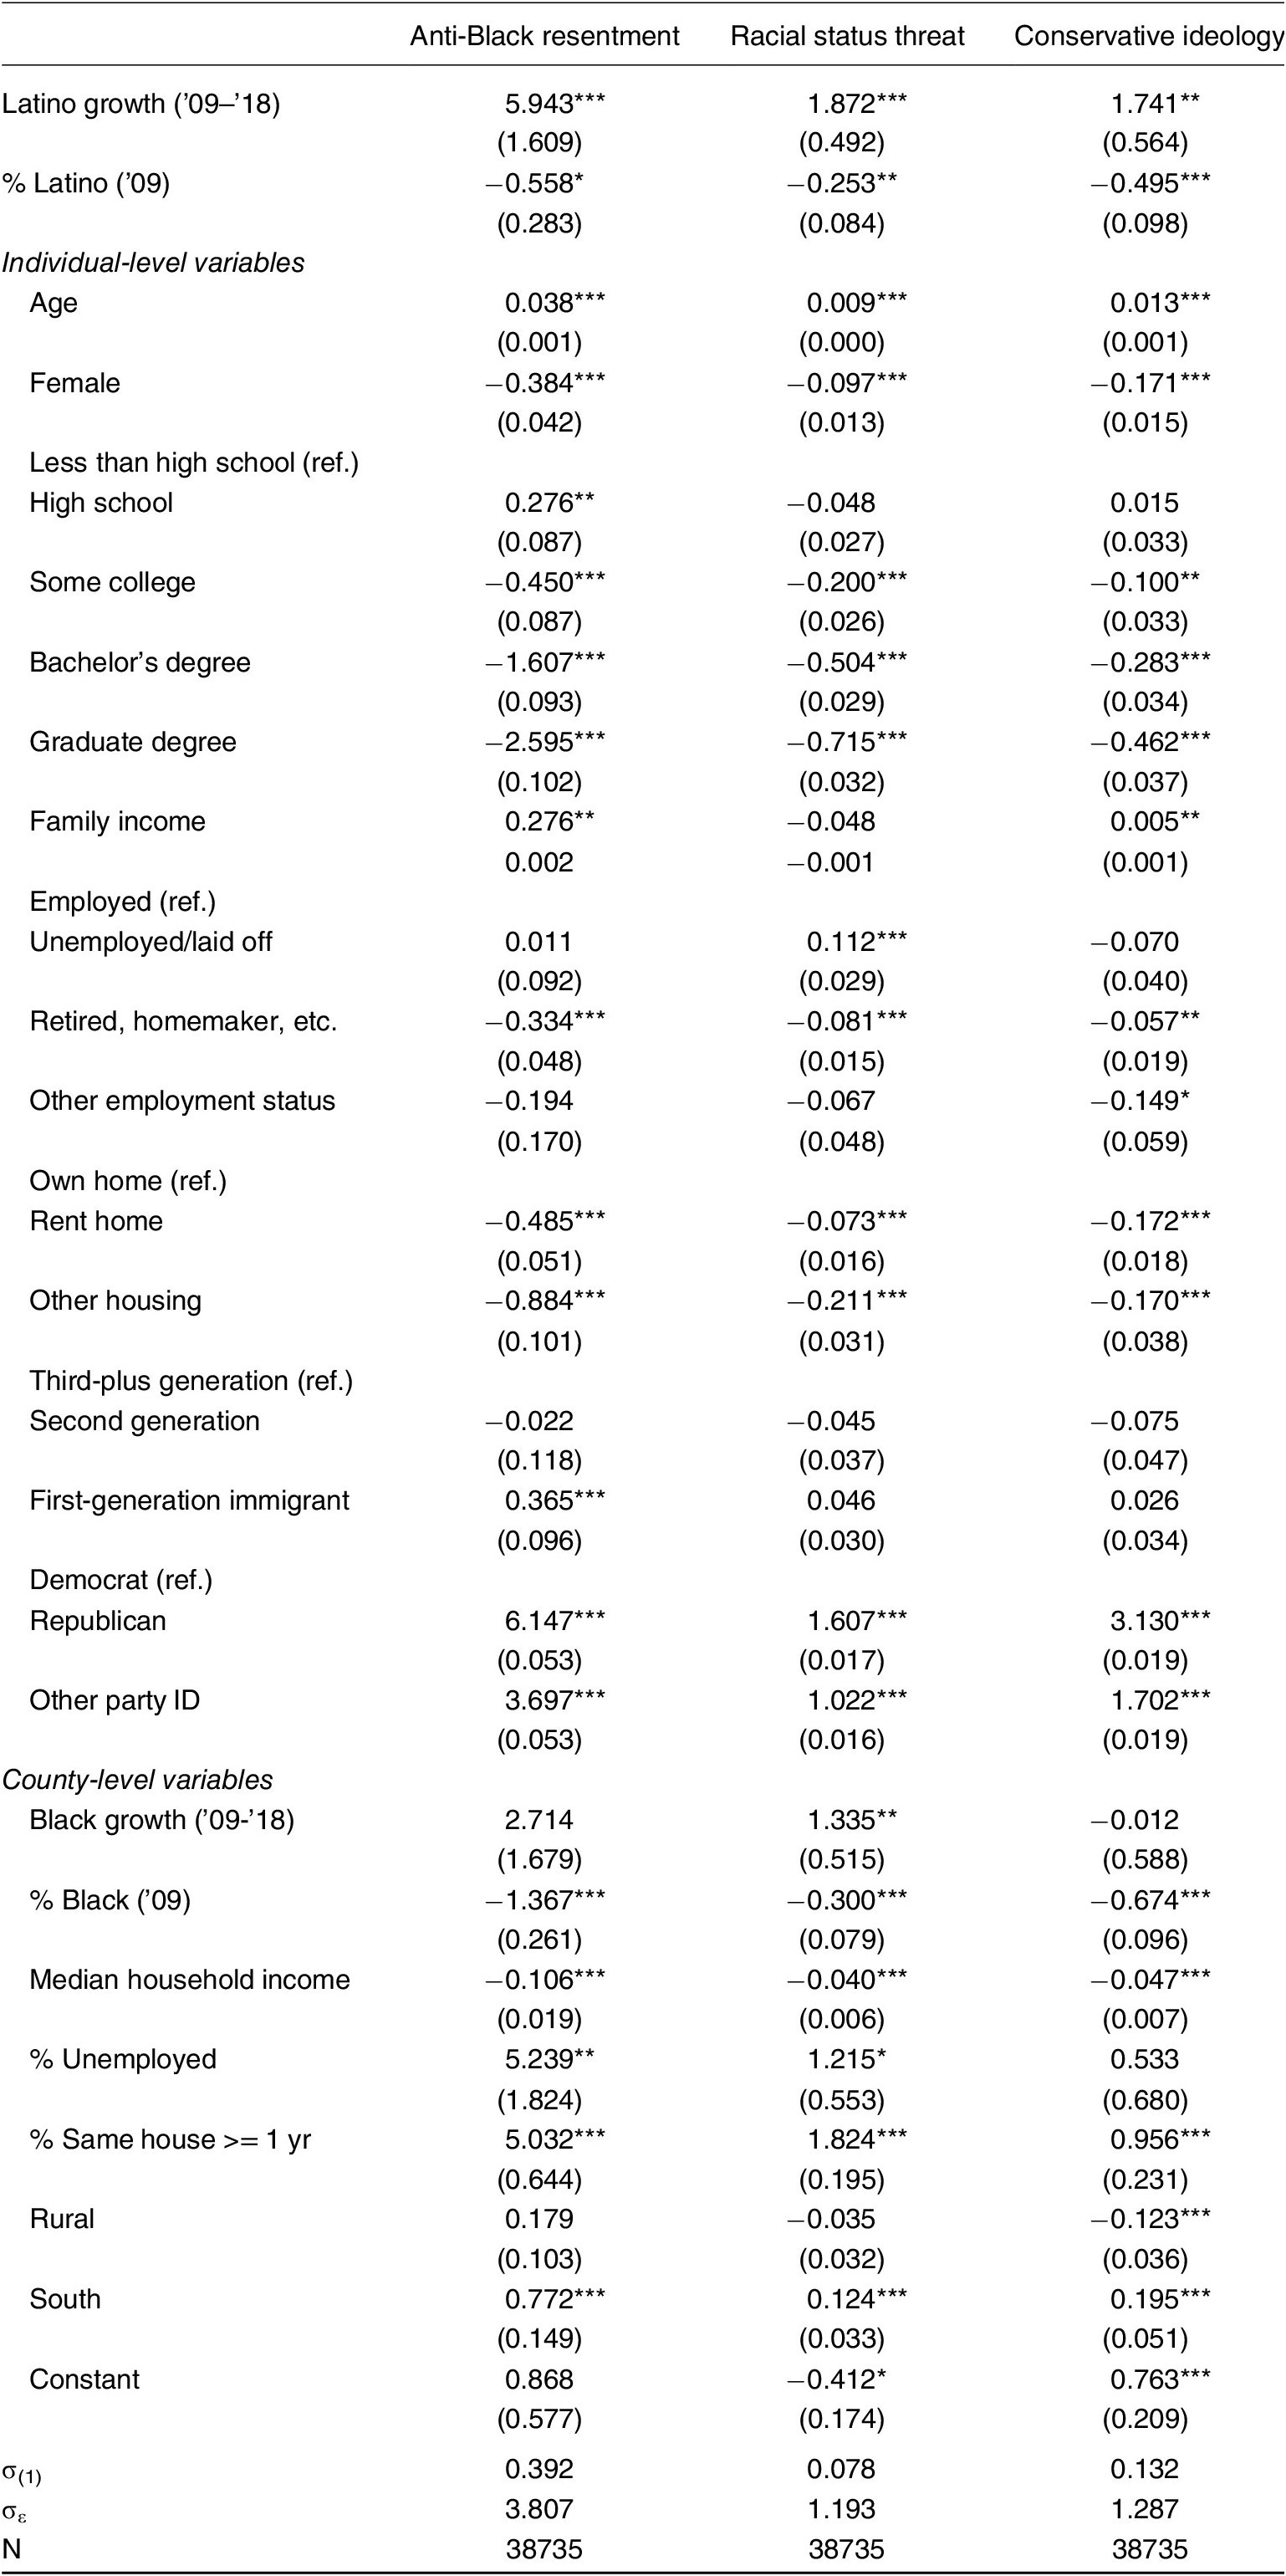
*p < 0.05; **p < 0.01; ***p < 0.001
Holding growth constant, the initial (2009) size of the Latino population is associated with less anti-Black resentment (p < 0.001). This is consistent with intergroup contact theory, which predicts that stable interpersonal contact can improve intergroup relations (Pettigrew and Tropp, Reference Pettigrew and Tropp2006). On the other hand, we should be wary of selection into communities before attributing positive effects to contact based on observational data. After all, White Americans with less progressive racial attitudes are probably more likely to move out of and less likely to move into communities with large Latino populations (e.g., Schachter Reference Schachter2015). I further explore the role of initial Latino population size by interacting it with Latino population growth (Appendix Table A1). Latino growth still significantly predicts greater anti-Black resentment. Moreover, Latino growth predicts even greater anti-Black resentment for respondents in communities with relatively larger initial Latino populations. This finding qualifies the seemingly positive consequences of Latino population size: in communities where the Latino population is large to begin with, additional growth may prompt anti-Black resentment to an even greater extent.Footnote 15
Other contextual predictors that are significantly associated with anti-Black resentment include median household income, associated with less anti-Black resentment; and unemployment rate, county residential stability, and living in the U.S. South, all associated with greater anti-Black resentment.
Next, I turn my attention to two pathways through which Latino population growth might possibly fuel anti-Black resentment: racial status threat and conservatism. To be consistent with mediation, first, racial status threat and conservatism must themselves be predicted by Latino population growth. The second column in Table 2 reports the results of a linear regression predicting racial status threat, captured by disagreement with the statement, “White people in the U.S. have certain advantages.” Latino growth is associated with stronger racial status threat (p < 0.001). Specifically, holding other variables constant, a ten-percentage-point increase in the county Latino population is associated with a 0.19-point increase in racial status threat (on a four-point scale). To put this in context, the statistical effect on racial status threat of a ten-percentage-point increase in the county Latino population is comparable to that of identifying as a Republican as opposed to a Democrat.
Here again, holding growth constant, the initial (2009) size of the Latino population is associated with less racial status threat (p < 0.001). In the case of racial status threat, however, the initial size of the Latino population does not significantly moderate the statistical effect of additional growth (Table A1). Other county-level predictors that are significantly associated with threat include Black population growth, which is associated with greater threat (holding constant the initial size of the Black population); median household income, associated with less threat; and unemployment rate, county residential stability, and living in the U.S. South, all associated with greater threat.
Finally, the third column in Table 2 reports the results of a linear regression predicting ideological conservatism. Latino growth is associated with greater conservatism (p < 0.01). Specifically, holding other variables constant, a ten-percentage-point increase in the county Latino population is associated with a 0.17-point increase in conservatism (on a seven-point scale). To put this in context, the statistical effect on conservatism of a ten-percentage-point increase in the county Latino population is roughly one-half the statistical effect of identifying as a Republican as opposed to a Democrat.
Here again, holding growth constant, the initial (2009) size of the Latino population is associated with less conservatism (p < 0.001). As with racial status threat, the initial size of the Latino population does not significantly moderate the statistical effect of additional growth on conservatism (Table A1). Other county-level predictors that are significantly associated with conservatism include median household income, associated with less conservatism; and unemployment rate, county residential stability, living in a rural county, and living in the U.S. South, all associated with more conservatism.
The Mediating Role of Threat and Conservatism
Does Latino growth drive anti-Black resentment by fueling racial status threat and/or conservatism? If the statistical effect of Latino growth on anti-Black resentment is reduced when we account for racial status threat or conservatism––which are themselves associated with Latino growth––this would serve as prima facie evidence that threat and conservatism mediate the effect of Latino growth.
The first column of Table 3 reports the results of a linear regression predicting anti-Black resentment by Latino growth, racial status threat, and other individual and contextual predictors. Controlling for racial status threat, Latino growth no longer significantly predicts anti-Black resentment (at p < 0.05). Here, a ten-percentage-point increase in the county Latino population is associated with a 0.21-point increase in anti-Black resentment (p = 0.09). This represents a 64% reduction in the size of the statistical effect of Latino growth, compared to a model where threat is not controlled (Model 1, Table 2). To assess whether this reduction is significant, I use the R mediate(.) function (Tingley et al., Reference Tingley, Yamamoto, Hirose, Keele and Imai2014) to estimate 95% confidence intervals using Quasi-Bayesian approximation based on 500 simulations. I do this for each of the fifteen imputed datasets, then pool estimates. The confidence interval around the proportion reduction ranges from about thirty-seven to 100 percent, which indicates that controlling for racial status threat significantly reduces the statistical effect of Latino growth.
Table 3. Linear regressions predicting anti-Black resentment, controlling for perceived threat to Whites’ racial status and conservatism
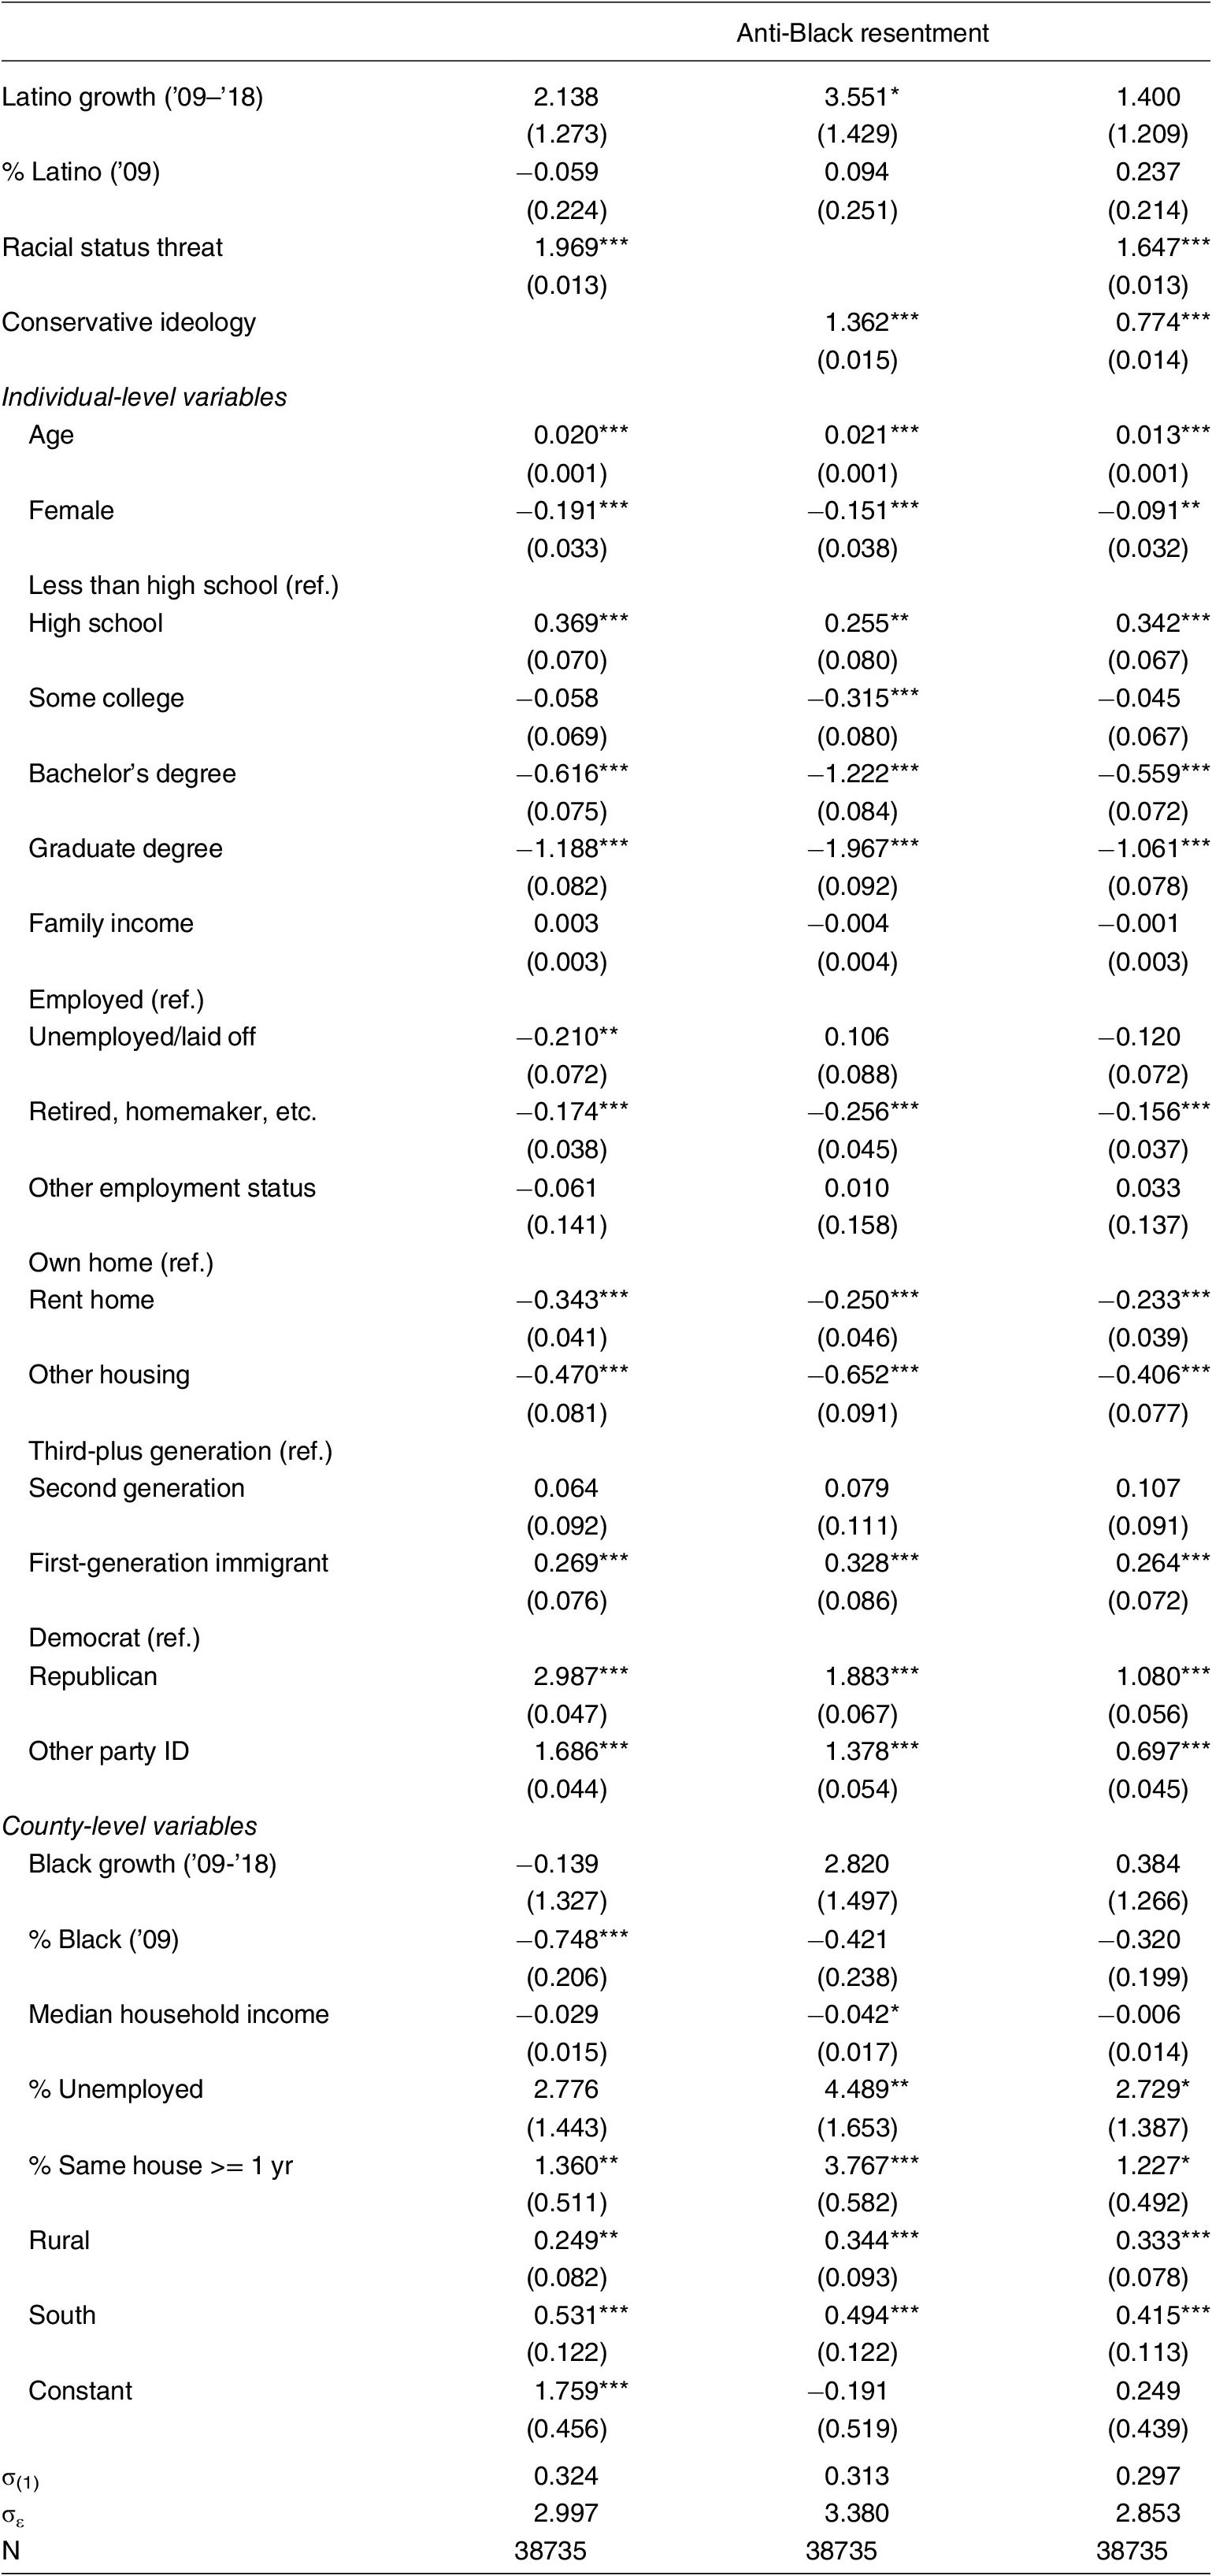
*p < 0.05; **p < 0.01; ***p < 0.001
The second column of Table 3 reports the results of a linear regression predicting anti-Black resentment by Latino growth, conservatism, and other individual and contextual predictors. Latino growth is still associated with stronger anti-Black resentment (p < 0.05), but its statistical effect has been reduced in terms of size. Here, a ten-percentage-point increase in the county Latino population is associated with a 0.35-point increase in anti-Black resentment. This represents a 40% reduction in the size of the statistical effect of Latino growth, compared to a model where threat is not controlled (Model 1, Table 2). I use the same strategy to estimate 95% confidence intervals, which range from eighteen to seventy-five percent. This indicates that controlling for conservative policy preferences significantly reduces the statistical effect of Latino growth.
Finally, the third column of Table 3 reports the results of a linear regression predicting anti-Black resentment by racial status threat and conservatism, simultaneously. Racial status threat remains a significant, positive predictor of anti-Black resentment (p < 0.001), controlling for conservatism. Similarly, conservatism remains a significant, positive predictor of resentment (p < 0.001), controlling for racial status threat. This suggests that racial status threat and conservatism, although they may be related to each other, are independently associated with anti-Black resentment.
It is not advisable to compare the proportions mediated by racial status threat and conservatism, both of which are captured by proxy measures. If one measure is simply a noisier proxy for the construct of interest, for this reason alone, it will be associated with a smaller reduction in the statistical effect of Latino growth. The upshot is that both racial status threat and ideological conservatism plausibly mediate the relationship between Latino growth, on the one hand, and anti-Black resentment on the other.
Conclusions
Studies have repeatedly linked the size but especially growth of Latino and immigrant populations with attitudes toward those groups. A nascent line of work explores the relationship between Latino growth and Whites’ attitudes toward other groups, most notably Blacks. The present study is the first to extend these findings to real—versus manipulated—demographic changes and to a representative sample of Whites. The results reveal that Whites in counties where the Latino population grew more express stronger anti-Black resentment.
What accounts for the association between anti-Black resentment and Latino growth? First, Whites may interpret Latino growth as a threat to their group’s status within a multi-group system, in effect driving resentment toward other non-White groups. In line with this conjecture, I find that Whites in counties where the Latino population grew more perceive Whites as more disadvantaged. Views of White disadvantage, moreover, partly account for the association between Latino growth and anti-Black resentment. Second, Latino growth may engender uncertainty and instability, thereby driving support for conservative views that themselves predict anti-Black resentment. Indeed, I find that Whites in counties where the Latino population grew more identify as more ideologically conservative. Conservatism, moreover, partly accounts for the association between Latino growth and anti-Black resentment.
Additional work is needed to address the limitations of this study. First, observational data can only provide suggestive evidence for the causal effects of Latino growth, racial status threat, and conservatism. And, whereas a growing experimental record corroborates the effects of demographic change and Latino growth, there is limited evidence for the causal role of racial status threat and conservatism (though see Craig and Richeson, Reference Craig and Richeson2014b). Future work should manipulate, rather than simply measure, racial status threat and conservatism, given that regression-based mediation analyses tend to overestimate mediated effects (Gerber and Green, Reference Gerber and Green2012).
Future work may also address a blind spot in this study: Whites’ attitudes toward Asians and their responses to Asian growth. Although Asians are currently the fastest-growing racial/ethnic group in the United States (López et al., Reference López, Ruiz and Patten2017), empirical research has largely neglected Whites’ reactions to Asian growth. This is a significant substantive as well as theoretical oversight (Lee and Huang, Reference Lee and Huang2021). For example, the case of a relatively higher status groups, like Asians, may shed light on the scope conditions around racial status threat. Do responses to the growth of one group, say, generalize only to groups that Whites perceive as being similar in terms of status?Footnote 16
Most broadly, the results of this study suggest that Latino growth specifically and demographic shift generally can carry downstream consequences for Whites’ attitudes toward and treatment of Blacks. The consequences may be especially pronounced when it comes to Whites’ support of policies, like affirmative action, that they associate with both Latino and Black beneficiaries. For advocates of these policies, the results of this study point to a tough road ahead, at least while Whites perceive their group’s status is under threat. This seems to be the order of the day (Gonyea Reference Gonyea2017).
Acknowledgements
I gratefully acknowledge feedback from Christopher Maggio, Emilce Santana, and Edward Telles.
Appendix
Table A1. Linear regressions predicting anti-Black resentment, perceived threat to Whites’ racial status, and conservatism, including by interaction of Latino growth and % Latino

*p < 0.05; **p < 0.01; ***p < 0.001.
Note: Values of Latino size and growth centered at their means to facilitate the interpretation of their coefficients and interaction.


 Open access