


Introduction
Hemifacial spasm (HFS) is a condition characterized by abnormal, involuntary movements affecting one side of the face. The cause of HFS is generally accepted to be compression of the facial nerve by aberrant vasculature in proximity to its exit from the brain stem.Reference Campos-Benitez and Kaufmann1 These spasms can result in a broad range of impairment ranging from mild to disabling. Typical treatment for HFS includes percutaneous intervention such as botulinum toxin injections and microvascular decompression (MVD) of the offending vessel through a small retromastoid craniectomy. Microvascular decompression generally produces robust results, with published estimates demonstrating an approximate cure rate of 90%.Reference Miller and Miller2 However, the utilization of MVD varies according to the availability of neurosurgical expertise and local practice patterns. We aimed to interrogate the Canadian Institute for Health Information (CIHI) database in order to determine the geographic distribution and outcomes of MVD for the treatment of HFS.
Methods
The CIHI database was searched from 2004 to 2014 for a combination of International Classification of Diseases (ICD-10) diagnostic code G51.3 (clonic HFS) and ICD-10 intervention code 1.BA.72.SZ (decompression; facial; intracranial). Using the resulting CIHI data, a new database was populated with the following categories: year, institution, province, and number of interventions per year. Descriptive statistics were generated. Provincial surgery rates of MVD for HFS were calculated using statistics of Canada estimates of provincial population from 2004 to 2017.3 We calculated the provincial annual rates of MVD for HFS by province of surgery and province of residence for patients. The yearly average number of cases of MVD for HFS were divided by the average provincial population over the study period and expressed per million. Internal data were used to identify the out-of-province fraction treated in Manitoba. These cases were re-allocated to their province of residence to determine an adjusted provincial utilization rate of MVD for HFS in each province. Patients from Yukon, Northwest Territories, Nunavut, Newfoundland and Labrador, and Prince Edward Island were allocated as residents of their respective catchment areas in order to reflect the availability of neurosurgery services.
Results
During the period 2004-17, we identified 671 MVDs performed for HFS across Canada (Figure 1). Of all the MVDs in the study period, 286 (42.6%) were performed at one center in Manitoba. Another 131 (19.5%) and 72 (10.7%) were performed at one center in British Columbia and Ontario, respectively. The remaining 182 (27.1%) MVDs for HFS were performed at 17 centers across the rest of Canadian institutions combined where the mean number of cases performed per year was 1.1 (SD=0.9, range=0.2-2.9). Twelve centers performed an average of less than 1 case annually over the 13-year study period. When data was aggregated by province and institution it remained clear that a few centers have a large volume of experience while most centers have a small volume of experience with MVD for HFS (Figure 2).
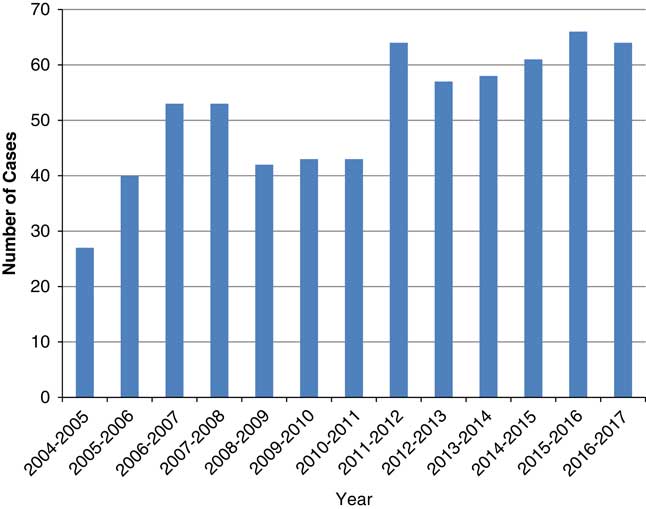
Figure 1 Total number of cases of MVD for HFS across Canada (2004-17).
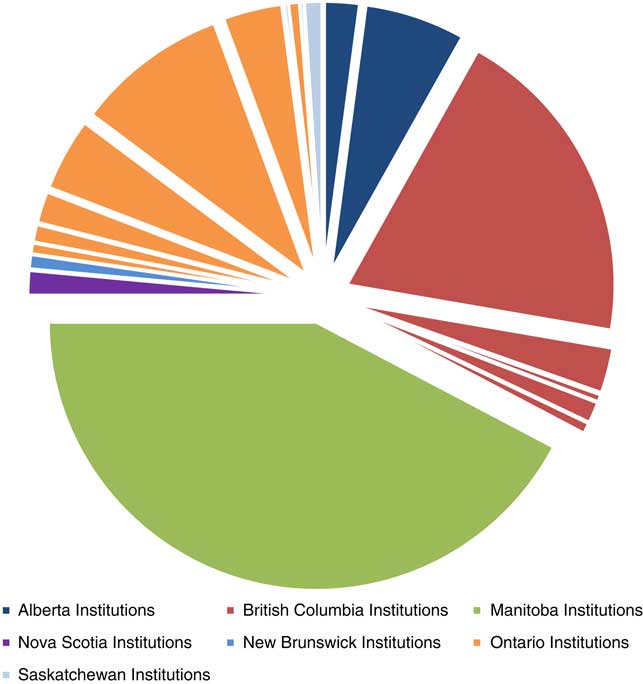
Figure 2 Cumulative MVDs performed for HFS by institution and province (2004-17).
We calculated the provincial annual rates of MVD for HFS by province of surgery and province of residence for patients. Utilization according to province of surgery revealed a large discrepancy with a maximum of 17.2 cases per million persons in Manitoba with the remainder of provinces all performing less than three cases per million persons (Figure 3A). Using internal data, we identified that 60% of patients treated in Manitoba over the study period were residents of other provinces. The adjusted utilization rate of MVD for HFS according to province of residence was calculated by re-allocating these patients to their respective province of origin. These adjusted provincial utilization rates ranged from 6.2 for Manitobans, 2.9 for British Columbians and less than two cases per million per year across the rest of Canada (Figure 3B).
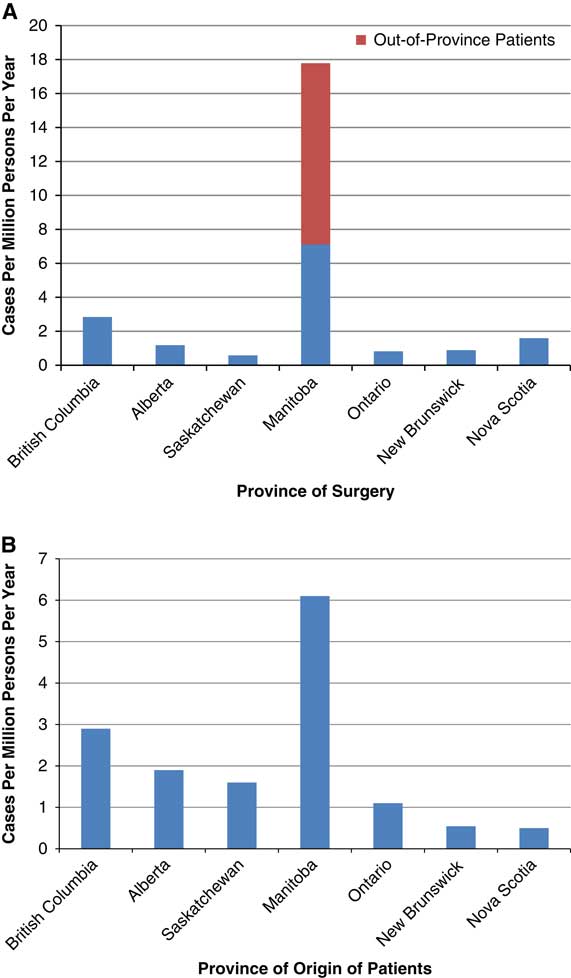
Figure 3 (A) Rate of MVD for HFS per million of provincial population per year (2004-17). (B) Adjusted utilization of MVD for HFS expressed per million of provincial population per year (2004-17).
Discussion
There is a clear geographic disparity in the utilization of surgery for HFS. From 2004 to 2017, 43% of MVDs for HFS were performed at one center and 73% at three centers across Canada. Meanwhile, 12 Canadian centers performed the surgery once or less per year over the study period. Several regional differences are apparent on review of this data. First, most centers in Canada perform very few MVDs each year. For example, in Ontario the cases are distributed between eight centers such that none develops a high volume of experience despite the large provincial population. Second, MVD for HFS is not widely used nationwide and utilization rates vary considerably from province to province. Third, the aggregation of patients undergoing surgery in Manitoba may reflect limitations in availability and access in other provinces, or patient desire to undergo surgery at highest volume centers. The latter may become increasingly commonplace, with growing self-education of patients and their families as well as literature demonstrating greater surgical success at higher volume centers.
Our data are in agreement with other North American results. Kalkanis et al demonstrated that in the United States the average number of MVDs for HFS performed at non-federal hospitals is only 237 cases per year and the average number of MVDs for all indications performed by these neurosurgeons was only three cases per year.Reference Kalkanis, Eskandar, Carter and Barker4 Our data reinforces the literature demonstrating the North American surgical experience consisting of relatively few surgeons having a large volume of experience with MVDs, while the remainder of surgeons have very low annual caseloads.
Several explanations may be put forward to explain the observed geographical disparity in Canada. Low-institutional experience may lead to reluctance to engage in MVDs, while high-institutional experience leads to greater confidence and willingness to engage in MVDs. This results in a cycle causing the stratification between low-volume and high-volume centers. The observed geographic disparity may also be related to variation in the perception of healthcare providers with regards to the position of MVD in the management algorithms for HFS. Indeed, there are no well-known guidelines to direct primary care or surgical providers on when to seek surgical management for HFS. Proponents of botulinum toxin as primary treatment for HFS point to high rates of patient satisfaction and low complication rates,Reference Defazio, Abbruzzese and Girlanda5 while others have found improved quality of life scores achieved with MVD surgery.Reference Lawrence, Frederickson, Chang, Weiss, Gerszten and Sekula6 Thus, the observed disparity may be attributable to variations in practice patterns and healthcare provider beliefs regarding the relative efficacy, functional outcomes, and cost-effectiveness of interventional therapies such as botulinum toxin relative to MVD. Finally, easy accessibility to alternative treatment options such as botulinum toxin as well as surgical therapy may be speculated to vary from province to province.
There are several limitations to the present study. First, the CIHI database excludes Quebec and so a truly nationwide sample has not been presented. Second, patients who undergo surgery at a location other than their home province are not accounted for in the CIHI database. We attempted to minimize this bias by using internal data to represent the fraction of patients who received treatment in Manitoba but were from other provinces. We lacked data to perform a similar redistribution for patients seeking out-of-province care at centers other than Manitoba. Heterogeneity of input into the CIHI database including the specific diagnostic and intervention code may result in missing data. Finally, outcomes collected in the CIHI database only include length of stay and discharge disposition, and so a more generalized association between outcomes and case volume is not possible with the current data.
Conclusion
The bulk of MVDs for HFS are performed by relatively few surgeons, and most centers in Canada achieve a mean of only 1 case per year. There is a tremendous geographic variation in utilization of MVD for HFS across Canada. Some reasons for this geographic disparity may include institutional experience with MVDs, beliefs about the comparative efficacy of surgical management versus botulinum toxin, accessibility to services, and patient self-selection.
Disclaimer
This study has not been published in whole or in part elsewhere and is not under simultaneous consideration for publication elsewhere.
Parts of this material are based on data and information provided by the Canadian Institute for Health Information. However, the analysis, conclusions, opinions, and statements expressed here are those of the authors, and not necessarily those of the Canadian Institute for Health Information.
Disclosure Information
Mohamed Somji and Anthony M. Kaufmann have nothing to disclose.
Statement of Authorship
Both authors contributed jointly to all aspects of the paper.


 Open access