Introduction
Much of our knowledge of biodiversity patterns and changes comes from the data based on mammals, birds and vascular plants (e.g., Gillison et al., Reference Gillison, Bignell, Brewer, Fernandes and Jones2013). Yet these taxa represent only a fraction of biodiversity; the major component of terrestrial biodiversity comprises insects (Mora et al., Reference Mora, Tittensor, Adl, Simpson and Worm2011). A recent meta-analysis of biodiversity studies revealed the dearth of information about most of the world's tropical biota (Gillison et al., Reference Gillison, Bignell, Brewer, Fernandes and Jones2013), highlighting the fact that in order to decipher biodiversity patterns and change the major component can no longer be ignored. The absence of data on insects in biodiversity surveys, with the exception of small groups of charismatic taxa such as butterflies, dragonflies and dung beetles (e.g., Korasaki et al., Reference Korasaki, Lopes, Gardner-Brown and Louzada2013; Hart et al., Reference Hart, Bowker, Tarboton and Downs2014; Zografou et al., Reference Zografou, Kati, Grill, Wilson, Tzirkalli, Pamperis and Halley2014), reflects the taxonomic challenges associated with the huge diversity of this group of relatively small-sized organisms (Floyd et al., Reference Floyd, Wilson, Hebert, Foottit and Aler2009). Obtaining insect samples is not an obstacle to collecting this data as many efficient sampling techniques have been developed (e.g., Russo et al., Reference Russo, Stehouwer, Heberling and Shea2011, and in particular Malaise traps) but the investment required to sort and classify these samples is prohibitive. Fortunately, modern technology is addressing this impediment. First, conventional (single specimen) DNA barcoding, the use of short cytochrome c oxidase I mtDNA (COI) sequences as species identification tags (Hebert et al., Reference Hebert, Cywinska, Ball and deWaard2003), has been applied to rapidly accelerate biodiversity surveys in hyperdiverse insect groups (e.g., ants of Madagascar; Smith et al., Reference Smith, Fisher and Hebert2005). Now, with next-generation-sequencing technologies allowing simultaneously sequencing of DNA fragments from multiple specimens in a bulk mixture of diverse taxa, termed metabarcoding (Yu et al., Reference Yu, Ji, Emerson, Wang, Ye, Yang and Ding2012), the impediment is being alleviated further.
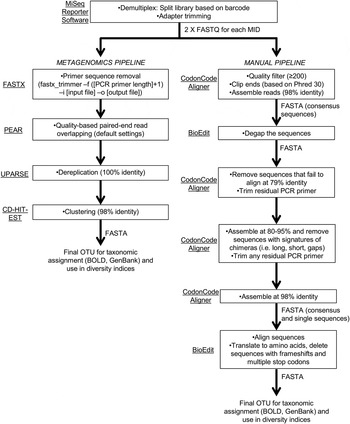
Metabarcoding is simply the pairing of DNA-based species recognition with high-throughput (next-generation) DNA sequencing (HTS) (Ji et al., Reference Ji, Ashton, Pedley, Edwards, Tang, Nakamura, Kitching, Dolman, Woodcock, Edwards, Larsen, Hsu, Benedick, Hamer, Wilcove, Bruce, Wang, Levi, Lott, Emerson and Yu2013). Consequently, metabarcoding, like conventional DNA barcoding, relies on ‘universal’ polymerase chain reaction (PCR) primers that can amplify a fragment of a standard DNA region from diverse taxa (Ji et al., Reference Ji, Ashton, Pedley, Edwards, Tang, Nakamura, Kitching, Dolman, Woodcock, Edwards, Larsen, Hsu, Benedick, Hamer, Wilcove, Bruce, Wang, Levi, Lott, Emerson and Yu2013). Due to the limitations in the size of DNA fragments sequenced by HTS platforms (see Shokralla et al., Reference Shokralla, Gibson, Nikbakht, Janzen, Hallwachs and Hajibabaei2014), metabarcoding has typically been restricted to targeting short fragments of the COI DNA barcode (e.g., Hajibabaei et al., Reference Hajibabaei, Shokralla, Zhou, Singer and Baird2011; Zeale et al., Reference Zeale, Butlin, Barker, Lees and Jones2011). Prior to the coining of the word ‘metabarcoding’, the idea of ‘mini-barcodes’ had been investigated in the context of degraded DNA samples (Hajibabaei et al., Reference Hajibabaei, Smith, Janzen, Rodriguez and Whitefield2006). Hajibabaei et al. (Reference Hajibabaei, Smith, Janzen, Rodriguez and Whitefield2006) concluded that 135 bp fragments of COI can distinguish most species, but the location of the fragment within the full-length DNA barcode (~658 bp) is important. After further exploration of primer binding sites and species resolution offered by different fragments within the COI DNA barcode region, Meusnier et al. (Reference Meusnier, Singer, Landry, Hickey, Hebert and Hajibabaei2008) designed and advocated the use of Uni-MinibarF1 and Uni-MinibarR1 primers (amplifying a 130 bp fragment; see fig. 1) as a universal (eukaryote) primer set for the amplification of mini-barcodes (Meusnier et al., Reference Meusnier, Singer, Landry, Hickey, Hebert and Hajibabaei2008). Zeale et al. (Reference Zeale, Butlin, Barker, Lees and Jones2011) designed and tested primers (ZBJ-ArtF1c and ZBJ-ArtR2c; see fig. 1) which amplify a 160 bp fragment from the 5′ end of COI for application in the study of arthropod prey in bat guano. These primers have since been used extensively in metabarcoding-type studies of diets (e.g., Bohmann et al., Reference Bohmann, Monadjem, Lehmkuhl-Noer, Rasmussen, Zeale, Clare, Jones, Willerslev and Gilbert2011; Razgour et al., Reference Razgour, Clare, Zeale, Hanmer, Schnell, Rasmussen, Gilbert and Jones2011; Vesterinen et al., Reference Vesterinen, Lilley, Laine and Wahlberg2013; Burgar et al., Reference Burgar, Murray, Craig, Haile, Houston, Stokes and Bunce2014; Hope et al., Reference Hope, Bohmann, Gilbert, Zepeda-Mendoza, Razgour and Jones2014; Piñol et al., Reference Piñol, San-Andrés, Clare, Mir and Symondson2014a ). Other primers were designed by Leray et al. (Reference Leray, Yang, Meyer, Mills, Agudelo, Ranwez, Boehm and Machida2013) for the analysis of the (metazoan) diets of fish collected at coral reefs, targeting ~330 bp fragments of DNA barcode suitable for amplicon 454 pyrosequencing.
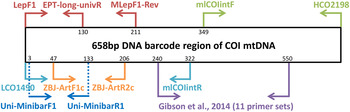
Fig. 1. Relative positions of primers on the COI barcode region.
Besides diet studies, metabarcoding has been applied to environmental monitoring (Hajibabaei et al., Reference Hajibabaei, Shokralla, Zhou, Singer and Baird2011). Hajibabaei et al. (Reference Hajibabaei, Shokralla, Zhou, Singer and Baird2011) collected aquatic insect samples in southern Ontario, Canada, for a test of metabarcoding, targeting a 130 bp fragment of COI (LepF1 primer paired with a newly designed reverse primer – EPT-long-univR; see fig. 1). Metabarcoding of bulk Malaise trap samples took off with Yu et al. (Reference Yu, Ji, Emerson, Wang, Ye, Yang and Ding2012) with a ‘biodiversity soup’ study. This study employed primers typically used for DNA barcoding of insects (Folmer et al., Reference Folmer, Black, Hoeh, Lutz and Vrijenhoek1994; also see Wilson, Reference Wilson, Kress and Erikson2012) for amplicon 454 pyrosequencing producing sequenced fragments (~400 bp) which when assembled together cover the full-length DNA barcode (~658 bp). Liu et al. (Reference Liu, Li, Lu, Su, Tang, Zhang, Zhou, Zhou, Yang, Ji, Yu and Zhou2013) used the same samples (from Yu et al., Reference Yu, Ji, Emerson, Wang, Ye, Yang and Ding2012) to develop a new bioinformatics pipeline ‘SOAPBarcode’ utilizing Illumina (HiSeq 2000) shotgun sequencing of the amplicons; in brief, 150 bp sections of the amplicon are sequenced and then assembled together to form the full-length DNA barcode. The use of metabarcoding as a source of data for conservation policy-making was validated by Ji et al. (Reference Ji, Ashton, Pedley, Edwards, Tang, Nakamura, Kitching, Dolman, Woodcock, Edwards, Larsen, Hsu, Benedick, Hamer, Wilcove, Bruce, Wang, Levi, Lott, Emerson and Yu2013) who compared metabarcoding datasets against standard biodiversity datasets in Malaysia (metabarcoded Malaise dataset versus birds, dung beetles, ants), China (light trap collected moths, both metabarcoded and morphologically identified) and England (metabarcoded whole pitfall-trap dataset versus ants, spiders, carabid beetles). Like Yu et al. (Reference Yu, Ji, Emerson, Wang, Ye, Yang and Ding2012), Ji et al. (Reference Ji, Ashton, Pedley, Edwards, Tang, Nakamura, Kitching, Dolman, Woodcock, Edwards, Larsen, Hsu, Benedick, Hamer, Wilcove, Bruce, Wang, Levi, Lott, Emerson and Yu2013) used degenerate Folmer primers for amplicon 454 pyrosequencing. Yang et al. (Reference Yang, Wang, Miller, Marleen-de-Blécourt, Ji, Yang, Harrison and Yu2014) also followed the protocols of Yu et al. (Reference Yu, Ji, Emerson, Wang, Ye, Yang and Ding2012) to test the metabarcoding approach on soil and leaf-litter samples for rapid environmental monitoring in terrestrial ecosystems.
The reliance on ‘universal’ primers and associated biases has been of concern to the early practitioners of metabarcoding. Hajibabaei et al. (Reference Hajibabaei, Shokralla, Zhou, Singer and Baird2011) reported a taxonomic bias for their LepF1 and EPT-long-univR primer set (fig. 1) as well as biases due to varying abundances of species in bulk samples (Hajibabaei et al., Reference Hajibabaei, Shokralla, Zhou, Singer and Baird2011). Yu et al. (Reference Yu, Ji, Emerson, Wang, Ye, Yang and Ding2012) reported limitations of the classic ‘Folmer’ barcoding primers, particularly in regard to amplification of hymenopterans. In vitro PCR analyses by Clarke et al. (Reference Clarke, Soubrier, Weyrich and Cooper2014) with five primer sets targeting COI and 16S rDNA suggested a primer bias of COI markers towards lepidopteran and dipteran species with certain orders failing to amplify. In response to these simulated and empirical observations of primer biases in metabarcoding, Zhou et al. (Reference Zhou, Li, Liu, Yang, Su, Zhou, Tang, Fu, Li and Huang2013) developed a new PCR-free Illumina pipeline for DNA-based biodiversity assessment in bulk samples. Although the PCR-free Illumina pipeline (Zhou et al., Reference Zhou, Li, Liu, Yang, Su, Zhou, Tang, Fu, Li and Huang2013) enabled the successful identification of 97% of (73) species in a pooled sample, the pipeline produced large amounts (99.47%) of redundant data i.e., sequences not (presently) useful for taxonomic identification purposes, despite a mitochondrial enrichment step. Tang et al. (Reference Tang, Tan, Meng, Yang, Su, Liu, Song, Li, Wu, Zhang and Zhou2014) followed this work omitting mitochondrial enrichment with similar results. Another approach to limit primer biases in metabarcoding has been to use multiplex PCR (multiple primers) prior to amplicon sequencing (Gibson et al., Reference Gibson, Shokralla, Porter, King, van-Konynenburg, Janzen, Hallwachs and Hajibabaei2014). In order to maximize taxon detection, Gibson et al. (Reference Gibson, Shokralla, Porter, King, van-Konynenburg, Janzen, Hallwachs and Hajibabaei2014) used 11 unique PCR primer sets which all targeted the same 310 bp fragment of the standard COI DNA barcode (see fig. 1).
Despite the advancements in PCR-free and multiplex PCR pipelines, metabarcoding using universal primers for bulk PCR amplification still remains the most cost-effective and time-efficient protocol. PCR-free approaches generate a huge volume of redundant (un-utilized i.e., non-barcode) sequences. Only ~0.53% of raw sequences were mitochondrial sequences (Tang et al., Reference Tang, Tan, Meng, Yang, Su, Liu, Song, Li, Wu, Zhang and Zhou2014), even after mitochondrial enrichment (Zhou et al., Reference Zhou, Li, Liu, Yang, Su, Zhou, Tang, Fu, Li and Huang2013). In addition, shotgun, PCR-free approaches could miss the COI barcode target due to insufficient sequencing (Tang et al., Reference Tang, Tan, Meng, Yang, Su, Liu, Song, Li, Wu, Zhang and Zhou2014), especially as bulk samples are pooled for cost-efficiency. The payoffs from multiplex PCR deserve a more systematic evaluation – 11 primer sets recovered 91% of the known species in a pooled sample (Gibson et al., Reference Gibson, Shokralla, Porter, King, van-Konynenburg, Janzen, Hallwachs and Hajibabaei2014), whereas a single primer set has been reported as successfully amplifying 91% of tested taxa (Leray et al., Reference Leray, Yang, Meyer, Mills, Agudelo, Ranwez, Boehm and Machida2013). Such comparisons are likely to be idiosyncratic, but undoubtedly depend on the ‘universality’ of the single primer sets being compared; and it is worth to note that Gibson et al. (Reference Gibson, Shokralla, Porter, King, van-Konynenburg, Janzen, Hallwachs and Hajibabaei2014) did not make a comparison with the standard DNA barcoding primers. In addition, for cost-effective metabarcoding, the Illumina sequencing platform may be preferred due to its low sequencing cost compared with Roche 454 platforms (Yu et al., Reference Yu, Ji, Emerson, Wang, Ye, Yang and Ding2012; Liu et al., Reference Liu, Li, Lu, Su, Tang, Zhang, Zhou, Zhou, Yang, Ji, Yu and Zhou2013; Yang et al., Reference Yang, Wang, Miller, Marleen-de-Blécourt, Ji, Yang, Harrison and Yu2014). The Roche 454 platform has an estimated processing cost of US$240–415 per metabarcode sample, whereas the processing cost using an Illumina platform is estimated as half this value (Yu et al., Reference Yu, Ji, Emerson, Wang, Ye, Yang and Ding2012; Liu et al., Reference Liu, Li, Lu, Su, Tang, Zhang, Zhou, Zhou, Yang, Ji, Yu and Zhou2013; Yang et al., Reference Yang, Wang, Miller, Marleen-de-Blécourt, Ji, Yang, Harrison and Yu2014). An Illumina Miseq v2 can produce up to 15 million reads per run while Roche 454 FLX Titanium can generate 1 million reads per run (Glenn, Reference Glenn2014; also see Liu et al., Reference Liu, Li, Lu, Su, Tang, Zhang, Zhou, Zhou, Yang, Ji, Yu and Zhou2013; Shokralla et al., Reference Shokralla, Gibson, Nikbakht, Janzen, Hallwachs and Hajibabaei2014). Furthermore, Roche is considered a ‘Zombie platform’ (Glenn, Reference Glenn2014). The objectives of this study were: (1) to test and compare universal primer sets on a diverse set of arthropod orders to establish the optimal primer set for metabarcoding a tropical Malaise trap sample, while also considering the short read-length requirements of the Illumina platform; and (2) to test and compare the ease-of-use and reliability of the outputs from two bioinformatic pipelines (metagenomic and manual) to establish the optimal quality control and filtering pipeline for ‘real-world’ application of arthropod metabarcoding.
Materials and methods
Sample collection, selection and DNA extraction
A Malaise trap was set at Rimba Ilmu Botanic Garden, University of Malaya, Kuala Lumpur, Malaysia between 7 and 13 June 2014. From the bulk sample collected, 80 morphologically distinct specimens were selected as a test dataset, with the aim of maximizing taxonomic diversity. The specimens were pinned and oven-dried for 24 h. Based on examination of morphological characters (Triplehorn & Johnson, Reference Triplehorn and Johnson2005) the test dataset included species from the orders: Lepidoptera, Hymenoptera, Araneae, Blattodea, Coleoptera, Orthoptera, Odonata, Diptera, Hemiptera, Collembola and Mantodea (table 1). Genomic DNA was extracted from the whole bodies of smaller specimens and two legs of larger specimens using a NucleoSpin Tissue kit (Macherey-Nagel, Germany), following the manufacturer's instructions. A NanoDrop spectrophotometer (NanoDrop 2000c UV-Vis Spectrophotometer, Thermo Scientific) was used for DNA purity and concentration assessment.
Table 1. Amplification success for five tested primer sets. Amplification success for bulk PCR using two primer sets was estimated by BLAST-matching Illumina reads to Sanger sequences (e-value <1e-100); the results from two Illumina runs are shown in parentheses.

Primer selection and testing: individual specimen
Four primer sets were retrieved from the metabarcoding literature: (i) ZBJ-ArtF1c/ZBJ-ArtR2c (Zeale et al., Reference Zeale, Butlin, Barker, Lees and Jones2011), (ii) Uni-MinibarF1/Uni-MinibarR1 (Meusnier et al., Reference Meusnier, Singer, Landry, Hickey, Hebert and Hajibabaei2008), (iii) mlCOIintF/HCO2198 (Leray et al., Reference Leray, Yang, Meyer, Mills, Agudelo, Ranwez, Boehm and Machida2013), (iv) LCO1490/mlCOIintR (Leray et al., Reference Leray, Yang, Meyer, Mills, Agudelo, Ranwez, Boehm and Machida2013) (table 1). In addition, a new reverse primer (MLepF1-Rev) was designed for use with the standard barcoding primer LepF1 (Hebert et al., Reference Hebert, Penton, Burns, Janzen and Hallwachs2004). In our previous studies we have found high amplification success with the standard barcoding primer MLepF1 (Smith et al., Reference Smith, Rodriguez, Whitfield, Deans, Janzen, Hallwachs and Hebert2008b ; also see Wilson, Reference Wilson, Kress and Erikson2012) and noted its binding site around 200 bp from LepF1 (fig. 1). Consequently, we used the program Primer3 Plus (Rozen & Skaletsky, Reference Rozen, Skaletsky, Krawetz and Misener2000) and a set of diverse high-quality insect COI sequences from another study (Wong et al., Reference Wong, Lim and Wilson2015) to select a 22 bp region slightly downstream of MLepF1 with appropriate structural and physical properties for primer binding. We included two degenerate bases (Ws) to create a reverse version of MLepF1 (named MLepF1-Rev). In preliminary testing with individual specimens, we found very low amplification success with ZBJ-ArtF1c/ZBJ-ArtR2c, therefore we proceeded with LC01490 (the standard COI barcoding primer) and ZBJ-ArtR2c as an alternative combination.
PCR amplification was performed in a total volume of 25 µl with 0.25 µl of each forward and reverse primer (10 µM), 12.5 µl of Taq98® Hot Start 2X Master Mix (Lucigen, USA), 10 µl ddH20 and 2 µl of genomic DNA. For each primer set, we followed the thermocycling programs recommended by previous studies: for LCO1490/ZBJ-ArtR2c a touch-down program (40 cycles) with annealing temperatures 61–53°C was followed (Zeale et al., Reference Zeale, Butlin, Barker, Lees and Jones2011); for Uni-MinibarF1/Uni-MinibarR1 a ‘touch-up’ program (40 cycles) with annealing temperatures of 46 and 53°C was followed (Meusnier et al., Reference Meusnier, Singer, Landry, Hickey, Hebert and Hajibabaei2008); for mlColintF/HCO2198 and LCO1490/mlCOlintR a touch-down program (41 cycles) with annealing temperatures between 62 and 46°C was followed (Leray et al., Reference Leray, Yang, Meyer, Mills, Agudelo, Ranwez, Boehm and Machida2013); for LepF1/MLepF1-Rev we followed ‘COI Fast’ (40 cycles) (Wilson, Reference Wilson, Kress and Erikson2012). Success of PCR amplifications was checked on 2% agarose gels. A clear band of expected length (refer to fig. 1) indicated amplification success, whereas the absence of a band was recorded as PCR amplification failure.
Primer selection and testing: bulk PCR and Illumina sequencing
Based on the results from the individual specimen tests (see above), the two primer sets with the highest amplification success were selected and modified to include Illumina sequencing adapters with multiplex identifiers (following Bartram et al., Reference Bartram, Lynch, Stearns, Moreno-Hagelsieb and Neufeld2011; table 2). The 80 test DNA extracts were pooled (1–15 µl of DNA extract from each specimen depending on the measured DNA concentration) and used for bulk PCR using the two modified primer sets. Initially PCR amplification was performed in a total volume of 25 µl with 0.25 µl of each forward and reverse primer (10 µM), 12.5 µl of Taq98® Hot Start 2X Master Mix (Lucigen, USA), 10 µl ddH20 and 2 µl of pooled genomic DNA. For each primer set, we followed the thermocycling programs from above. Success of PCR amplifications was checked on 2% agarose gels. Amplicons were gel extracted and purified using a NucleoSpin Gel and PCR Clean-up kit (Macherey-Nagel, Germany), following the manufacturer's instructions. The libraries were quantified using KAPA library quantification kit (KAPA Biosystems, South Africa), normalized, pooled and sequenced on a MiSeq Desktop Sequencer (Illumina, USA) constituting approximately 0.5% of a MiSeq V2 500 cycle kit. Paired-end sequencing was performed at the Monash University Malaysia Genomics Facility.
Table 2. Primers used in this study. The Illumina adapter sequences incorporating a multiplex identifier are shown in square brackets.

Subsequently a second Illumina MiSeq run was conducted with amplicons produced by PCR in a total volume of 25 µl with 2.5 µl of each forward and reverse primer (10 µM), 2.0 µl of dNTPs, 0.25 µl of Accura™ High-Fidelity Polymerase (Lucigen, USA), 12.5 µl of Accura™ 2X HF buffer (Lucigen, USA), 3.25 µl of ddH2O and 2 µl of mixed genomic DNA. The thermocycling profile was modified to minimize chimera formation (fewer cycles with longer extension times) during PCR: for [V3]mlColintF/[MID96]HCO2198 , 95°C for 2 min; 25 cycles of 95°C for 15 s; 51°C for 30 s; 72°C for 3 min and a final extension of 72°C for 10 min; for [V3]LepF1/[MID95]MLepF1-Rev, 95°C for 2 min; 25 cycles of 95°C for 15 s; 45°C for 30 s; 72°C for 3 min and a final extension of 72°C for 10 min. Five independent PCR products for each primer set were pooled prior to gel extraction. The next steps followed as above with each sample comprising approximately 2.75% of the sequencing run.
Quality control and filtering pipelines
Sequencing reads were demultiplexed and adapter-trimmed onboard the MiSeq using the MiSeq Reporter software. This resulted in a ‘raw’ output of two paired-end FASTQ files for each primer set (fig. 2). We followed two pipelines (fig. 2) for quality control and filtering of the paired-end reads: (a) a simplified metagenomics pipeline (by HMG) incorporating FASTX (Hannon Lab, 2014), PEAR (Zhang et al., Reference Zhang, Kobert, Flouri and Stamatakis2014), UPARSE (Edgar, Reference Edgar2013) and CD-HIT-EST (Fu et al., Reference Fu, Niu, Zhu, Wu and Li2012); (b) we screened and filtered the reads ‘manually’ using CodonCode Aligner (CodonCode Corp.) and BioEdit (Hall, Reference Hall1999) (by GJBM & JJW).

Fig. 2. Schematic of bioinformatic steps (metagenomic and manual pipelines).
The 80 individual DNA extractions were also used for PCR amplification with Folmer primers (following standard methods; Wilson, Reference Wilson, Kress and Erikson2012) and the products, or alternatively PCR products generated during the individual specimen primer tests (see above), were sequenced by a local company (MyTACG Bioscience). These Sanger sequences are available on BOLD (Ratnasingham & Hebert, Reference Ratnasingham and Hebert2007) in the public project MBPT. The assembled and dereplicated Illumina reads were ‘BLASTed’ (Altschul et al., Reference Altschul, Gish, Miller, Myers and Lipman1990) against the Sanger sequences to give an estimate of the species surviving the bulk PCR and Illumina sequencing (i.e., the detection rate based on hits with an e-value of <1e−100). Additionally, we built neighbor-joining (NJ) trees (in MEGA 6; Tamura et al., Reference Tamura, Stecher, Peterson, Filipski and Kumar2013) combining the filtered metabarcode Operational Taxonomic Units (OTU) and Sanger sequences. The single representative of Odonata did not generate a Sanger sequence, but was traced among the OTU by BLAST searches against GenBank.
Results
Primer testing: individual specimen
The primer sets mlCOIintF/HCO2198 and LepF1/MLepF1-Rev showed the highest amplification success (both 98%), followed by Uni-MinibarF1/Uni-MinibarR1 (63%), LCO1490/ZBJ-ArtR2c (20%) and LCO1490/mlCOIintR (5%) (table 2, fig. 3). Consequently mlCOIintF/HCO2198 and LepF1/MLepF1-Rev were used for further evaluation.

Fig. 3. (a) Amplification success rate for primer sets in conventional single specimen PCR; (b) detection rate of two primer sets used in bulk PCR and Illumina sequencing based on the percentage of Sanger sequences BLAST-matched to HTS reads with an e-value <1e−100.
Primer testing: bulk PCR and Illumina sequencing
FASTQ files related to this study are available in the NCBI short read archive under accession SRR1848965. The first sequencing run produced 106,070 paired-end reads for the LepF1/MLepF1-Rev primer set (28 Mb) and 133,806 paired-end reads for the mlCOlintF/HCO2198 primer set (35M b). The detection rate of input species was 60% for the LepF1/MLepF1-Rev primer set and 64% for the mlCOlintF/HCO2198 primer set (fig. 3). A second sequencing run at greater sequencing depth produced 685,208 paired-end reads for the LepF1/MlepF1-Rev primer set (167 Mb) and 725,930 paired-end reads for the mlCOlintF/HCO2198 primer set (136 Mb) (table 3). The detection rate of input species was 80% for the LepF1/MLepF1-Rev primer set and 90% for the mlCOlintF/HCO2198 primer set (fig. 3). There were notable differences in the abundance of reads produced for each species. LepF1/MLepF1-Rev produced double the number of expected lepidopteran (17 input species) reads (16% of reads) compared with mlCOlintF/HCO2198 (8% of reads) and significantly fewer expected hymenoteran (16 input species) reads (0.1% of reads compared with 0.8%). LepF1/MLepF1-Rev produced a large number of expected hemipteran (4 input species) reads (6% of reads) compared with mlCOlintF/HCO2198 (0.02% of reads) whereas the primers produced comparable number of expected dipteran (19 input species) reads (9% of reads) and expected coleopteran (14 input species) reads (1% of reads).
Table 3. Comparison of quality control and filtering pipelines applied to Illumina MiSeq metabarcodes.

Quality control and filtering pipelines
After the simple metagenomics quality control and filtering pipeline, 171 OTU were retained for the LepF1/MLepF1-Rev primer set, 44 of which corresponded to the 80 input species (i.e., matched Sanger sequences so were ‘expected’ whereas the remaining 127 OTU did not match Sanger sequences so were ‘unexpected’) and 201 OTU were retained for the mlCOlintF/HCO2198 primer set, 64 of which corresponded to the 80 input species (table 3). After applying the manual quality control and filtering pipeline, 122 OTU were retained for the LepF1/MLepF1-Rev primer set, 67 of which corresponded to the 80 input species and 105 OTU were retained for the mlCOlintF/HCO2198 primer set, 62 of which corresponded to the 80 input species (table 3). The unexpected OTU included contaminants such as Wolbachia and bats for the LepF1/MLepF1-Rev primer set and fungi and mammals for the mlCOlintF/HCO2198 primer set, based on BLAST hits in GenBank (online Supplemental Figure).
Discussion
To move from demonstration technology to a practical, widely employed, biodiversity monitoring tool, Malaise trap metabarcoding, must be (i) easy to understand, (ii) easy to use, (iii) fast and cheap. Our metabarcoding approach using a single primer set targeting a short mini/metabarcode is very similar in essence to conventional DNA barcoding, which has already gained considerable acceptance among conservation practitioners and the general public (e.g., Bucklin et al., Reference Bucklin, Steinke and Blanco-Bercial2011; Fišer Pečnikar & Buzan, Reference Fišer-Pečnikar and Buzan2014; Kress et al., Reference Kress, García-Robledo, Uriarte and Erickson2015). Our DNA extraction from fresh caught (Malaise trap) specimens and PCR with a single primer set (such as conducted in this study) can be completed in a basic molecular lab in a few hours, while an Illumina MiSeq v2 run takes ~39 h. HTS can be outsourced to commercial companies at reasonable (and dropping) cost (US$2.5 per Mb in Malaysia). Therefore, to obtain 100 Mb for a 1-week Malaise trap sample (~100–300 specimens) can cost around US$250, theoretically US$1–2.5 per specimen or less (DNA extraction and PCR would add approximately US$1 per specimen).
The commercial companies will also provide bioinformatics analysis of the submitted samples up to BLAST hit, however the company may not be familiar with the specific protocols or purpose of the study, so we would always recommend the end-user retains control of the quality control and filtering pipeline. In our view, it is unrealistic to expect the users of applied metabarcoding (e.g., conservation officers in government agencies or NGOs) to master a series of command line programs to analyze their metabarcodes. A specific step-by-step web interface (such as those available for phylogenetic analyses; Dereeper et al., Reference Dereeper, Guignon, Blanc, Audic and Buffet2008) would be a significant step in the development of metabarcoding as a practical tool. Alternatively, easy-to-use GUI DNA sequence editing software, such as the widely used CodonCode Aligner, can be used to filter moderately sized metabarcode samples (e.g., weekly Malaise trap collections) and produces similar or better outputs to the ‘conventional’ pipelines adopted from bacterial metagenomics – 1.4 compared with 0.5 expected(Sanger matching):unexpected (without Sanger matches). Consequently, quality control and filtering of metabarcode datasets has the potential to be straightforward with considerable room for user input as opposed to the ‘blackbox’ of more complex pipelines (especially those requiring advanced sequence assembly e.g., Liu et al., Reference Liu, Li, Lu, Su, Tang, Zhang, Zhou, Zhou, Yang, Ji, Yu and Zhou2013). Several examples from traditional DNA barcoding studies illustrate the need for careful understanding and review of sequence data by the user (e.g., Wilson & Sing, Reference Wilson and Sing2013).
Despite the significant progress made in metabarcoding in recent years, several issues remain. Particularly important issues concern what is considered an acceptable detection rate (influenced both by sequencing depth and difficult to amplify taxonomic groups i.e., PCR bias) and species identification (incorporating species resolution, heteroplasmy and contamination). Further issues relating to species delimitation methods and the completeness of DNA barcode reference libraries for the identification of OTU are also critical (e.g., Wilson et al., Reference Wilson, Rougerie, Schonfeld, Janzen, Hallwachs, Hajibabaei, Kitching, Haxaire and Hebert2011).
The detection rate for 80 input species, which is slightly less than that found in a weekly Malaise trap sample in Malaysia (~100–300 species; Ji et al., Reference Ji, Ashton, Pedley, Edwards, Tang, Nakamura, Kitching, Dolman, Woodcock, Edwards, Larsen, Hsu, Benedick, Hamer, Wilcove, Bruce, Wang, Levi, Lott, Emerson and Yu2013), was 80 and 60% at 167 and 35 Mb of sequencing output, respectively, for the LepF1/MLepF1-Rev and 90 and 64% at 136 and 53 Mb of sequencing output, respectively, for the mlCOIintF/HCO2198 primer set. This is less than detection at >97% in the PCR-free Illumina pipeline of Zhou et al. (Reference Zhou, Li, Liu, Yang, Su, Zhou, Tang, Fu, Li and Huang2013) and Tang et al. (Reference Tang, Tan, Meng, Yang, Su, Liu, Song, Li, Wu, Zhang and Zhou2014). However, the detection rate is comparable with that reported for bulk amplification with Folmer primers – 81% in the ‘biodiversity soup’ pipeline (Folmer primers and 454 sequencing) of Yu et al. (Reference Yu, Ji, Emerson, Wang, Ye, Yang and Ding2012) and 84.9% using Illumina shotgun sequencing of the ‘biodiversity soup’ amplicons (Liu et al., Reference Liu, Li, Lu, Su, Tang, Zhang, Zhou, Zhou, Yang, Ji, Yu and Zhou2013). Considering the size of the sequencing output: >1.1 Gb for Liu et al. (Reference Liu, Li, Lu, Su, Tang, Zhang, Zhou, Zhou, Yang, Ji, Yu and Zhou2013), and 13.2–31.7 Gb for PCR-free pipelines (Zhou et al., Reference Zhou, Li, Liu, Yang, Su, Zhou, Tang, Fu, Li and Huang2013; Tang et al., Reference Tang, Tan, Meng, Yang, Su, Liu, Song, Li, Wu, Zhang and Zhou2014), this is an unfair comparison and represents the trade-off between cost and detection.
Previous studies have reported a low detection rate for species of Hymenoptera (Yu et al., Reference Yu, Ji, Emerson, Wang, Ye, Yang and Ding2012; Zhou et al., Reference Zhou, Li, Liu, Yang, Su, Zhou, Tang, Fu, Li and Huang2013) and this was also seen in bulk PCR and Illumina sequencing in the current study (25% of hymenopteran species were detected during the first sequencing run). Interestingly, the amplification success rate for hymenopterans using single-specimen PCR was 100% for the best primer sets, LepF1/MLepF1-Rev and mlCOIintF/HCO2198, showing that these primers can amplify hymentopteran COI but that there may be a bias during bulk PCR. It has been suggested that species with lower affinities with primer binding sites will yield lower level amplicons and fewer, if any, reads (Hajibabaei et al., Reference Hajibabaei, Shokralla, Zhou, Singer and Baird2011); but primer affinity is hard to predict (see Lee et al., Reference Lee, Sing and Wilson2015). To alleviate or at least minimize taxonomic bias in primer sets, lower PCR annealing temperatures (Ishii & Fukui, Reference Ishii and Fukui2001; Sipos et al., Reference Sipos, Székely, Palatinszky, Révész, Márialigeti and Nikolausz2007) and deeper sequencing (Hajibabaei et al., Reference Hajibabaei, Shokralla, Zhou, Singer and Baird2011) can be performed (88% of hymenopteran species were detected during the second deeper sequencing run), but may involve a trade-off in terms of non-specific binding and increased cost. Although a high number of hymenopteran species were detected by BLAST hit of the raw dereplicated reads, a large proportion of these reads were filtered out by the quality control pipelines, suggesting that although they were generated during sequencing, the hymenopteran reads were low abundance, low quality or characteristic of ‘error’ sequences. Hymenopteran reference sequences containing the poly-T region that is difficult to sequence cleanly and accurately (Zhou et al., Reference Zhou, Li, Liu, Yang, Su, Zhou, Tang, Fu, Li and Huang2013) may be beneficial in guiding quality control and filtering pipelines and help avoid discard of genuine hymenopteran OTU. The bias towards amplification of lepidopteran and dipteran sequences (as reported by Clarke et al., Reference Clarke, Soubrier, Weyrich and Cooper2014) was seen in this study although appeared less severe for the primer set mlCOIintF/HCO2198. Deagle et al. (Reference Deagle, Jarman, Coissac, Pompanon and Taberlet2014) argued that because COI has poorly conserved regions for primer design, the list of potential markers for metabarcoding has to be broadened. This is a controversial position as the opportunities for species identification based on the large, curated DNA barcode (COI) libraries (Ratnasingham & Hebert, Reference Ratnasingham and Hebert2007) would be forfeit (Yu et al., Reference Yu, Ji, Emerson, Wang, Ye, Yang and Ding2012). Quality control and filtering techniques (especially for chimeric sequences) often rely on properties of protein-coding sequences (Yu et al., Reference Yu, Ji, Emerson, Wang, Ye, Yang and Ding2012; Leray & Knowlton, Reference Leray and Knowlton2015) and the advantages of mitochondrial protein-coding genes for species identification are well-established. Our study supports the previous work that has shown that reasonable detection rates and taxonomic coverage can be achieved with COI metabarcodes.
Although the majority of Sanger and OTU matches were within 2% p-distance, some Sanger sequences fell into clusters with closely grouping OTU on the NJ trees. There are a number of potential explanations for these sequence clusters including chimera formation, PCR or Illumina sequencing errors (Haas et al., Reference Haas, Gevers, Earl, Feldgarden, Ward, Giannoukos, Ciulla, Tabbaa, Highlander, Sodergren, Methé, DeSantis, Petrosino, Knight and Birren2011; Quail et al., Reference Quail, Smith, Coupland, Otto, Harris, Connor, Bertoni, Swerdlow and Gu2012) and mitochondrial heteroplasmy (Shokralla et al., Reference Shokralla, Gibson, Nikbakht, Janzen, Hallwachs and Hajibabaei2014). Haas et al. (Reference Haas, Gevers, Earl, Feldgarden, Ward, Giannoukos, Ciulla, Tabbaa, Highlander, Sodergren, Methé, DeSantis, Petrosino, Knight and Birren2011) reported that the number of PCR amplification cycles has a dominant effect on chimera formation. By increasing the PCR extension time, reducing the concentration of template DNA and the number of amplification cycles to the fewest number (approximately 20 cycles) still able to yield sufficient amplicons for sequencing, chimera formation can be alleviated or at least be minimized (Lahr & Katz, Reference Lahr and Katz2009; Haas et al., Reference Haas, Gevers, Earl, Feldgarden, Ward, Giannoukos, Ciulla, Tabbaa, Highlander, Sodergren, Methé, DeSantis, Petrosino, Knight and Birren2011; Stevens et al., Reference Stevens, Jackson and Olson2013). Rapid changes in temperature might produce incomplete products which subsequently anneal to other DNA templates, creating chimeras, thus slowing the PCR ramp speed to 1°C s−1 has been recommended as another modification to inhibit chimera formation (Stevens et al., Reference Stevens, Jackson and Olson2013). Several potential chimeric sequences were observed and removed during our manual filtering steps, for example, when a group of reads showed close matches across a significant portion of the read and major divergences across another portion, or the presence of large gaps and frameshifts. Common methods for chimera filtering rely on analyzing the distribution and abundance of closely matching reads (Boyer et al., Reference Boyer, Mercier, Bonin, Taberlet and Coissac2014) but we have found this approach will significantly reduce the detection rate when low abundance but ‘real’ (100% match to Sanger sequences) sequences are inadvertently filtered (also reported by Yu et al., Reference Yu, Ji, Emerson, Wang, Ye, Yang and Ding2012). Other common approaches for chimera removal rely on reference alignments (Edgar et al., Reference Edgar, Haas, Clemente, Quince and Knight2011), but this is problematic for datasets consisting of many novel sequences, such as tropical Malaise samples. Other chimera detection methods based on signatures of recombination within a dataset (Martin et al., Reference Martin, Lemey, Lott, Moulton, Posada and Lefeuvre2010) may be suitable additions to metabarcoding pipelines.
The observed divergences between Sanger sequences and OTU may partially be explained by heteroplasmy (coexistence of multiple mitochondrial haplotypes in an individual) (Magnacca & Brown, Reference Magnacca and Brown2010; Shokralla et al., Reference Shokralla, Gibson, Nikbakht, Janzen, Hallwachs and Hajibabaei2014). COI heteroplasmy has been documented in many insects species across several orders; Lepidoptera (12% of species examined; Shokralla et al., Reference Shokralla, Gibson, Nikbakht, Janzen, Hallwachs and Hajibabaei2014), Orthoptera (2–24% of individuals observed; Moulton et al., Reference Moulton, Song and Whiting2010), Hymenoptera (13% of Hawaiian Hylaeus; Magnacca & Brown, Reference Magnacca and Brown2010) and Diptera (17% of individuals of Drosophila melanogaster; Townsend & Rand, Reference Townsend and Rand2004). After our manual filtering pipeline we encountered putative heteroplasmic sequences in 58% of species, representing all the insect orders included, but especially among Diptera. Decreasing the OTU clustering threshold (e.g., to 95% as used by Yu et al., Reference Yu, Ji, Emerson, Wang, Ye, Yang and Ding2010) may mask the presence of heteroplasmic sequences, but could also merge ‘valid’ species showing low COI divergences. Another potential complication is nuclear-mitochondrial pseudogenes (numts). Numts have been highlighted as a potential source of ambiguity for DNA barcoding (Song et al., Reference Song, Buhay, Whiting and Crandall2008), however, numts are generally easily spotted among amplified COI sequences by patterns in the amino acid translation (numts are noncoding), and probable numts would be removed when sequences were aligned and translated into amino acids.
Previous metabarcoding studies have all reported high levels of unexpected OTU (sequences) (13–35%; Hajibabaei et al., Reference Hajibabaei, Shokralla, Zhou, Singer and Baird2011; Liu et al., Reference Liu, Li, Lu, Su, Tang, Zhang, Zhou, Zhou, Yang, Ji, Yu and Zhou2013). Our study was no exception with 22% (mlCOIintF/HCO2198) to 39% (LepF1/MLepF1-Rev) of OTU surviving the metagenomics pipeline being probable contaminants or error sequences. However, this was reduced to <10% using the manual pipeline. Contamination may be caused by environmental DNA in the field or laboratory, if mis-priming (hybridization of sequencing primers during sequencing of libraries) occurs, if residual tissues (gut contents including mammal tissue such as detected in our study, eggs, minute specimens, etc.) or endosymbiotic bacteria (e.g., Wolbachia) are present in pooled samples, or be carried over from previous sequencing runs using the same MID (Hajibabaei et al., Reference Hajibabaei, Shokralla, Zhou, Singer and Baird2011; Kircher et al., Reference Kircher, Heyn and Kelso2011; Liu et al., Reference Liu, Li, Lu, Su, Tang, Zhang, Zhou, Zhou, Yang, Ji, Yu and Zhou2013; Zhou et al., Reference Zhou, Li, Liu, Yang, Su, Zhou, Tang, Fu, Li and Huang2013; Nelson et al., Reference Nelson, Morrison, Benjamino, Grim and Graf2014; Shokralla et al., Reference Shokralla, Gibson, Nikbakht, Janzen, Hallwachs and Hajibabaei2014). In a real sample (when no corresponding Sanger sequences are available), it will be difficult to detect contamination and for particularly sensitive work, including that with legal ramifications and the detection of invasive species (Boykin et al., Reference Boykin, Armstrong, Kubatko and De Barro2012), Yu et al. (Reference Yu, Ji, Emerson, Wang, Ye, Yang and Ding2012) suggested that specialized protocols such as those followed in ancient DNA laboratories will be necessary. Another suggestion has been to split samples and conduct independent amplification and sequencing on both halves followed by statistical comparison with detected error reads (Lange, Reference Lange2015). This of course would massively increase cost. Options for the elimination and detection of contamination without the need (and expense) of using ancient DNA protocols or additional sequencing runs include not reusing MID tags, sequencing extraction blank controls, and including technical replicates on the same HTS run.
Conclusion
Metabarcoding is a young field. Despite the successes of early empirical studies, a number of commentaries, simulations and thought-experiments have been published highlighting perceived shortcomings (e.g., Coissac et al., Reference Coissac, Riaz and Puillandre2012; Cristescu, Reference Cristescu2014; Deagle et al., Reference Deagle, Jarman, Coissac, Pompanon and Taberlet2014; Piñol et al., Reference Piñol, Mir, Gomez-Polo and Agustí2014b ), in particular, many focus around marker choice. This is reminiscent of the wave of publications following Hebert et al. (Reference Hebert, Cywinska, Ball and deWaard2003) (e.g., Rubinoff et al., Reference Rubinoff, Cameron and Will2006) which decreased abruptly after the build-up of empirical data clearly demonstrated the technical plausibility and utility of COI as a standard marker to recognize species boundaries (e.g., Smith et al., Reference Smith, Poyarkov and Hebert2008a ). The single primer sets used here, both targeting the COI barcode region, showed an acceptable detection rate for arthropod biodiversity analysis but there were complications due to putative heteroplasmic sequences and contamination. Considering the higher detection rate, and lower components of unexpected sequences after filtering, the mlCOIintF/HCO2198 primer set seems to best target around which to develop future protocols. To date, most metabarcoding-type studies have focused only on the efficiency of pipelines (detection rate), but factors such as cost, time and ease-of-use of the bioinformatics pipeline, that are crucial for making the leapt from demonstration studies to a real-world application have not been realistically addressed. Our study suggests that DNA metabarcoding is slowly becoming as easy, fast and cheap as conventional DNA barcoding, and that Malaise trap metabarcoding may soon fulfill its potential, providing a thermometer for biodiversity.
Supplementary material
The supplementary material for this article can be found at http://www.journals.cambridge.org/BER
Acknowledgements
This study was supported by a High Impact Research Grant (Chancellery) from the University of Malaya to J. J. W. and P. E. L.; K. W. S. and P. S. L. are supported by postgraduate scholarships from the University of Malaya. Yee Yoke Pei (Ecology and Biodiversity Program, UM) and Narong Jaturas (Department of Parasitology, UM) assisted in sample collection and laboratory work. M. Sugumaran (coordinator of Rimba Ilmu Botanic Garden) provided permission to deploy the Malaise trap. H. M. G. is grateful to the Monash University Malaysia Tropical Medicine and Biology Platform for financial and infrastructure support.