


Introduction
The genus Stenoponia Jordan and Rothschild, Reference Jordan and Rothschild1911 is a mainly Palearctic genus with a total of 16 species, two of which occur in the Nearctic region (Lewis, Reference Lewis1993). All the species are found principally on Muridae (rats and mice, voles and gerbils) (Hopkins and Rothschild, Reference Hopkins and Rothschild1962). Stenoponia is the only genus within Stenoponiinae subfamily; however, the systematic position of this genus within flea systematic has remained controversial over the years. Thus, this genus was first placed within the family Hystrichopsyllidae (Hopkins and Rothschild, Reference Hopkins and Rothschild1962); however, Whiting et al. (Reference Whiting, Whiting, Hastriter and Dittmar2008) placed the subfamily Stenoponiinae within the family Ctenophthalmidae with Rhadinopsyllinae as sister group. Finally, Zurita et al. (Reference Zurita, Callejón, de Rojas, Gómez-López and Cutillas2015) used molecular data to assess the monophyly of Stenoponiinae and suggested that this subfamily should be separated from the Ctenophthalmidae at the family level (Stenoponiidae).
Within the genus Stenoponia, the most common subspecies in the Mediterranean area is Stenoponia tripectinata tripectinata (Tiraboschi, Reference Tiraboschi1902). This rodent flea is widely distributed throughout southwestern area of Europe and the North of Africa including Mediterranean islands and the Canary Islands. It mainly parasitizes Muridae and Arvicolidae hosts, of which Mus spretus, Mus musculus musculus, and Mus musculus domesticus are the most common (Beaucournu and Launay, Reference Beaucournu and Launay1990). From an epidemiological point of view, S. t. tripectinata is considered the main vector of plague in Asia Minor and European Russia (Lewis, Reference Lewis1993), furthermore, the proteobacterium Bartonella elizabethae has been detected in specimens of this flea subspecies collected from the Canary Islands and Portugal (De Sousa et al., Reference De Sousa, Edouard-Fournier, Santos-Silva, Amaro, Bacellar and Raoult2006; Zurita et al., Reference Zurita, Gutiérrez and Cutillas2016; Abreu-Yanes et al., Reference Abreu-Yanes, Martinj-Alonso, Martin-Carrillo, Livia, Marrero-Gagliardi, Valladares, Feliu and Foronda2018). In this sense, it is known that species belonging to the B. elizabethae complex, including Bartonella tribocorum and B. elizabethae have zoonotic potential when transmitted to humans by a great variety of arthropod vectors, such as fleas, lice, and ticks. Bartonella infections in humans can cause different clinical manifestations, such as fatigue, muscle pain, or fever and may develop into serious complications, like neurological signs or endocarditis (Billeter et al., Reference Billeter, Levy, Chomel and Breitschwerdt2008).
Hitherto, only one molecular phylogenetic study of the genus Stenoponia has been published (Zurita et al., Reference Zurita, Callejón, de Rojas, Gómez-López and Cutillas2015). Using nuclear (ribosomal internal transcribed spacers 1 and 2 (ITS1, ITS2) and a fragment of 18S rRNA) and mitochondrial gene fragments (cytochrome c-oxidase 1 (cox1)), these authors found no nucleotide variation within and among S. t. tripectinata populations from different islands in the Canary Archipelago.
Yet, Zurita et al. (Reference Zurita, Callejón, de Rojas, Gómez-López and Cutillas2015) did observe that S. t. tripectinata from the Canary Islands and the Iberian Peninsula belong to two different lineages separated by specific restriction endonucleases.
Islands are biologically interesting study systems because: (i) the lower biological complexity of island communities when compared to equivalent mainland ones, (ii) their clearly defined spatial limits and (iii) the availability of a large range of whatever properties are studied (area, latitude, altitude, isolation, etc.) (Pérez-Mellado and Ramon, Reference Pérez-Mellado and Ramon2010). These features together with the diverse origin of islands, their geographical settings and locations, their dynamic history and, especially, their persistent isolation through time, have made them outstanding evolutionary tools for research community (Mayr, Reference Mayr1967; Pérez-Mellado and Ramon, Reference Pérez-Mellado and Ramon2010). Lastly, archipelagos such as the Canary Islands, have been referred to as speciation machines in the sense that new endemic species, generated from few colonization events, are continuously produced in them resulting in high rates of speciation (Rosenzweig, Reference Rosenzweig1995).
The aim of this study was to carry out a comparative morphometric, phylogenetic, and molecular study of two populations of S. t. tripectinata isolated from rodents collected from different islands from the Canary Archipelago and from Corsica to clarify the taxonomic status of these two isolated populations and to assess the morphological and molecular differentiation between them. Furthermore, a possible existence of cryptic subspecies between both populations was evaluated in this work. For this purpose, we have analyzed several morphological traits and sequenced the nuclear elongation factor 1 alpha (EF1-α), ITS2 ribosomal DNA (rDNA), and the cytochrome c oxidase subunit 1 (cox1), cytochrome c oxidase subunit 2 (cox2), and cytochrome b (cytb) mtDNA partial genes of several specimens of both populations.
Material and methods
Collection of samples
A total of 89 fleas were collected from rodents (M. musculus musculus) trapped from different islands (Gran Canaria, La Palma, El Hierro, La Gomera, and Tenerife) of the Canary Archipelago (Spain) (28°32′10″N 15°44′56″O), and a total of 41 fleas were collected from rodents (Rattus sp., Apodemus sp., and Mus sp.) trapped from Corsica (France) (42°09′00″N 9°05′00″E). All rodent specimens were captured using live traps. Afterward, each rodent was exhaustively examined for fleas by combing through an inspection of head, neck, body, sides, tail, and ventral regions of each animal. Fleas were collected manually and kept in Eppendorf tubes with 96% ethanol for subsequent identification and DNA extraction.
Morphological identification and biometrical study
For morphological analysis, all whole specimens were examined and photographed under an optical microscope to carry out a first specific classification. Subsequently, 16 flea specimens from different islands of the Canary Archipelago and nine flea specimens from Corsica were put away for DNA analysis. On the other hand, 20 specimens (ten males and ten females) from El Hierro (Canary Islands) and 18 specimens (nine males and nine females) from Corsica were cleared with 10% KOH, prepared, and mounted on glass slides using conventional procedures with EUKITT mounting medium (O. Kindler GmbH & Co., Freiburg, Germany) (Lewis, Reference Lewis1993). No specimens from other islands from the Canary Archipelago were selected for morphometric analysis due to the lack of samples. Once mounted, they were examined and photographed again for a deeper morphological analysis using a CX21 microscope (Olympus, Tokyo, Japan). Diagnostic morphological characters were studied by comparison with figures, keys, and descriptions in Hopkins and Rothschild (Reference Hopkins and Rothschild1962) and Beaucournu and Launay (Reference Beaucournu and Launay1990). After morphological identification, the cleared and mounted specimens were measured using a Zeiss microscope 47 30 11 9901 (Zeiss, Germany) according to ten different parameters for males and 12 different parameters for females (tables 1 and 2). Descriptive univariate statistics (arithmetic mean, standard deviation, and coefficient of variation) for all parameters were determined using Microsoft Excel 5.0. Furthermore, to assess phenotypic differentiation among the samples, morphometric data were explored using multivariate analysis in five measurements (TL, TW, HW, DISTL, and DISTW) in males (see table 1) and eight measurements (TL, TW, HL, HW, BULGAL, BULGAW, APEHILW, and DBMV) in females (see table 2) by Principal Component Analysis (PCA) (Dujardin and Le Pont, Reference Dujardin and Le Pont2004). Phenotypic analyses were conducted using BAC v.2 software (Dujardin, Reference Dujardin2002; Valero et al., Reference Valero, Perez-Crespo, Periago, Khoubbane and Mas-Coma2009; García-Sánchez et al., Reference García-Sánchez, Rivero, Callejón, Zurita, Reguera-Gomez, Valero and Cutillas2019).
Table 1. Biometrical data of males of S. t. tripectinata analyzed in this study

TL, total length; TW, total width; HL, total length of the head; HW, total width of the head; PROTW, total width of the prothorax; MESOW, total width of the mesothorax; METW, total width of the metathorax; DISTL, total length of the distal branch of the IX sternum; DISTW, total width of the distal branch of the IX sternum; PROXL, total length of the proximal branch of the IX sternum; MAX, maximum; MIN, minimum; SD, standard deviation; Mean, arithmetic mean; VC, coefficient of variation (percentage converted).
*Significant differences between both populations of males (P < 0.005).
Table 2. Biometrical data of females of S. t. tripectinata analyzed in this study

TL, total length; TW, total width; HL, total length of the head; HW, total width of the head; PROTW, total width of the prothorax; MESOW; total width of the mesothorax; METW, total width of the metathorax; BULGAL, total length of the bulga; BULGAW, total width of the bulga; APEHILL, total length of the apex of the hilla; APEHILLW, total width of the apex of the hilla; DBMV, distance from bulga to ventral margin of the body; MAX, maximum; MIN, minimum; SD, standard deviation; Mean, arithmetic mean; VC, coefficient of variation (percentage converted).
*Significant differences between both populations of females (P < 0.005).
Molecular and phylogenetic study
The DNA markers sequenced in the present study (EF1-α, ITS2 rDNA, cox1, cox2, and cytb) were amplified by a polymerase chain reaction (PCR) using a thermal cycler (Eppendorf AG; Eppendorf, Hamburg, Germany). PCR mix, PCR conditions, and PCR primers are summarized in the Supporting information (table S1).
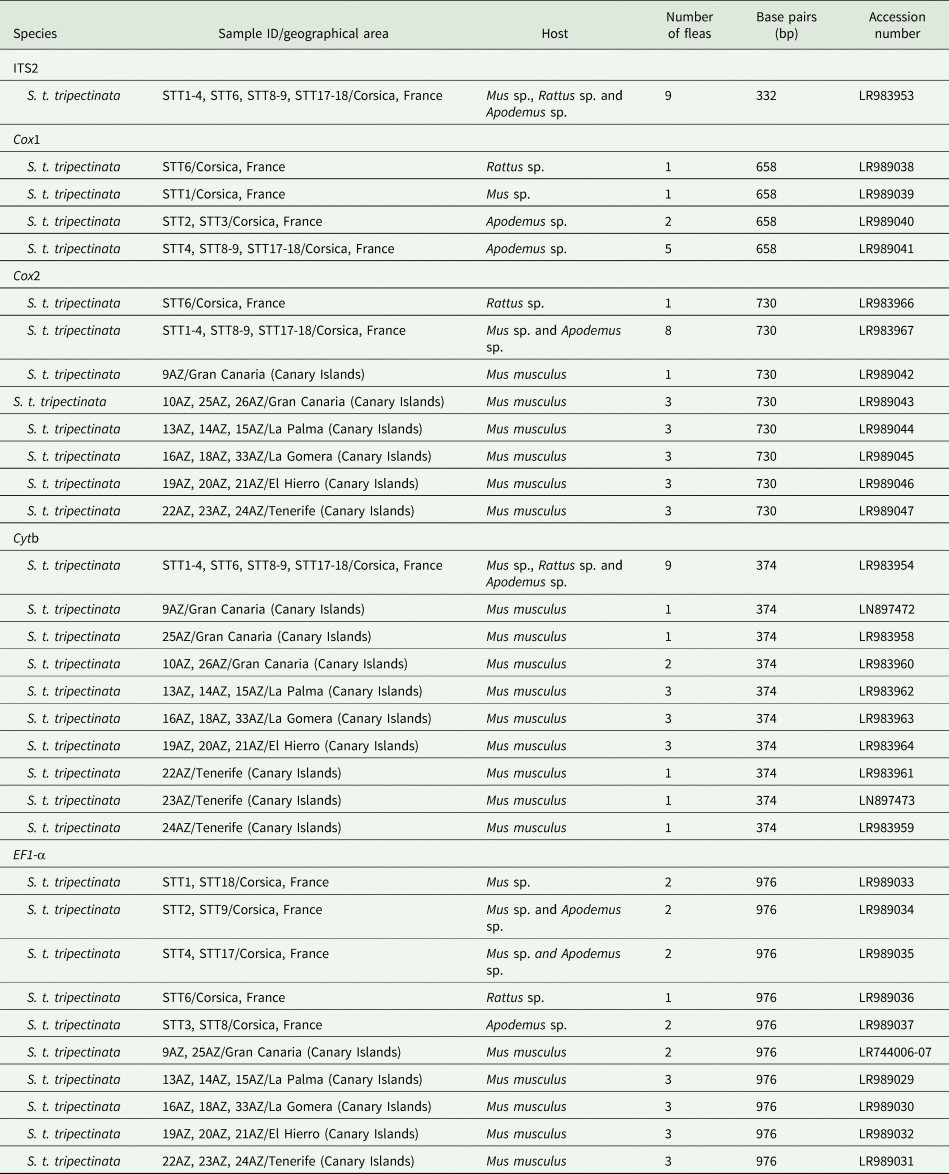
The EF1-α, ITS2, cox1, cox2, and cytb sequences were deposited in GenBank (table 3).
Table 3. GenBank accession numbers of ITS2, EF1-α, and partial cytb, cox1, and cox2 gene sequences of individuals of S. t. tripectinata obtained in this study

The PCR products were checked on SYBR Safe stained 2% Tris–borate–ethylenediaminetetraacetic acid agarose gels. PCR products were purified using the QWizard SV Gel and PCR Clean-Up System Kit (Promega, Madison, WI, USA). Once purified, these products were sent to the commercial company Stab Vida (Lisbon, Portugal) for sequencing process. We separately sent purified PCR products and 20 μl of 100 μM of each pair of primers (see table S2) for each molecular marker. Sanger sequencing was carried out using an automatic LI-COR® DNA sequencer. Sequences were aligned with the MUSCLE alignment method (Edgar, Reference Edgar2004) in MEGA, version 5.2 (Tamura et al., Reference Tamura, Peterson, Peterson, Stecher, Nei and Kumar2011). Alignment settings comprised a gap open = −400.00, a gap extend = 0.0, an UPGMA (Unweighted Pair Group Method with Arithmetic Mean) as a cluster method, and a minimum diagonal length = 24. Sequence similarity was expressed as percentage of sequence divergence using uncorrected p-distances method as implemented in MEGA, version 5.2 (Tamura et al., Reference Tamura, Peterson, Peterson, Stecher, Nei and Kumar2011). Coding genes sequences were searched for nuclear mitochondrial pseudogenes (Numts) by BLASTN (Altschul et al., Reference Altschul, Gish, Miller, Myers and Lipman1990). Threshold levels for the inference of Numts from BLASTN hits were taken as expectation values (E values) of 10−4 or 10−14.
Phylogenetic trees were inferred by: Maximum Likelihood (ML) and Bayesian Inferences (BI). ML trees were generated using the PHYML package from Guindon and Gascuel (Reference Guindon and Gascuel2003), whereas BI were generated using MRBAYES, version 3.2.6 (Ronquist and Huelsenbeck, Reference Ronquist and Huelsenbeck2003). JMODELTEST (Posada, Reference Posada2008) was used to determinate the best-fit substitution model for EF1-α, cox1, cox2, and cytb. Models of evolution were chosen for subsequent analyses according to the Akaike information criterion (Huelsenbeck and Rannala, Reference Huelsenbeck and Rannala1997; Posada and Buckley, Reference Posada and Buckley2004). The concatenated alignment of EF1-α, cox1, cox2, and cytb was analyzed by BI after partitioning and model selection with JMODELTEST. For ML inference, best-fit nucleotide substitution models included TIM2 + I + G (cox2), TIM1 + I + G (cox1), and GTR + I + G (EF1-α and cytb). Support for the topology was examined using bootstrapping (heuristic option) (Felsenstein, Reference Felsenstein1985) over 1000 replications. The commands used in MRBAYES, version 3.2.6 for BI were nst = 6 with invgamma rates (EF1-α, cox1, cox2, and cytb). For BI, the standard deviation of split frequencies was used to determine whether the number of generations completed was enough; the chain was sampled every 500 generations and each dataset was run for 10 million generations. Adequacy of sampling and run convergence were assessed using the effective sample size diagnostic in tracer, version 1.6 (Rambaut and Drummond, Reference Rambaut and Drummond2007). Trees from the first million generations were discarded based on an assessment of convergence. Burn-in was determined empirically by examination of the log likelihood values of the chains. Bayesian Posterior Probabilities (BPP) were used to assess the reliability of nodes.
The phylogenetic analyses, of single gene fragments EF1-α, cox1, cox2, and cytb were carried out using our sequences and those obtained from GenBank (table S2). Phylogenetic trees were rooted using Panorpa meridionalis (Mecoptera: Panorpidae) as outgroup. This choice was based on the combination of morphological and molecular data obtained in previous studies, which provided compelling evidence for a sister group relationship between Mecoptera and Siphonaptera (Whiting, Reference Whiting2002; Whiting et al., Reference Whiting, Whiting, Hastriter and Dittmar2008).
ITS2 sequences were exclusively used to characterize S. t. tripectinata population isolated from Corsica and in comparison with those from the Canary Islands (Zurita et al., Reference Zurita, Callejón, de Rojas, Gómez-López and Cutillas2015).
Results
Morphological and biometrical results
All the specimens studied in this work showed morphological characteristics expected for the subspecies S. t. tripectinata:
• Eyes vestigial and non-pigmented (fig. 1a).
• Distance between oral angle and first spine of genal comb far more (2/3) than half the length of the genal comb (fig. 1a).
• Genal comb with numerous spines out of which none (sometimes one) of the posterior ones appear out of alignment with the rest (fig. 1b).
• Presence of one pronotal comb and one fully developed abdominal comb (composed by spines which are as long as those of the pronotal comb) (fig. 1c).
• Telomere or movable process of males long and rather straight, rarely somewhat curved (fig. 1d).
• Males showing a dilated apical portion of distal arm of sternum IX with the dorsal and ventral margins subparallel. Dorsal margin usually much more convex than the ventral one (fig. 1e).
• Crochet of males’ phallosome variable but usually with a long ventral projection and a short dorsal one (fig. 1f).
• Ventral margin of sternum VII of females with an apical lobe of variable size, which subtended a little sinus of variable size (fig. 1g).
• Spermatheca of females subspherical bulga that projects into the cribriform area without thickened rim around the base of the hilla. The hilla is latter variable in size and shape than bulga but usually much longer than it. Bulga with a posterior little protuberance (fig. 1g).

Figure 1. Morphological characteristics of S. t. tripectinata specimens assessed in this study. (a) Head and frons with oral angle arrowed; (b) genal comb; (c) pronotal and abdominal (arrowed) combs; (d) telomere or movable process of males; (e) apical portion of distal arm of sternum IX of males; (f) crochet of males phallosome with a long ventral projection arrowed; (g) spermatheca and ventral margin of sternum VII of females showing an apical lobe which subtended a little sinus (arrowed).
Based on the morphological features described above, we could not separate both flea populations (Canary Islands and Corsica).
In the PCA, male variables were significantly correlated with PC1, contributing 58% to the overall variation. In the factor map, the two male populations strongly overlapped and as such there was no overall size difference between the males from the El Hierro (Canary Islands) and those from Corsica (fig. 2)

Figure 2. Factor map corresponding to adult of S. t. tripectinata males from Corsica and El Hierro (Canary Islands). Samples are projected onto the first (PC1, 58%) and second (PC2, 17%) principal components. Each group is represented by its perimeter.
Female variables were significantly correlated with PC1, contributing 66% to the overall variation. In this case, the factor map revealed that the female populations of the El Hierro (Canary Islands) and Corsica show only very limited overlap and hence are well-separated, such that females in Corsica are larger than in the El Hierro island (fig. 3).
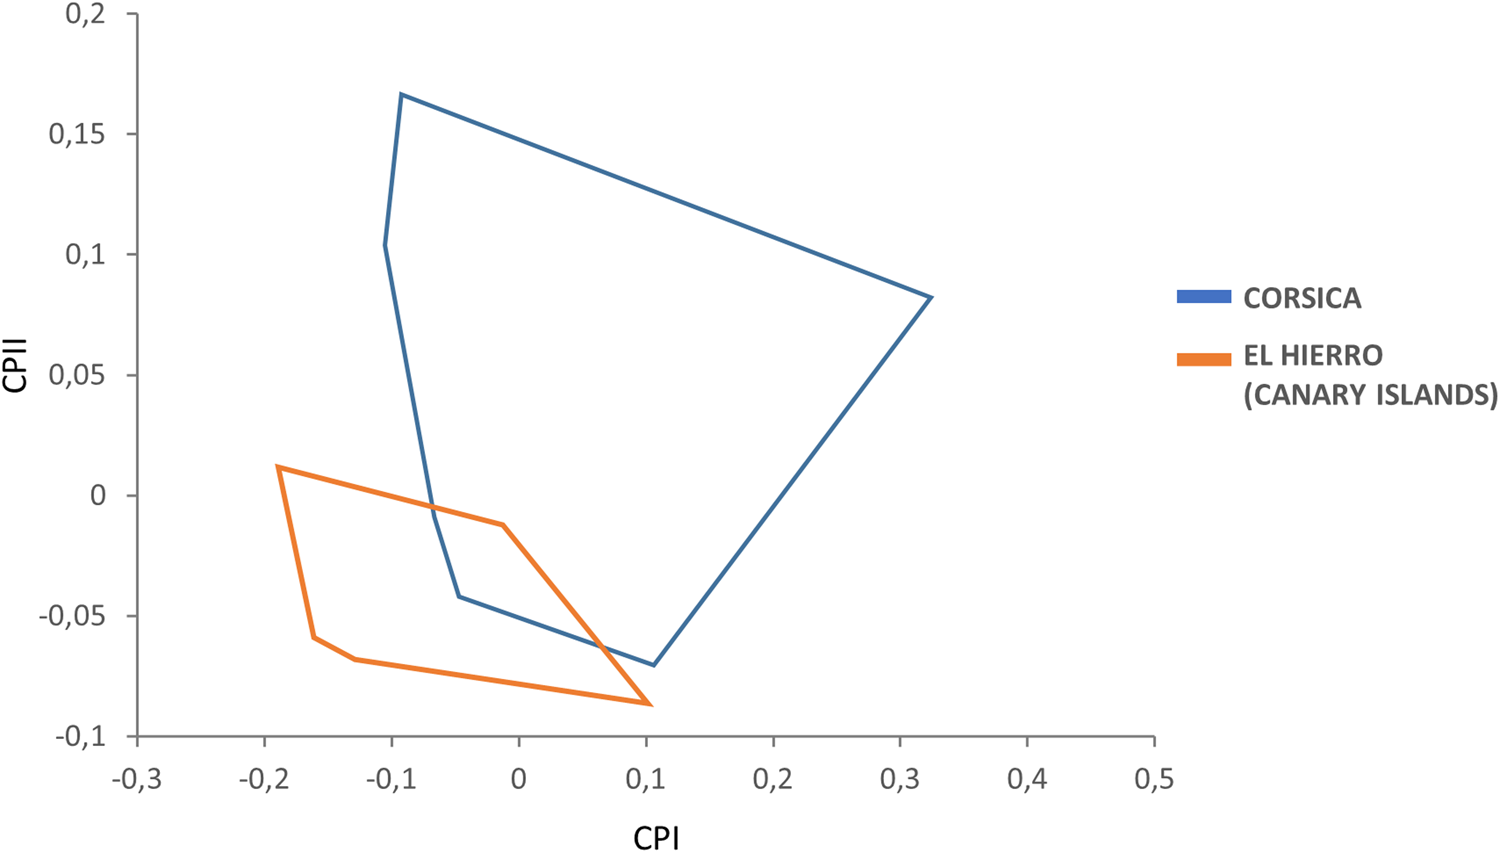
Figure 3. Factor map corresponding to adult S. t. tripectinata females from Corsica and El Hierro (Canary Islands). Samples are projected onto the first (PC1, 66%) and second (PC2, 20%) principal components. Each group is represented by its perimeter.
DNA sequences results
ITS2 and EF1-α
The length of ITS2 was 332 bp and of EF1-α 976 bp (table 3). All ITS2 sequences were identical, whereas the EF1-α sequence divergence ranged from 0.6 to 1.4% between both populations. Within the Canary Islands all EF1-α sequences were identical; yet, in Corsica there were five haplotypes showing 0.2–1.5% of sequence divergence. In contrast, EF1-α sequence divergence between S. t. tripectinata and Stenoponia tripectinata medialis was slightly higher while the EF1-α sequence divergence between S. t. tripectinata and congeneric species, such as Stenoponia americana and Stenoponia sidimi, always exceeded 7.0% (table 4). Lastly, we did not find any Numts in any EF1-α sequence.
Table 4. Intrapopulation*, interpopulation, and interspecific sequence divergences observed among all the partial EF1-α gene sequences of nuclear DNA of different species belonging to Stenoponia sp. obtained in this work and retrieved from GenBank database
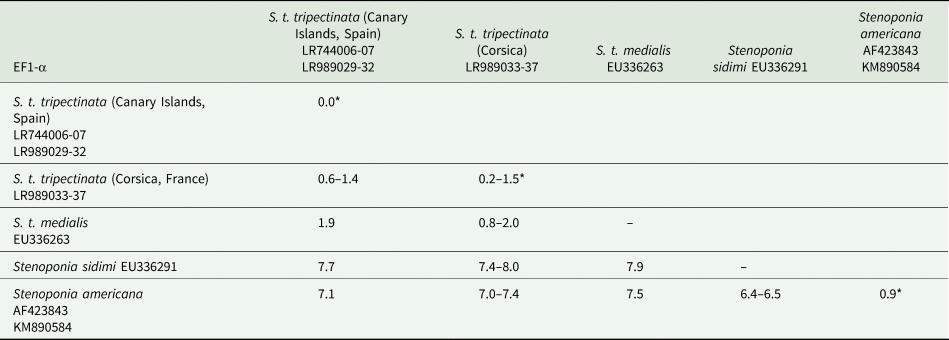
Values are given in percentages.
Partial cox1, cox2, and cytb analysis
The lengths of cox1, cox2, and cytb were 658, 730, and 374 bp, respectively (table 3). Intrapopulation sequence divergence was always about 0%, whereas interpopulation sequence divergences were 1–2% (tables 5–7). The largest sequence divergences between Corsica and the Canary Islands were observed in cox1 and cytb (tables 5 and 7). Furthermore, the cox1 sequence divergence between S. t. tripectinata from Andalusia (Iberian Peninsula) and Corsica was larger than that between the Canary Islands and Corsica. With respect to S. t. medialis, based on cytb sequences, this taxon showed less sequence divergences with population of S. t. tripectinata from Corsica than with specimens from the Canary Islands, on the contrary, based on cox2 analysis, it was observed less sequence divergences between S. t. medialis and S. t. tripectinata isolated from the Canary Islands (tables 6 and 7). Based on mitochondrial markers, sequence divergences among S. t. tripectinata and other congeneric species (Stenoponia polyspina, S. americana, and S. sidimi) showed quite higher values (always exceeding 10%) than among S. tripectinata subspecies (tables 5–7). Finally, we did not find any Numts in any mitochondrial marker assessed.
Table 5. Intrapopulation*, interpopulation, and interspecific sequence divergences observed among all the partial cox1 mtDNA gene sequences of different species belonging to Stenoponia sp. obtained in this work and retrieved from GenBank database
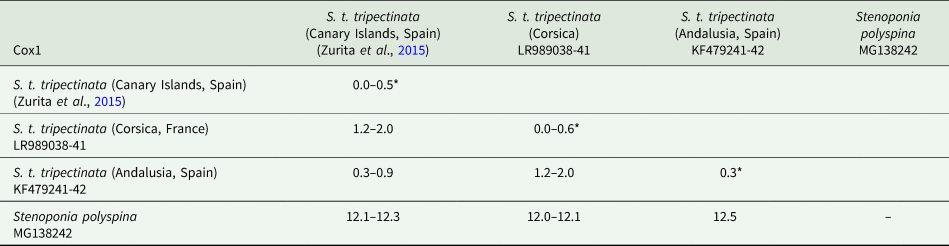
Values are given in percentages.
Table 6. Intrapopulation*, interpopulation, and interspecific sequence divergences observed among all the partial cox2 mtDNA gene sequences of different species belonging to Stenoponia sp. obtained in this work and retreived from GenBank database

Values are given in percentages.
Table 7. Intrapopulation*, interpopulation, and interspecific sequence divergences observed among all the partial cytb mtDNA gene sequences of different species belonging to Stenoponia sp. obtained in this work and retreived from GenBank database
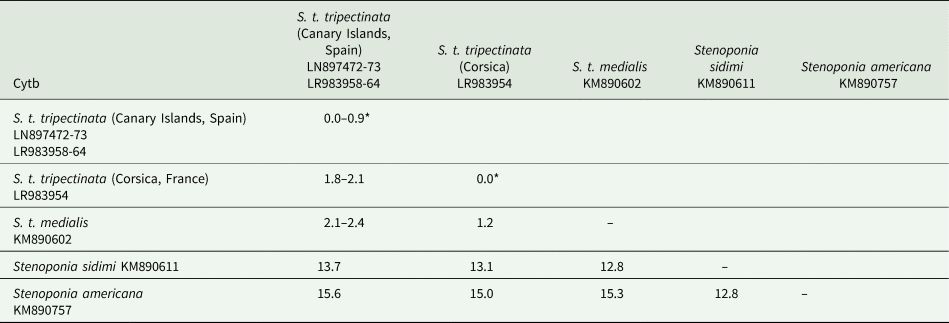
Values are given in percentages.
Phylogenetic analysis
Phylogenetic trees inferred from EF1-α, cox1, cox2, and cytb showed similar topologies (figs S1–S4, respectively). Thus, the genus Stenoponia and the family Stenoponiidae each appeared as well-supported clade. Specimens of S. t. tripectinata from the Canary Archipelago and Corsica formed two well-supported clades, yet within the Canary Archipelago clade, the specimens from the different islands constituted an unresolved polytomy. In the EF1-α phylogenetic tree, two specimens of S. t. tripectinata from Corsica formed a separate, but well-supported, clade with S. t. medialis within the Stenoponiidae (fig. S1).
The phylogenetic position of S. t. medialis was not clear in our study, as this taxon clustered within the Corsica clade (EF1-α and cytb), but was placed within the Canary Islands clade on the basis of cox2. Nevertheless, cox2 phylogenetic tree was unreliable since S. t. medialis and Canary Islands clade was only supported by ML with a bootstrap support of 70 (which is really low), while it is not at all supported by BI. Finally, the other Stenoponia species (S. sidimi, S. americana, and S. polyspina) always clustered within the Stenoponia clade (except S. sidimi in cytb analysis) but outside the S. t. tripectinata clade.
The concatenated dataset of EF1-α, cytb, cox1, and cox2 comprised 2658 aligned sites and 39 taxa, including S. t. tripectinata from Corsica and the Canary Islands and outgroups (P. meridionalis). Phylogenetic analysis of this dataset yielded a tree in which S. t. tripectinata formed a well-supported clade, as did the genus Stenoponia (fig. 4). Within S. t. tripectinata, Corsica and the Canary Archipelago constituted two well-supported clades, though the islands within the Canary Archipelago formed an unresolved polytomy (fig. 4). Furthermore, a third clade corresponding to two specimens from Corsica clustered separately as sister group of the Corsica and Canary Archipelago clades (fig. 4).

Figure 4. Phylogenetic tree of S. t. tripectinata specimens assessed in this study (see table 3). This analysis was based on concatenated sequences of elongation factor 1 alpha (EF1-α), partial cytochrome c-oxidase subunit 1 (cox1), cytochrome c-oxidase subunit 2 (cox2), and cytochrome b (cytb) gene of mitochondrial DNA inferred using the Bayesian Inference (BI) and Maximum Likelihood (ML) methods and Bayesian topology. The percentage of replicate trees in which the associated taxa clustered together in the bootstrap test (1000 replicates) is shown on the branches (BPP/Bootstrap). The Bayesian Posterior Probabilities (BPP) are percentage converted.
Discussion
Island systems have been key to analyze the process of population differentiation, as a result of being discrete, geographically isolated, and small in size relative to continents (Grant and Grant, Reference Grant and Grant2008). We carried out a comparative morphological, biometrical, molecular, and phylogenetic analysis of two islands populations of S. t. tripectinata. The presence of this subspecies in rodents from Corsica and the Canary Islands agrees with other authors who revealed the distribution of this taxon throughout the Mediterranean and the North of Africa area, including the Islands and archipelagos of this Palearctic region (Beaucournu and Launay, Reference Beaucournu and Launay1990; Sánchez and Gómez, Reference Sánchez and Gómez2012).
Jordan (Reference Jordan1958) and Hopkins and Rothschild (Reference Hopkins and Rothschild1962) claimed that the subspecies of S. tripectinata constituted an exceptionally difficult problem from a classical taxonomy point of view. They observed two morphological extremes based on dorsal portion of the frons (head) in one of which this part is relatively weakly convex and the genal comb is confined to the genal margin, while in the other, the frons is much more convex and the last three or four spines of the genal comb are out of alignment with the rest and situated on the anterior margin of the antennal fossa. These extremes are so distinct that they have long been considered specifically distinct and some taxonomists would perhaps refer them to different subgenera, additionally, these authors observed that both extremes are connected by a series of morphological intermediates (Hopkins and Rothschild, Reference Hopkins and Rothschild1962). Moreover, many populations of S. tripectinata analyzed by these authors differ one from another only by the ‘mean values’ of their diagnostic characteristics, so it becomes necessary either to consider such strikingly different geographical forms to be inseparable or to recognize as subspecies populations which differ from one another only on the average. Both Hopkins and Rothschild (Reference Hopkins and Rothschild1962) and Beaucournu and Launay (Reference Beaucournu and Launay1990) adopted the latter alternative considering eight different subspecies for S. tripectinata based on morphological traits; however, they claimed that the number of specimens available was very small and further material might show that certain accepted subspecies could not be maintained.
We did not find clear morphological differences between specimens from the Canary Archipelago and Corsica population; thus, the frons of the head appeared weakly convex and the genal comb was confined to the genal margin for all specimens assessed (fig. 1a, b). Yet, morphometric data showed slight differences between S. t. tripectinata specimens from Corsica and El Hierro (Canary Islands). This result was corroborated by PCA, with the Corsica adults showing a slightly bigger global size, especially in females (fig. 2). Although we cannot conclude that we have a diagnostic morphological pattern to separate specimens from both islands based on their global size, we would maybe consider the ‘island rule’ term coined by Van Valen (Reference Van Valen1973). It says that island populations show phenotypic changes (e.g. size shifts) in comparison to continental populations. Therefore, it would be interesting to carry out further morphometric studies including samples from the remaining islands of the Canary Archipelago or even continental populations in order to confirm the higher global size trend observed in Corsica specimens.
Our morphological results were not in concordance with the DNA sequence data and phylogenetic trees. In agreement with Zurita et al. (Reference Zurita, Callejón, de Rojas, Gómez-López and Cutillas2015) we found nearly no nucleotide differences among specimens from different islands from the Canary Archipelago, however these specimens were clearly differentiated from the Corsica clade. The absence of morphological discriminative features together with the sequence and phylogenetic variability observed between Corsica and the Canary Islands populations suggests that S. t. tripectinata may involve two cryptic subspecies.
In our study, specimens from Corsica generally showed a higher nucleotide diversity than in the Canary Islands, and this was particularly true for EF1-α with its five haplotypes in Corsica. Furthermore, based on cox1 phylogeny this lineage appeared more distant to Iberian Peninsula (mainland) population than the Canary Island lineage. The origin theory of Pulex irritans provided by Buckland and Sadler (Reference Buckland and Sadler1989) or the coalescent theory supported by Slatkin and Hudson (Reference Slatkin and Hudson1991) state that ancestral populations usually exhibit higher genetic diversity values compared with recent populations that have expanded into novel territories. Therefore, our results could mean an earlier colonization of S. t. tripectinata or even higher frequencies or on-going introduction events in Corsica than in the Canary Archipelago.
Based on the EF1-α and cytb sequence data S. t. medialis appeared phylogenetically closer to the Corsica population. Although this subspecies has only been collected from Israel so far (Hopkins and Rothschild, Reference Hopkins and Rothschild1962; Krasnov et al., Reference Krasnov, Burdelova, Shenbrot and Khokhlova2002, Reference Krasnov, Khokhlova and Shenbrot2003), the geographical origin of S. t. medialis sequences used in this work was not available in GenBank. Thus, basing on EF1-α and cytb results, it could mean that S. t. tripectinata would be a paraphyletic taxon by the inclusion of S. t. medialis. In order to confirm this hypothesis, we strongly encourage the necessity to carry out further taxonomic studies based on morphological and molecular data or even genome-wide SNP markers or whole genome sequencing approaches of S. t. medialis and the remaining S. tripectinata subspecies to clarify the taxonomical status of these taxa.
In conclusion, the present study provides comparative morphological, biometrical, and molecular data of two different isolated populations of the subspecies S. t. tripectinata (Corsica and Canary Archipelago). On the basis of our results, we observed slight differences in size between females from EL Hierro Island (Canary Archipelago) and Corsica and the existence of two well-defined geographical genetic lineages corresponding with the both population assessed. This fact could mean the existence of two cryptic subspecies within S. t. tripectinata. Since the lack of knowledge of mitochondrial and ribosomal genomics for this taxon is a major limitation for phylogenetic studies, we bring to light the necessity to provide new and updated morphological, molecular, and phylogenetic data in order to clarify the taxonomical status of S. tripectinata complex.
Supplementary material
The supplementary material for this article can be found at https://doi.org/10.1017/S0007485322000098
Acknowledgements
The authors thank Dr Carlos Feliu for providing samples from Corsica. We also thank Dr Philippe Parola (Institut Hospitalo-Universitaire Méditerranée Infection, Marseille) for lending support for the DNA extraction.
Financial support
The present work was supported by a grant of the VI Plan Propio de Investigación of the University of Seville, Spain.
Conflict of interest
None.


 Open access