


Inadequate nutrition is one of the main risk factors for human health worldwide and can cause protein-energy malnutrition and/or hidden malnutrition(1). Hidden malnutrition has been defined by the WHO and the UNICEF as a group of specific and highly prevalent micronutrient deficiencies that require certain instruments for diagnosis(1,Reference Varea, Disalvo and González2) .
Iron deficiency is the leading cause of anaemia, affecting approximately one-third of the population in developed and developing countries(Reference Lopez, Cacoub and Macdougall3). In Argentina, a high prevalence of anaemia and iron deficiency has been reported(Reference Varea, Disalvo and González2,Reference Apezteguia, Varea and Disalvo4–Reference Svarch Guerchicoff10) . The causes of iron deficiency anaemia (IDA) are multifactorial; in children from 0 to 5 years old, it depends on the balance of the interaction between iron and other nutrients as well as on iron bioavailability, losses and requirements for growth. Additionally, IDA is associated with decreased cognitive performance and delayed motor development(Reference Cappellini, Musallam and Taher11).
The Argentine Society of Pediatrics (SAP, for its Spanish acronym) recommends preventive daily ferrous sulphate (DI) supplementation for term infants fed with non-fortified cows’ milk, or breast-feeding and receiving complementary food with low iron content, from 2 months of age. Despite this recommendation, the prevalence of IDA is still very high in children under 2 years(Reference Linetzky, Morello and Virgolini12). On the other hand, weekly ferrous sulphate (WI) supplementation has proven to be an effective alternative for the prevention of IDA(Reference De-Regil, Jefferds and Sylvetsky13–16) since it would optimise iron absorption and have fewer adverse effects(Reference Eickmann, Brito and Lira17,Reference Fernández Gaxiola and De Regil18) . Nevertheless, evidence in infants is scarce(Reference de Camargo, Campos and Bustamante-Teixeira19,Reference Yurdakök, Temiz and Yalçin20) .
Iron is a crucial element for cellular and tissue functions(Reference Cappellini, Musallam and Taher11), while excess iron can induce a state of oxidative stress which is associated with protein, lipid and DNA damage. Such damage can be permanent(Reference Aksu, Hasbal and Himmetoglu21–Reference Prá, Franke and Henriques25) and is accepted as one of the main underlying mechanisms for the development of certain chronic diseases, iron toxicity and tissue injury(Reference Fraga and Oteiza26,Reference Toxqui, De Piero and Courtois27) .
Ferroptosis is a non-apoptotic regulated cell death dependent on reactive oxygen species (ROS) and iron and triggered by lipid peroxidation. ROS accumulation, which is toxic and damages the membrane structure, occurs when the endogenous antioxidant status of the cell is compromised(Reference Kajarabille and Latunde-Dada28). Membrane lipid peroxidation and subsequent ferroptosis can be prevented by administering vitamin E (α-tocopherol), the main non-enzymatic fat-soluble antioxidant(Reference Kajarabille and Latunde-Dada28–Reference Tang, Frank and Sherlock31).
In previous works carried out in vitro by our research group, WI supplementation for IDA prevention was more effective than DI to reduce oxidative stress and genomic damage(Reference Gambaro, Seoane and Padula32,Reference Gambaro, Seoane and Padula33) . The aim of this study was to evaluate the effect of DI and WI supplementation combined with two doses of vitamin E and analyse whether vitamin E was capable of preventing or reducing both the already documented cytotoxic and genotoxic effects and oxidative stress induced by ferrous sulphate.
Materials and methods
Whole blood culture
Blood was collected by venipuncture with a heparinised syringe. Blood samples were obtained from healthy female donors aged 20–40 years. A pool of blood from ten donors (5 ml each) was used, considering Rh factor and AB0 blood group. Cultures were performed in Falcon T-25 flasks (Nunc) (final volume, 10 ml) using a Ham´s F12 medium (Sigma-Aldrich) without fetal bovine serum and with antibiotics (60 mg penicillin and 50 μg/ml streptomycin) (Laboratorios Bagó). The stimulation of lymphocytes was achieved with a 100 µg/ml phytohemagglutinin (Gibco Thermo Fisher Scientific). The samples were cultured in 5 % CO2 at 37°C for 7 d(Reference Fenech34,Reference Fenech, Zappia, Panico and Russo35) .
Experimental design
The in vitro protocol was implemented using peripheral blood. It included the following groups: (1) negative (untreated) control (NC); (2) control with 8·3 µg/ml vitamin E (Merck KGaA) (C 8·3); (3) control with 16·6 µg/ml vitamin E (C 16·6); (4) weekly supplementation with 0·55 mg/ml ferrous sulphate (Ferdrómaco Pediátrico, Laboratorios Andrómaco) and 8·3 µg/ml vitamin E (WI 8·3); (5) weekly supplementation with 0·55 mg/ml ferrous sulphate and 16·6 µg/ml vitamin E (WI 16·6); (6) daily supplementation with 0·14 mg/ml ferrous sulphate and 8·3 µg/ml vitamin E (DI 8·3); (7) daily supplementation with 0·14 mg/ml iron and 16·6 µg/ml vitamin E (DI 16·6); and (8) positive control (PC) treated with hydrogen peroxide or 10 % ethanol, according to the technique used (Fig. 1).

Fig. 1. Experimental design diagram. Negative control (NC), 8·3 vitamin E control (C 8·3), 16·6 vitamin E control (C 16·6), weekly iron 8·3 (WI 8·3), weekly iron 16·6 (WI 16·6), daily iron 8·3 (DI 8·3), daily iron 16·6 (DI 16·6) and positive control (PC). *7-d supplementation; **1-d supplementation.
Detailed methodological aspects related to preventive DI and WI supplementation have been published elsewhere(Reference Gambaro, Seoane and Padula32). WI and DI control values for each assay are presented in Table 1. The ferrous sulphate was diluted in physiological solution to reach the desired concentration. To simulate DI supplementation, the SAP recommendations were followed(Reference Gambaro, Seoane and Padula32). The proposed WI supplementation (4 mg/kg per d) was determined by the concentration used in in vivo studies(Reference Berger, Polidori and Dabbagh36). In the DI supplementation protocol, the treatment was applied during the 7 d of culture (0·14 mg/ml per d). In the case of WI supplementation, the treatment was applied on the first day (0·55 mg/ml). The lower vitamin E concentration currently used (8·3 µg/ml) corresponded to the daily intake recommended by the SAP (4 mg/d) and the other was two-fold higher (16·6 g/ml). Vitamin E was previously dissolved in 10 % ethanol and all the concentrations were calculated per 10 ml of culture medium. The same blood pool was used to perform three replicates of each test to ensure accurate estimates.
Table 1. Weekly iron (WI) and daily iron (DI) control values for each assay (Mean values and standard deviations)

MTT, 3-[4,5-dimethylthiazol-2-yl]-2,5 diphenyl tetrazolium bromide; T-BARS, thiobarbituric acid reactive substances; ROS, reactive oxygen species; LDH, lactate dehydrogenase; SOD, superoxide dismutase.
Ethical approval
This study was conducted according to the guidelines laid down in the Declaration of Helsinki. The protocol was approved by the Advisory Committee on Bioethics of the National University of La Plata (Expte Nro. 0100-015036/17-000), Argentina. Blood samples were collected from healthy donors after signing the appropriate informed consent.
Assays
Haemolysis
Haemolysis is the process of destruction of erythrocytes. This colorimetric test is based on the detection of the degree of erythrocyte lysis by spectrophotometry(Reference Mitarotonda37). On day 7, the culture was transferred to a tube and centrifuged at 161 relative centrifugal force. Then, 100 µl of the supernatant was read at 540 nm in a MultiskanTM GO spectrophotometer (Thermo Fisher Scientific) to determine the degree of haemolysis. Control of 100 % haemolysis was obtained from blood treated with 1 % triton.
3-[4,5-dimethylthiazol-2-yl]-2,5 diphenyl tetrazolium bromide
The enzyme NADPH can reflect the number of viable cells by reducing the 3-[4,5-dimethylthiazol-2-yl]-2,5 diphenyl tetrazolium bromide dye to an insoluble purple formazan form. For this technique, 10 % ethanol (Merck KGaA) was used as PC. Erythrocytes were separated from whole blood with lysis buffer (ammonium-chloride-potassium (ACK); Roche, SIGMA Aldrich). Then, 240 µl of the 3-[4,5-dimethylthiazol-2-yl]-2,5 diphenyl tetrazolium bromide stock solution was added. After 3 h of incubation, 100 µl of the extraction solvent dimethyl sulfoxide was added per well, and readings were carried out at 550 nm in a MultiskanTM GO spectrophotometer (Thermo Fisher Scientific).
Neutral red
This assay is based on the incorporation of this dye into the lysosomes of viable cells(Reference Borenfreund and Puerner38). The PC was 10 % ethanol (Merck KGaA). At the end of culture, erythrocytes were separated with the ACK lysis buffer and neutral red dissolved in PBS (final concentration, 0·33 %) was added (3-h incubation at 37°C). Subsequently, 100 µl of extraction solution (1 % glacial acetic acid, 50 % ethanol and 49 % distilled water) was added per well. Finally, the absorbance of the supernatant was read at 550 nm (MultiskanTM GO). Results were expressed as a percentage of lysosomal activity.
Total iron content in cells
This technique allows measuring the amount of iron in lymphocytes. At the end of culture, erythrocytes were separated with the ACK buffer, centrifuged and the supernatant was discarded. Then, the pellet was evaporated for 48 h at 80°C. Afterwards, a mixture of nitric and perchloric acid (HNO3/HClO4) (1:1) was added to mineralise. Quantification was carried out with bathophenanthroline and absorbance was read at 535 nm(Reference Fagali, Grillo and Puntarulo39).
Iron content in the culture medium
This technique allows measuring the remaining iron left in the culture medium after each treatment. The culture medium was separated, homogenised, mixed with 100 µl 0·2N HCl and 400 µl 2 mM desferal, finally adding 400 µl of Tris buffer. After 15 min at room temperature, the absorbance was measured at 430 nm(Reference Fagali, Grillo and Puntarulo39).
Thiobarbituric acid reactive substances
Lipid peroxidation is considered a basic indicator to assess oxidative stress. The malonaldehyde (MDA) present in the sample reacts with thiobarbituric acid and forms an adduct (MDA–thiobarbituric acid). For measurement in the homogenate, erythrocytes were lysed with ACK buffer. Lymphocytes were frozen three times to mechanically break cells. Then, 50 µl of sample, 100 µl of TCA and 50 µl of thiobarbituric acid were added to Eppendorf tubes, vortexed and incubated in a thermostatic bath for 20 min at 95°C. Then, the tubes were centrifuged for 10 min at 1792 relative centrifugal force. The MDA–thiobarbituric acid adduct was measured colorimetrically by spectrophotometry at 535 nm. Hydrogen peroxide (Cicarelli Laboratorios) was used as PC for oxidative stress techniques.
Reactive oxygen species
Dichlorodihydrofluorescein diacetate is used to detect the presence of ROS produced in the cytoplasm and various organelles. Fluorescence intensity (FI) is proportional to the level of oxidative stress(Reference Paraidathathu, de Groot and Kehrer40,Reference Young, Cunningham and Bailey41) . After culture, erythrocytes were lysed with ACK buffer. Then, a 96-well plate was seeded with 100 µl of cell suspension and 100 µl dichlorodihydrofluorescein (10 µM) and incubated in the dark for 20–30 min at 37°C. Readings were performed by fluorometry at 488 excitation and 535 emission length. Two controls were carried out: NC with a powerful antioxidant (5 mM N-acetyl cysteine and PC with 1 M hydrogen peroxide.
Lactate dehydrogenase
The LDH assay is generally used as a parameter of tissue damage, but in erythrocytes it is used as an indicator of total oxidative state. The enzyme LDH catalyses the reversible lactate-to-pyruvate conversion by reducing NAD to NADH. Wiener kit’s protocol (Wiener Laboratorios S.A.,) with some modifications for use in a 96-well plate was applied.
Superoxide dismutase
This assay is an indirect method of evaluating oxidative stress. SOD catalyses the dismutation of the superoxide radical (O2-) into oxygen (O2) and hydrogen peroxide (H2O2). The technique was carried out with the Cayman commercial kit (Cayman Chemical) according to the specific protocol provided by the manufacturer. Briefly, erythrocytes were lysed and suspended in ice-cold HPLC-grade water. The erythrocyte lysate was diluted 1:100 with the buffer. Then, 200 µl of the diluted radical detector and 10 µl of sample were added to the wells. To start the reaction, 20 μl of diluted xanthine oxidase was added to each well. The plate was incubated on a shaker for 30 min at room temperature and then the absorbance was read at 440–460 nm using a plate reader.
Catalase
This colorimetric assay is a direct method to measure oxidative stress. Catalase catalyses the breakdown of hydrogen peroxide into water and oxygen. One unit of catalase enzyme is defined as 1 µmol of hydrogen peroxide consumed per minute. After blood centrifugation for 10 min, plasma was separated from erythrocytes and washed with physiological solution. The erythrocytes were haemolysed with distilled water (1/20) and centrifuged for 10 min. The supernatant was collected and diluted 1/100 with 50 mM sodium phosphate buffer at pH 7·0. The buffer and the sample were placed in the quartz cuvette and hydrogen peroxide was added. The absorbance was read at 240 nm in a spectrophotometer, at time zero and after 5 min.
Alkaline comet assay
The single cell gel electrophoresis assay (Comet assay) allows quantifying individual cell levels of DNA damage. The test was carried out under alkaline conditions. The cells were embedded in low melting point agarose (0·5 %) and deposited on slides previously coated with 150 µl of 0·5 % normal melting point agarose. Subsequently, the slides were immersed in pH 10 lysis solution for 24 h. The PC was treated with 1 μg/ml bleomycin (Gador S.A.). Alkaline treatment was carried out for 20 min and electrophoresis was performed at 4°C, 20 V and 250 mA for another 20 min. The slides were stained with SYBR Green. Using a fluorescence microscope, 200 images were analysed per experimental point. The DNA damage was determined according to comet tail length (from 0 to 4) and damage index was obtained(Reference Collins42).
Statistical analysis
For each trial, three independent experiments were performed. One-way ANOVA was used for normally distributed variables. If differences were significant, the Fisher’s least significant difference (LSD) test was used, adding a letter to each treatment; groups not sharing the same letter were significantly different from each other. Variables with no normal distribution were analysed using Kruskal–Wallis test, indicating significant differences with an asterisk. Data analysis was carried out with the statistical programme Statgraphics® 5.1 software (Manugistics Inc.). P < 0·05 was considered statistically significant. Results were expressed as mean values and standard deviations.
Results
Haemolysis
The highest level of haemolysis corresponded to PC (100 %), evidencing a large difference with the other experimental groups. The lowest haemolysis corresponded to C 8·3 (13·14 %), followed by NC (15·24 %) and C 16·6 (15·60 %). WI 16·6 (18·74 %) showed lower haemolysis than WI 8·3 (22·49 %) and DI 8·3 (28·05 %) and DI 16·6 (27·05 %) (Kruskal–Wallis results; P = 0·0044; Fig. 2(a)).

Fig. 2. Cell viability and haemolysis values (%). Negative control (NC), 8·3 vitamin E control (C 8·3), 16·6 vitamin E control (C 16·6), weekly iron 8·3 (WI 8·3), weekly iron 16·6 (WI 16·6), daily iron 8·3 (DI 8·3), daily iron 16·6 (DI 16·6) and positive control (PC). All assays were performed in triplicate. Groups that do not share the same letter are significantly different from each other. (a) Haemolysis assay in culture supernatant. Data are mean values and standard deviations. Kruskal–Wallis (P = 0·0044) contrast test results. (b) 3-[4,5-dimethylthiazol-2-yl]-2,5 diphenyl tetrazolium bromide (MTT) in peripheral human blood. Data are mean values and standard deviations. One-way ANOVA (P < 0·001) test results. (c) Neutral red in peripheral human blood. Data are mean values and standard deviations. One-way ANOVA results (P = 0·00442).
3-[4,5-dimethylthiazol-2-yl]-2,5 diphenyl tetrazolium bromide
Highest and lowest cell viability was observed in WI 16·6 (100 %) and PC (9 %), respectively. At the same time, WI 16·6 showed higher viability than WI 8·3 (79·7 %) and DI 16·6 (73·09 %) and 8·3 (44·82 %). ANOVA showed statistically significant differences among all the experimental groups (P < 0·001; Fig. 2(b)). Thus, the groups identified with Fisher’s LSD test, from higher to lower cell viability, were as follows: WI 16·6; C 16·6 and WI 8·3; WI 8·3, DI 16·6 and C 8·3; NC and DI 8·3; PC.
Neutral red
The same as with the 3-[4,5-dimethylthiazol-2-yl]-2,5 diphenyl tetrazolium bromide assay, highest and lowest cell viability was found in WI 16·6 (100 %) and PC (16·03 %), respectively. Differences among the experimental groups were significant (one-way ANOVA, P = 0·00442; Fig. 2(c)). Two homogeneous groups were identified with Fisher’s LSD test: (1) NC, C 8·3, C 16·6, DI 8·3, DI 16·6, WI 8·3, WI 16·6; and (2) PC.
Total iron cell content
The amount of iron detected in NC was very low (0·4 µg/ml), and it fell below the level of detection in PC (Fig. 3). In DI and WI, the amount of iron ranged between 2·5–3 and 4–6 µg/ml, respectively. Cultures with the highest amount of vitamin E (16·6) and both ferrous sulphate supplementations (DI and WI) presented lower iron content in the extracellular medium and higher content in cultured cells compared with cultures with the recommended vitamin E dose (8·3). Total iron content (supernatant plus cell pellet) was significantly higher in DI (ANOVA, P = 0·0435) than WI.

Fig. 3. Iron measures. Negative control (NC), 8·3 vitamin E control (C 8·3), 16·6 vitamin E control (C 16·6), weekly iron (WI), weekly iron 8·3 (WI 8·3), weekly iron 16·6 (WI 16·6), daily iron (DI), daily iron 8·3 (DI 8·3) and daily iron 16·6 (DI 16·6). Desferal colorimetric assay in the culture supernatant and bathophenanthroline assay in peripheral human blood cultured for 7 d. ![]() , supernatant;
, supernatant; ![]() , pellet.
, pellet.
Iron content in culture medium
Iron values fell below the level of detection in NC, whereas they ranged between 13–15 and 7–8·5 µg/ml in DI and WI, respectively (Fig. 3). Both DI and WI with the highest amount of vitamin E (16·6) presented the least amount of iron in the supernatant than their equivalents with the lowest vitamin E dose (8·3).
Thiobarbituric acid reactive substances
The highest lipid peroxidation was observed in PC (925·75 nmol MDA/ml) and the lowest in both vitamin E controls (C 8·3:400 nmol MDA/ml; C 16·6:423·25 nmol MDA/ml) and NC (425·625 nmol MDA/ml). In WI 16·6 (502·625 nmol MDA/ml) and WI 8·3 (511·875 nmol MDA/ml), a lower peroxidation could be observed compared with DI with both vitamin E concentrations (8·3:560·375 nmol MDA/ml; 16·6:528·125 nmol MDA/ml) (Fig. 4(a)). Kruskal–Wallis analysis was performed considering that the data obtained did not have a normal distribution; however, no differences were found.
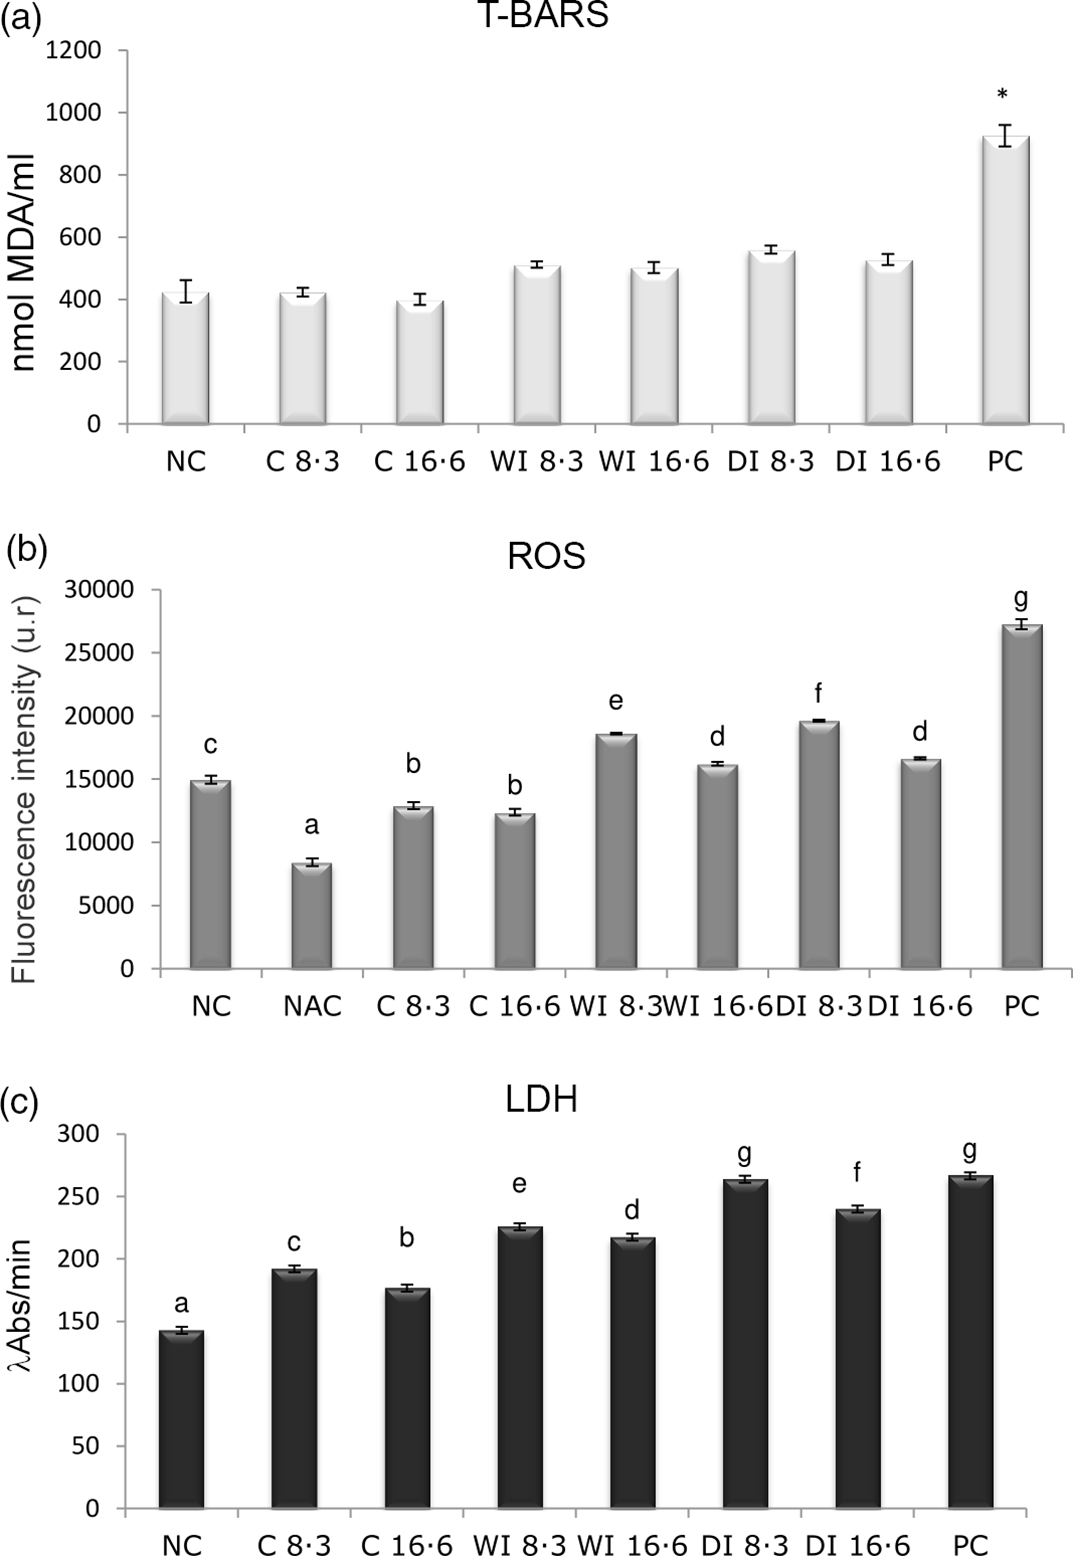
Fig. 4. Oxidative stress average values. Negative control (NC), 8·3 vitamin E control (C 8·3), 16·6 vitamin E control (C 16·6), weekly iron 8·3 (WI 8·3), weekly iron 16·6 (WI 16·6), daily iron 8·3 (DI 8·3), daily iron 16·6 (DI 16·6) and positive control (PC). All assays were performed in triplicate. Groups that do not share the same letter are significantly different from each other. (a) Thiobarbituric acid reactive substances (T-BARS) assay in peripheral human lymphocytes. Data are mean values and standard deviations. Kruskal–Wallis (P > 0·05) contrast test results. (b) Reactive oxygen species (ROS) assay in peripheral human lymphocytes. Data are mean values and standard deviations. One-way ANOVA results (P = 0·0000). (c) Lactate dehydrogenase (LDH) assay in erythrocytes. Data are mean values and standard deviations. One-way ANOVA test results (P < 0·0001).
Reactive oxygen species
Highest and lowest ROS production was observed in PC (27 266 FI) and N-acetyl cysteine (8434 FI), respectively. The WI 16·6-supplemented group presented lower ROS frequencies (16 212 FI) as compared with WI 8·3 (18 607 FI) and DI (16·6:16 644 FI; 8·3:19 626 FI). One-way ANOVA analysis showed significant differences (P = 0·0000) (Fig. 4(b)). The groups identified by Fisher’s LSD test, organised from lowest to highest, were as follows: (a) N-acetyl cysteine; (b) C 8·3 and C 16·6; (c) NC; (d) WI 16·6 and DI 16·6: (e) WI 8·3; (f) DI 8·3; and (g) PC.
Lactate dehydrogenase
The highest LDH production was observed in PC (266·546 λAbs/min) and the lowest in NC (142·818 λAbs/min). LDH values were lower in both vitamin E treatments combined with WI 16·6 (217·336 λAbs/min) and 8·3 (225·772 λAbs/min) than DI 16·6 (239·832 λAbs/min) and 8·3 (263·734 λAbs/min). Total oxidant status in cultures showed significant differences (ANOVA, P < 0·0001; Fig. 4(c)). Fisher’s LSD test differentiated seven homogeneous groups: (a) NC; (b) C 16·6; (c) C 8·3; (d) WI 16·6; (e) WI 8·3; (f) DI 16·6; (g) DI 8·3 and PC.
Superoxide dismutase
Highest and lowest SOD activity was observed in PC (0·013 USOD/ml) and both C 8·3 and 16·6 (0·005 USOD/ml), respectively. In relation to combined supplementation, lower SOD activity was observed in WI 16·6 (0·007 USOD/ml) and WI 8·3 (0·007 USOD/ml) compared with DI 16·6 (0·009 USOD/ml) and DI 8·3 (0·009 USOD/ml). In general, no significant differences among groups were detected (Kruskal–Wallis test; P = 0·09) (Fig. 5(a)).

Fig. 5. Antioxidant average values. Negative control (NC), 8·3 vitamin E control (C 8·3), 16·6 vitamin E control (C 16·6), weekly 8·3 iron (WI 8·3), weekly 16·6 iron (WI 16·6), daily 8·3 iron (DI 8·3), daily 16·6 iron (DI 16·6) and positive control (PC). All assays were performed in triplicate. Groups that do not share the same letter are significantly different from each other. (a) Superoxide dismutase (SOD) assay performed in erythrocytes. Data are mean values and standard deviations. Kruskal–Wallis test results (P = 0·09). (b) Catalase assay performed in erythrocytes. Data are mean values and standard deviations. One-way ANOVA results (P = 0·0000).
Catalase
The same as with the SOD assay, a lower enzyme activity was observed in the combined treatment (WI 16·6:37 740 U catalase/ml; WI 8·3:40 515 U catalase/ml) compared with DI with both vitamin E doses (16·6:47 175 U catalase/ml; 8·3:49 395 U catalase/ml). Differences were significant (Fig. 5(b), ANOVA, P = 0·0000). Seven homogeneous groups were identified with Fisher’s LSD test: (a) NC; (b) WI 16·6; (c) WI 8·3; (d) DI 16·6; (e) C 16·6 and DI 8·3; (f) C 83; and (g) PC.
Alkaline comet assay
The highest damage index corresponded to PC (156·75), followed by DI 8·3 (66·00). Both WI 8·3 (41·00) and WI 16·6 (27·00) had a lower damage index than DI 8·3 (66·00) and DI 16·6 (44·25). Differences among all cultures were significant (ANOVA, P < 0·0001) (Fig. 6). Five groups were differentiated with Fisher’s LSD test: (a) NC; C 8·3 and C 16·6; (b) C 8·3 and WI 16·6; (c) WI 8·3 and DI 16·6; (d) DI 8·3; and (e) PC.

Fig. 6. Comet assay values (%). Negative control (NC), 8·3 vitamin E control (C 8·3), 16·6 vitamin E control (C 16·6), weekly 8·3 iron (WI 8·3), weekly 16·6 iron (WI 16·6), daily 8·3 iron (DI 8·3), daily 16·6 iron (DI 16·6) and positive control (PC). All assays were performed in triplicate. Groups that do not share the same letter are significantly different from each other. Comet assay was performed in peripheral human lymphocytes. Data are mean values and standard deviations. ANOVA test results (P < 0·0001).
Discussion
In this study, we analysed the effect of the combined administration of daily and weekly ferrous sulphate with vitamin E for IDA prevention on cell viability, oxidative stress and genetic damage in peripheral blood cultured in vitro.
Our findings showed that WI with the maximum vitamin E dose (WI 16·6) elicited the highest cell viability. Further, WI with both doses of vitamin E resulted in better cell viability than the two daily combinations. As expected, PC had the lowest viability. All experimental groups, with the exception of PC, exceeded 50 % of the cell viability, which is of utmost importance considering the length of the culture time used in the present experimental design. It should be noted that the ferrous sulphate doses currently used were not toxic because they were intended as preventive supplementation. Interestingly, the two vitamin E groups (C 16·6 and C 8·3) exceeded the number of living cells in NC, suggesting that the vitamin improved cell viability. In this sense, Avula and Fernández observed that supplementation with vitamin E in mice diet would favour cell proliferation as well as decrease programmed cell death by reducing lipid peroxides(Reference Avula and Fernandes43). Regarding haemolysis results, the highest measurements were observed in PC treated with triton (100 % of the erythrocyte lysate), followed by both DI groups (less than 30 % haemolysis), and both WI cultures, in which haemolysis decreased by approximately 20 %. The lowest values (around 15 %) were reached in NC and both vitamin E controls, whereas a higher dose of vitamin E resulted in less haemolysis. In this sense, Marar observed a protective in vitro effect of vitamin E by reducing the haemolysis of erythrocytes in hyperglycaemic conditions(Reference Marar44). Jilani et al. provided a possible explanation for this, indicating that vitamin E could suppress the inhibition of apoptosis of human erythroid progenitor cells to increase the Hb concentration(Reference Jilani, Azam and Moiz45,Reference Jilani and Iqbal46) .
The analysis of oxidative stress using different assays showed various results. The thiobarbituric acid reactive substances assay showed a decreasing trend in lipid peroxidation with the combined supplementations (DI 8·3, DI 16·6, WI 8·3 and WI 16·6), having WI 16·6 the lowest lipid peroxidation, although differences were not statistically significant. The LDH assay showed the same tendency as the thiobarbituric acid reactive substances regarding total oxidative state, but with significant differences among groups. The lowest oxidative stress was observed with WI 16·6 using both techniques. There was also evidence of a slight decrease in oxidative state with both vitamin E controls. General oxidative stress assessed by the ROS assay was lower with both weekly supplementations than with daily supplementation. Furthermore, the combinations with the highest doses of vitamin E resulted in lower ROS values, suggesting a protective effect. This was also observed in vitamin E controls, although differences were not significant.
The assays measuring the antioxidant activity of catalase and SOD showed a higher response with DI as compared with WI administration. Apparently, the antioxidant response of the system increases in the presence of a powerful pro-oxidant such as ferrous sulphate, although such increase is not enough to prevent the slight final oxidative stress induced by iron. However, co-supplementation with vitamin E would strengthen and complement the defence system and attenuate the oxidative stress caused by ferrous sulphate. Most studies refer to a protective and beneficial function of this vitamin(Reference Altamura, Vegi and Hoppe47–Reference Wawrzyniak, Górnicka and Hamułka49). For instance, co-supplementation of α-tocopherol with ascorbic acid protected the gastrointestinal tract against iron-mediated oxidative stress in iron-deficient rats(Reference Srigiridhar and Nair50). Tang et al. proposed that adding vitamin E to therapeutic iron treatment favoured absorption by reducing inflammation(Reference Tang, Frank and Sherlock31). Arnon et al. found this combination effective and safe in improving anaemia in preterm infants(Reference Arnon, Regev and Bauer51). Also, Madhikarmi and Murthy and Şimşek Orhon et al. investigated the oxidant and antioxidant status of IDA, suggesting that lower lipid peroxidation was achieved after vitamin E supplementation since MDA production was reduced(Reference Madhikarmi and Murthy52,Reference Şimşek Orhon, Öztürk and Erbaş53) . Madhikarmi and Murthy also observed an increase in antioxidant enzymes and Isler et al. proposed that vitamin E supplementation in parenteral iron treatment could be an effective strategy to restore the antioxidant response during anaemia(Reference Madhikarmi and Murthy52,Reference Isler, Delibas and Guclu54) .
Concerning cytomolecular damage results, the highest values corresponded to PC and the lowest (< 15 % damage) to NC and both vitamin E controls. As already reported by Gambaro et al., damage index was lower with WI than DI supplementation(Reference Gambaro, Seoane and Padula32). Both ferrous sulphate supplementations with the highest doses of vitamin E (DI 16·6 and WI 16·6) decreased significantly the cytomolecular damage. These results are in line with those of Kan et al., who observed a clear genoprotective effect of vitamin E supplementation on dialysis patients after 14 weeks of treatment, showing a six-fold damage index decrease(Reference Kan, Ündeğer and Bali55). Although there is no clear consensus, damage index varies between 1 and 30 in in vivo control tests(Reference García, Mandina and Lamadrid56,Reference Martino-Roth, Viégas and Roth57) . This reference range corresponds to the NC and weekly cultures, while damage index was slightly higher with daily supplementation. This parameter improved after treatment with vitamin E, since this potent lipid antioxidant reduced chromosomal damage by inhibiting free radical formation and activating endonucleases, which increase the rate of elimination of damaged DNA(Reference Claycombe and Meydani58). The current results might be interpreted as follows: in the presence of a powerful pro-oxidant such as ferrous sulphate, a higher amount of vitamin E would be beneficial to prevent free radical production and consequently avoid genetic damage. Despite most studies suggest that vitamin E protects against mutagenic effects, others have not observed these benefits(Reference Claycombe and Meydani58). For example, the analysis of DNA damage using the comet assay found no significant differences between controls and thalassemic patients supplemented with vitamin E for 3 months(Reference Ozdemir, Koc and Aycicek59). Also, Asare et al. found that vitamins A and E could not attenuate free radical and mutagenic liver damage induced by dietary excess iron(Reference Asare, Kew and Mossanda60).
While supernatant iron levels were considerably higher with DI supplementation, a slight iron increase could be observed in lymphocytes after WI supplementation. Probably, iron absorption, regulation, transport and storage mechanisms were optimised by WI, preventing the increase of antioxidant enzymes and, consequently, eventual genetic damage. On the contrary, a certain iron overload could be observed with DI supplementation, which increased not only the antioxidant response but also the genetic damage.
Ferroptosis is an interesting concept to analyse. It is known that excess iron and the consequent increase of ROS and lipid peroxidation play a crucial role in this form of cell death(Reference Bayır, Anthonymuthu and Tyurina61), which could be related to the results currently reported. In the case of DI supplementation, there was a high decrease in cell viability and higher lipid peroxidation, and an overload of iron correlated with increased ROS levels. Nevertheless, WI supplementation did not elicit such results. On the other hand, the highest vitamin E dose (16·6) seemed to decrease all the parameters related to ferroptosis with both ferrous sulphate supplementations. Several studies support the role of vitamin E in the detoxification of lipid peroxyl radicals as a mechanism for regulating ferroptosis(Reference Kagan, Mao and Qu62). Thus, lipophilic antioxidants, such as vitamin E, exhibited the highest potential in experimental studies(Reference Bayır, Anthonymuthu and Tyurina61). In 2008, without referring specifically to ferroptosis, Seiler et al. proposed that Gpx4 deletion and lipid peroxidation caused a new form of non-apoptotic cell death that could be prevented with vitamin E(Reference Seiler, Schneider and Förster63). Chen et al. also observed that supplementation with vitamin E delayed ferroptosis-induced neuron degeneration and paralysis in adult mice(Reference Chen, Hambright and Na64). Carlson et al. proposed that GPX4 deficiency associated with ferroptosis leads to early embryonic lethality and could be prevented with an enriched diet with vitamin E(Reference Carlson, Tobe and Yefremova65). More recently, Tavakol and Seifalian proposed ferroptosis as one of the central mechanisms of cell death in patients with COVID-19, positioning vitamin E as a suitable antioxidant for anti-ferroptotic treatments since it reacts with peroxyl radicals to prevent the formation of lipid hydroperoxides(Reference Tavakol and Seifalian66).
One of the limitations of the present work was that it was an in vitro study, whose results cannot be extrapolated to in vivo assays. Further studies in vivo could corroborate whether weekly ferrous sulphate supplementation would help to decrease IDA prevalence in children by reducing its adverse effects, thereby achieving better patient compliance with this IDA preventive treatment.
Conclusion
Based on the results obtained, weekly ferrous sulphate supplementation induced less damage in vitro than daily administration, manifesting as a better alternative for the preventive supplementation of children under 24 months with IDA. Only daily ferrous sulphate supplementation decreased cell viability and increased ROS and lipid peroxidation, which could be explained by the excess iron observed. The new form of non-apoptotic cell death called ferroptosis could also be related, despite more specific techniques and analysis would be necessary. Vitamin E is widely regarded as one of the main mechanisms to reduce the oxidative stress and genomic damage caused by ferrous sulphate because it would complement the response of enzymatic antioxidants. By doubling the daily vitamin E intake recommendation for infants (8 mg/d), this protective effect was enhanced. The combined administration of weekly ferrous sulphate with double vitamin E dose could be a useful strategy to reduce the adverse effects of this preventive supplementation.
As far as the authors are concerned, this is the first report of the association of vitamin E and preventive supplementation for IDA, making this topic a promising area for future research.
Acknowledgements
The authors thank Adriana Di Maggio for careful manuscript translation and editing and César E. Bianchi and Natalia Alvarez for technical assistance.
This study was supported with funds provided by the National Scientific and Technical Research Council of Argentina (grant no. 0657) and La Plata National University (grants V246 and V249).
R. G. analysed the data, prepared figures and drafted the manuscript. R. G., A. S. and G. P. designed the research, applied for research funding and administrated the project. All authors approved the final manuscript and had complete access to the study data.
The authors declare that they have no conflict of interest.


