


The high prevalence of non-communicable diseases (NCD), including obesity, CVD, hypertension, and diabetes, has become a persistent public health concern in both developed and developing countries(Reference Barry, Battel-Kirk and Dempsey1). According to the WHO, modifiable behaviours such as unhealthy diet, physical inactivity, and smoking are major risk factors for 80 % of NCD(Reference Mendis2). Therefore, there has been considerable interest in studying the role of nutrition in the aetiology and prevention of NCD during the last decades(Reference Mendis2). Despite the focus of food programmes and policies on the improvement of diet quality, the majority of children and adolescents do not meet most of the dietary recommendations(Reference Munoz, Krebs-Smith and Ballard-Barbash3). The transition into late childhood and adolescence is usually accompanied by increased independence that may bring about undesirable changes in dietary behaviours(4–Reference Goodburn and Ross6).
It is well documented that the learned dietary behaviours and food skills in childhood and adolescence are sustained in adulthood that may affect the risk of diet-related diseases lifelong(Reference Laska, Larson and Neumark-Sztainer7). Therefore, promoting healthy behaviours at these stages is a unique opportunity to prevent and control long-term health problems(Reference Sacco, Lillico and Chen8). To identify which factors may lead to unhealthy eating habits and subsequently diet-related diseases, assessment of food and nutrition literacy levels among children and adolescents is crucial(Reference Vaitkeviciute, Ball and Harris9).
Food literacy is an emerging term defined as the ‘collection of inter-related knowledge, skills and behaviours required to plan, manage, select, prepare and eat foods to meet needs and determine food intake’(Reference Vidgen and Gallegos10). This concept is growingly used in research, policy and practice in tackling the causal link between health problems and food choices. Hence, improving food literacy and nutrition among children and adolescents has in particular been the target of nutrition-based programmes and policies(Reference Cullerton, Vidgen and Gallegos11).
To measure food and nutrition literacy among Iranian children, a Food and Nutrition Literacy (FNLIT) questionnaire was primarily developed and validated in Tehran(Reference Doustmohammadian, Omidvar and Keshavarz-Mohammadi12). Since food literacy has a complex nature and has been affected by contextual influences such as geographical, socio-cultural and racial factors(Reference Roudsari, Vedadhir and Amiri13,Reference Doustmohammadian, Keshavarz Mohammadi and Omidvar14) , the applicability of this questionnaire to children in other parts of Iran is limited. To ensure the effectiveness of nutrition-related programmes and assess the linkage between food literacy and eating habits among Iranian children, a cross-cultural valid and comprehensible scale is needed. With this regard, the present study aimed to modify and update the previous version of the FNLIT questionnaire using a mix-method approach and then evaluate its psychometric properties in upper primary school children in Mashhad.
Materials & methods
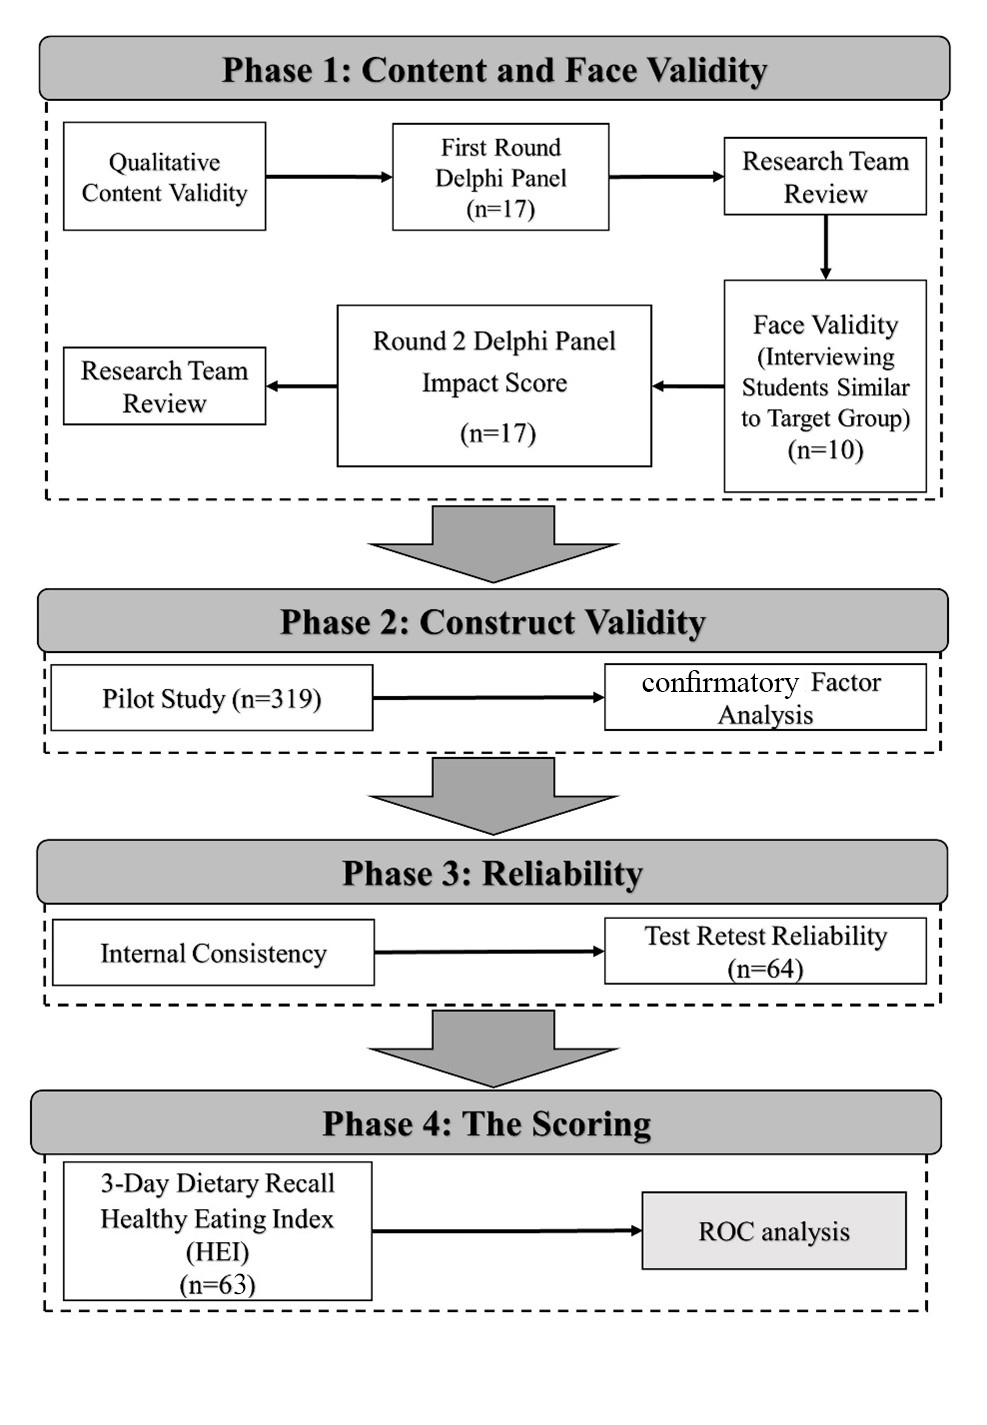
The validation study was conducted in 2018–2019 in Mashhad. The questionnaire was adapted from a previously developed questionnaire. This questionnaire consisted of forty-six items within two cognitive and skill domains, which was validated for children in fifth and sixth grade in Tehran, the capital city of Iran(Reference Doustmohammadian, Omidvar and Keshavarz-Mohammadi12). The research team included three nutritionists, one pediatric psychologist, one health education and promotion specialist and one community medicine specialist. It was a mixed-method study in which the relative validity and reliability of a modified food and nutrition literacy (M-FNLIT) questionnaire were assessed. The study was conducted in four distinct phases including assessments of content and face validity, construct validity, reliability and detecting cut-off scores (Fig. 1).

Fig. 1. Study flow chart.
Phase 1) content and face validity
Content validity
Content validity of the scale was assessed by a two-round Delphi during summer and fall, 2018. A total of twenty experts, involved in the field of nutrition-related research, were invited to participate as panelists of the Delphi via email. For qualitative content validity, panelists were asked to examine the initial questionnaire in terms of age appropriateness and cultural and socio-economic considerations. To calculate the Content validity Index (CVI), the experts were asked to assess individual questions regarding relevancy, clarity, and simplicity. Questions on the necessity of each item were asked to calculate the Content Validity Ratio (CVR). After revising items based on the feedback of the first round, the revised questionnaire was sent to the panelists for further feedback.
Face validity
To assess the qualitative face validity of the scale, a convenience sampling of ten (five girls, five boys) aged 9–12 years, who did not take part in the main study, were interviewed to ascertain whether there were any ambiguity, irrelevancy and complexity for each item. The children were asked if they comprehended each question. Then they were requested to say their opinions on the overall test instrument, particularly content and format. To evaluate quantitative face validity, Impact Score was calculated. In the second round of Delphi, experts were asked to evaluate the importance of each item based on a five-point Likert scale ranging from one (not important at all) to five (highly important). The Impact Score was calculated for each item using the following formula in which scores higher than 1·5 were considered acceptable. Impact score = frequency (%) × importance(Reference Mohammadbeigi, Mohammadsalehi and Aligol15).
Phase 2) construct validity
Subjects
To assess construct validity, a total of 325 children aged 9 to 12 years were selected from the upper primary schools in the city of Mashhad, north-east of Iran. Data collection conducted from December 2018 to March 2019. Study subjects were chosen using a multistage random sampling method. Of the seven educational districts of Mashhad, three districts were selected randomly. To maximise the generalisability of the sample, two schools were randomly chosen based on the socio-economic level of each district, including affluent, semi-affluent and deprived that resulted in the selection of six schools in this stage. In the second stage of random sampling, students were selected from the schools. Fourth, fifth and sixth graders, who did not have any chronic or acute diseases and did not follow special diets, were eligible to participate in the study. The sample size was determined based on the instrument’s items(Reference Munro16). Bentler and Chou suggested the ratio of 5:10 participants per item would be suitable for structural equation modelling(Reference Bentler and Chou17). In this study, we considered seven samples for each item of scale.
Socio-demographic data, including child’s age, birth order, parents’ age, parental education, and employment, were obtained through interviewing students’ parents or caregivers by experienced interviewers. Anthropometric data were measured based on standard methods by a trained dietitian using the calibrated equipment(18). BMI was calculated as weight in kilograms divided by the square of height in meter. The BMI Z-score for age and sex was calculated based on the World Health Organization Child Growth Standards software (AnthroPlus, World Health Organization, Geneva, Switzerland, 2007)(19). The weight status of children was reported in four categories, including underweight (z-score < 2 standard deviations (sd), normal (z-score ≥–2 sd and ≤ 1 sd), overweight (z-score > 1 sd and ≤ 2SD) and obese (z-score > 2 sd).
During January and February 2019, The M-FNLIT, a paper-based self-administrative questionnaire, was filled out by students under the study team’s supervision. The average length of time for completion of the questionnaire was 15 min.
Confirmatory factor analysis
To confirm the construct validity, Confirmatory Factor Analysis (CFA) was performed to examine whether the existing data set fitted the measurement model, which was developed with a priori hypothesis(Reference Doustmohammadian, Omidvar and Keshavarz-Mohammadi12). Goodness-of-fit index (GFI), adjusted goodness of fit index, root mean square error of approximation, X2/DF and comparative fit index were used to confirm the fitness of the suggested model.
Phase 3) reliability assessment
Internal consistency
To determine internal consistency, Cronbach’s α for Likert-type items and Kuder Richardson 20 (KR-20) for dichotomous scales (correct = 1, wrong = 0) were assessed(Reference Streiner20). The reliability of M-FNLIT item scores was estimated by determining a question should be removed based on the impact on α of removing it.
Test–Retest reliability
To assess reproducibility, the test–retest procedure was performed on a convenience sample of sixty-four students aged 9–12 years, which were estimated using the following formula:
 $$n = {{{{\left( {{z_{1 - {\alpha \over 2}}} + {z_{1 - \beta }}} \right)}}^2} \over {{1 \over 2}\ln ({{1 + r} \over {1 - r}})}} + 3$$
 $${\rm{Z 1}} - \alpha /{\rm{2}} = {\rm{ 2}}/{\rm{57}}\quad{\rm{r}} = 0/{\rm{5}}\quad{\rm{Z 1}} - \beta = {\rm{ 1}}/{\rm{28}}$$
Two-way mixed-effects Intraclass Correlation Coefficient (ICC) for the absolute agreement was evaluated to assess the agreement on a scale level for each subscale and the total M-FNLIT score with an interval of 4 weeks. The level of agreement indicated by ICC was interpreted as 0·00–0·10: virtually no agreement, 0·11–0·40: slight agreement, 0·41–0·60: fair agreement, 0·61–0·80: moderate agreement and 0·81–1·0: substantial agreement(Reference Shrout21). The Kappa coefficients were also calculated for true-false items.
Phase 4) The scoring
Items scoring
The total raw scores of the M-FNLIT questionnaire ranged between 40 and 200, which were proportionately transformed to 0–100. The items 1–36 were rated on a five Likert scale. The scores of 1 to 5 were allocated to the responses of items except for items 9 to 15 which were scored inversely. The items related to ‘food label literacy’ (items 37 to 40) were dichotomous and ranged between 4 and 20. The scoring method of the finalised M-FNLIT questionnaire is attached as Supplementary Material.
Determining cut-offs for the scores
To determine the optimal FNLIT cut-off score, a receiver operating characteristic (ROC) analysis was performed. The ROC curve demonstrated the relationship between sensitivity (the proportion of true low FNLIT) and specificity (proportion of true high FNLIT) across the full range of FNLIT values. The sum score with the highest combination of sensitivity and specificity (Youden, 1950) was identified as the optimal cut-off score.
Since there is no ‘gold standard’ measurement as a criterion to assess food and nutrition literacy in children, this analysis compared the performance of the M-FNLIT scale against the measurement of Healthy Eating Index, which is validated for Iranian adolescents(Reference Azadbakht, Akbari and Esmaillzadeh22). To collect dietary intake data, sixty-three students were randomly selected from each grade level at each school to be contacted for 24-h dietary recalls. Three 24-h dietary recalls (two weekdays and one holiday) were collected through interviewing the students with a 2-week interval. A food amounts booklet was distributed among students and used to estimate serving sizes during recalls and parents and/or guardians of students were allowed to assist with recalls if needed. The data quality of completed dietary recalls was supervised by additionally trained nutritionists. After data entry in Nutritionist IV (First Databank Inc., Hearst Corp.) by an expert nutritionist, the Healthy Eating Index scores were calculated using a mean of each participant’s three dietary recalls by its’ scoring algorithm method(Reference Reedy, Lerman and Krebs-Smith23).
Statistical analysis
The total value of CVR was determined by Lawshe Table(Reference Lawshe24). Based on Lawshe table, the minimum acceptable CVR depends on the number of experts providing feedback which was 0·45 in our study. The CVI of each item was computed according to the number of experts who scored each item 3 or 4 for the relevancy, clarity and simplicity divided by the total number of experts. Based on the approach, CVI scores of > 0·79 were appropriate, between 0·70 and 0·79 were needed to be modified according to the panelists’ recommendations and less than 0·70 were unacceptable and would be omitted(Reference Polit, Beck and Owen25). CFA was performed with the Weighted Least Squares estimation method. The asymptomatic covariance matrix was considered as a weighted matrix. GFI and reasonable threshold levels of these indices for CFA were considered as relative χ2/df < 3, root mean square error of approximation < 0·08, CFA > 0·9, GFI > 0·9 and adjusted goodness of fit index > 0/8(Reference Bentler and Bonett26). The Cronbach’s alpha coefficient and KR-20 values equal to 0·7 and above were considered satisfactory. Before Cronbach’s α calculation, coding for reverse items was reversed. The ICC and Cohen kappa coefficient values greater than 0·75 were defined as acceptable(Reference Mohammadbeigi, Mohammadsalehi and Aligol15). To examine the high and low cut-off of the total score of FNLIT, two ROC analyses were conducted. The statistical analyses were performed using SPSS 25.0, AMOS 24.0 and MedCalc 19.0.
Ethics consideration
The study protocol was approved by the Ethics Committee of Mashhad University of Medical Sciences, Mashhad, Iran (approval code: IR.MUMS.fm.REC.1396·732). All experts provided informed consent for each round of the Delphi panel. The objectives of the study were fully explained to the children’s parents/guardians, and those who wished to participate in the study signed the written informed consent.
Results
Phase 1) content and face validity
The response rate for Delphi was 85 %; of twenty invited panelists, seventeen completed the survey, which were experts in the field of eight nutrition, two food science, one health promotion and education, two medical education, two social medicine and two paediatric psychology. Through qualitative content validity, items were modified based on the panel recommendations. The CVR for the total scale at the first and second rounds were 0·72 and 0·87, respectively. The satisfying agreement between the panelists suggested an acceptable content validity of the M-FNLIT questionnaire (CVI for the first and the second rounds were 0·92 and 0·98, respectively). On the whole, nine items of the questionnaire were removed and three were added. In this way, the final number of the questions decreased to 40 (v. 46 items of the former version).
Based on the results of face validity, some items and the instruction of the questionnaire were needed to be revised. Modifications were made based on the panelists’ feedback in which age appropriateness (especially for fourth grade) and the cultural and socio-economic considerations were emphasised. No item was deleted in this step as all items had an impact score of more than 1·5.
Phase 2) construct validity
A total of 319 students, aged 9–12 years, participated in the construct validity study. Participants were from grades 4 (34·1%), 5 (33·1%) and 6 (32·8 %(. Socio-demographic characteristics of the participants are reported in Table 1. Based on the results of confirmatory factor analysis, the first-order factor loadings for the cognitive domain and the skills domain of the questionnaire ranged between 0·29 to 0·70 and 0·23 to 0·78, respectively (Fig. 2 and 3). All factor loadings were statistically significant (P < 0·001). The standardised factor loadings for the second-order factor model in the construct validity study are displayed in Fig. 4. The results of the model fit for the first- and second-order factor structure of the questionnaire are reported in Table 2, which indicates the acceptable fitness of the proposed models.
Table 1. Demographic characteristics of 9–12-year-old students participated in construct validity study in the city of Mashhad, 2018 and 2019
(Mean values and standard deviations, n 319)

* P-values obtained from χ 2 test unless indicated.
† Data are shown as mean ± standard deviation.
‡ P-value obtained from independent-samples t test.
§ Data are shown as frequency (percentage).
|| Significant at the level of P < 0·05.

Fig. 2. First-order confirmatory factor analysis factor loadings construct validity study for modified Food and Nutrition Literacy (M-FNLIT) scale of 9–12-year-old students in the city of Mashhad, 2018 and 2019. n 319; all factor loadings are standardised and are statistically significant, P < 0·001.

Fig. 3. First-order confirmatory factor analysis factor loadings construct validity study for modified Food and Nutrition Literacy (M-FNLIT) scale of 9–12-year-old students in the city of Mashhad, 2018 and 2019. n 319; all factor loadings are standardised and are statistically significant, P < 0·001.
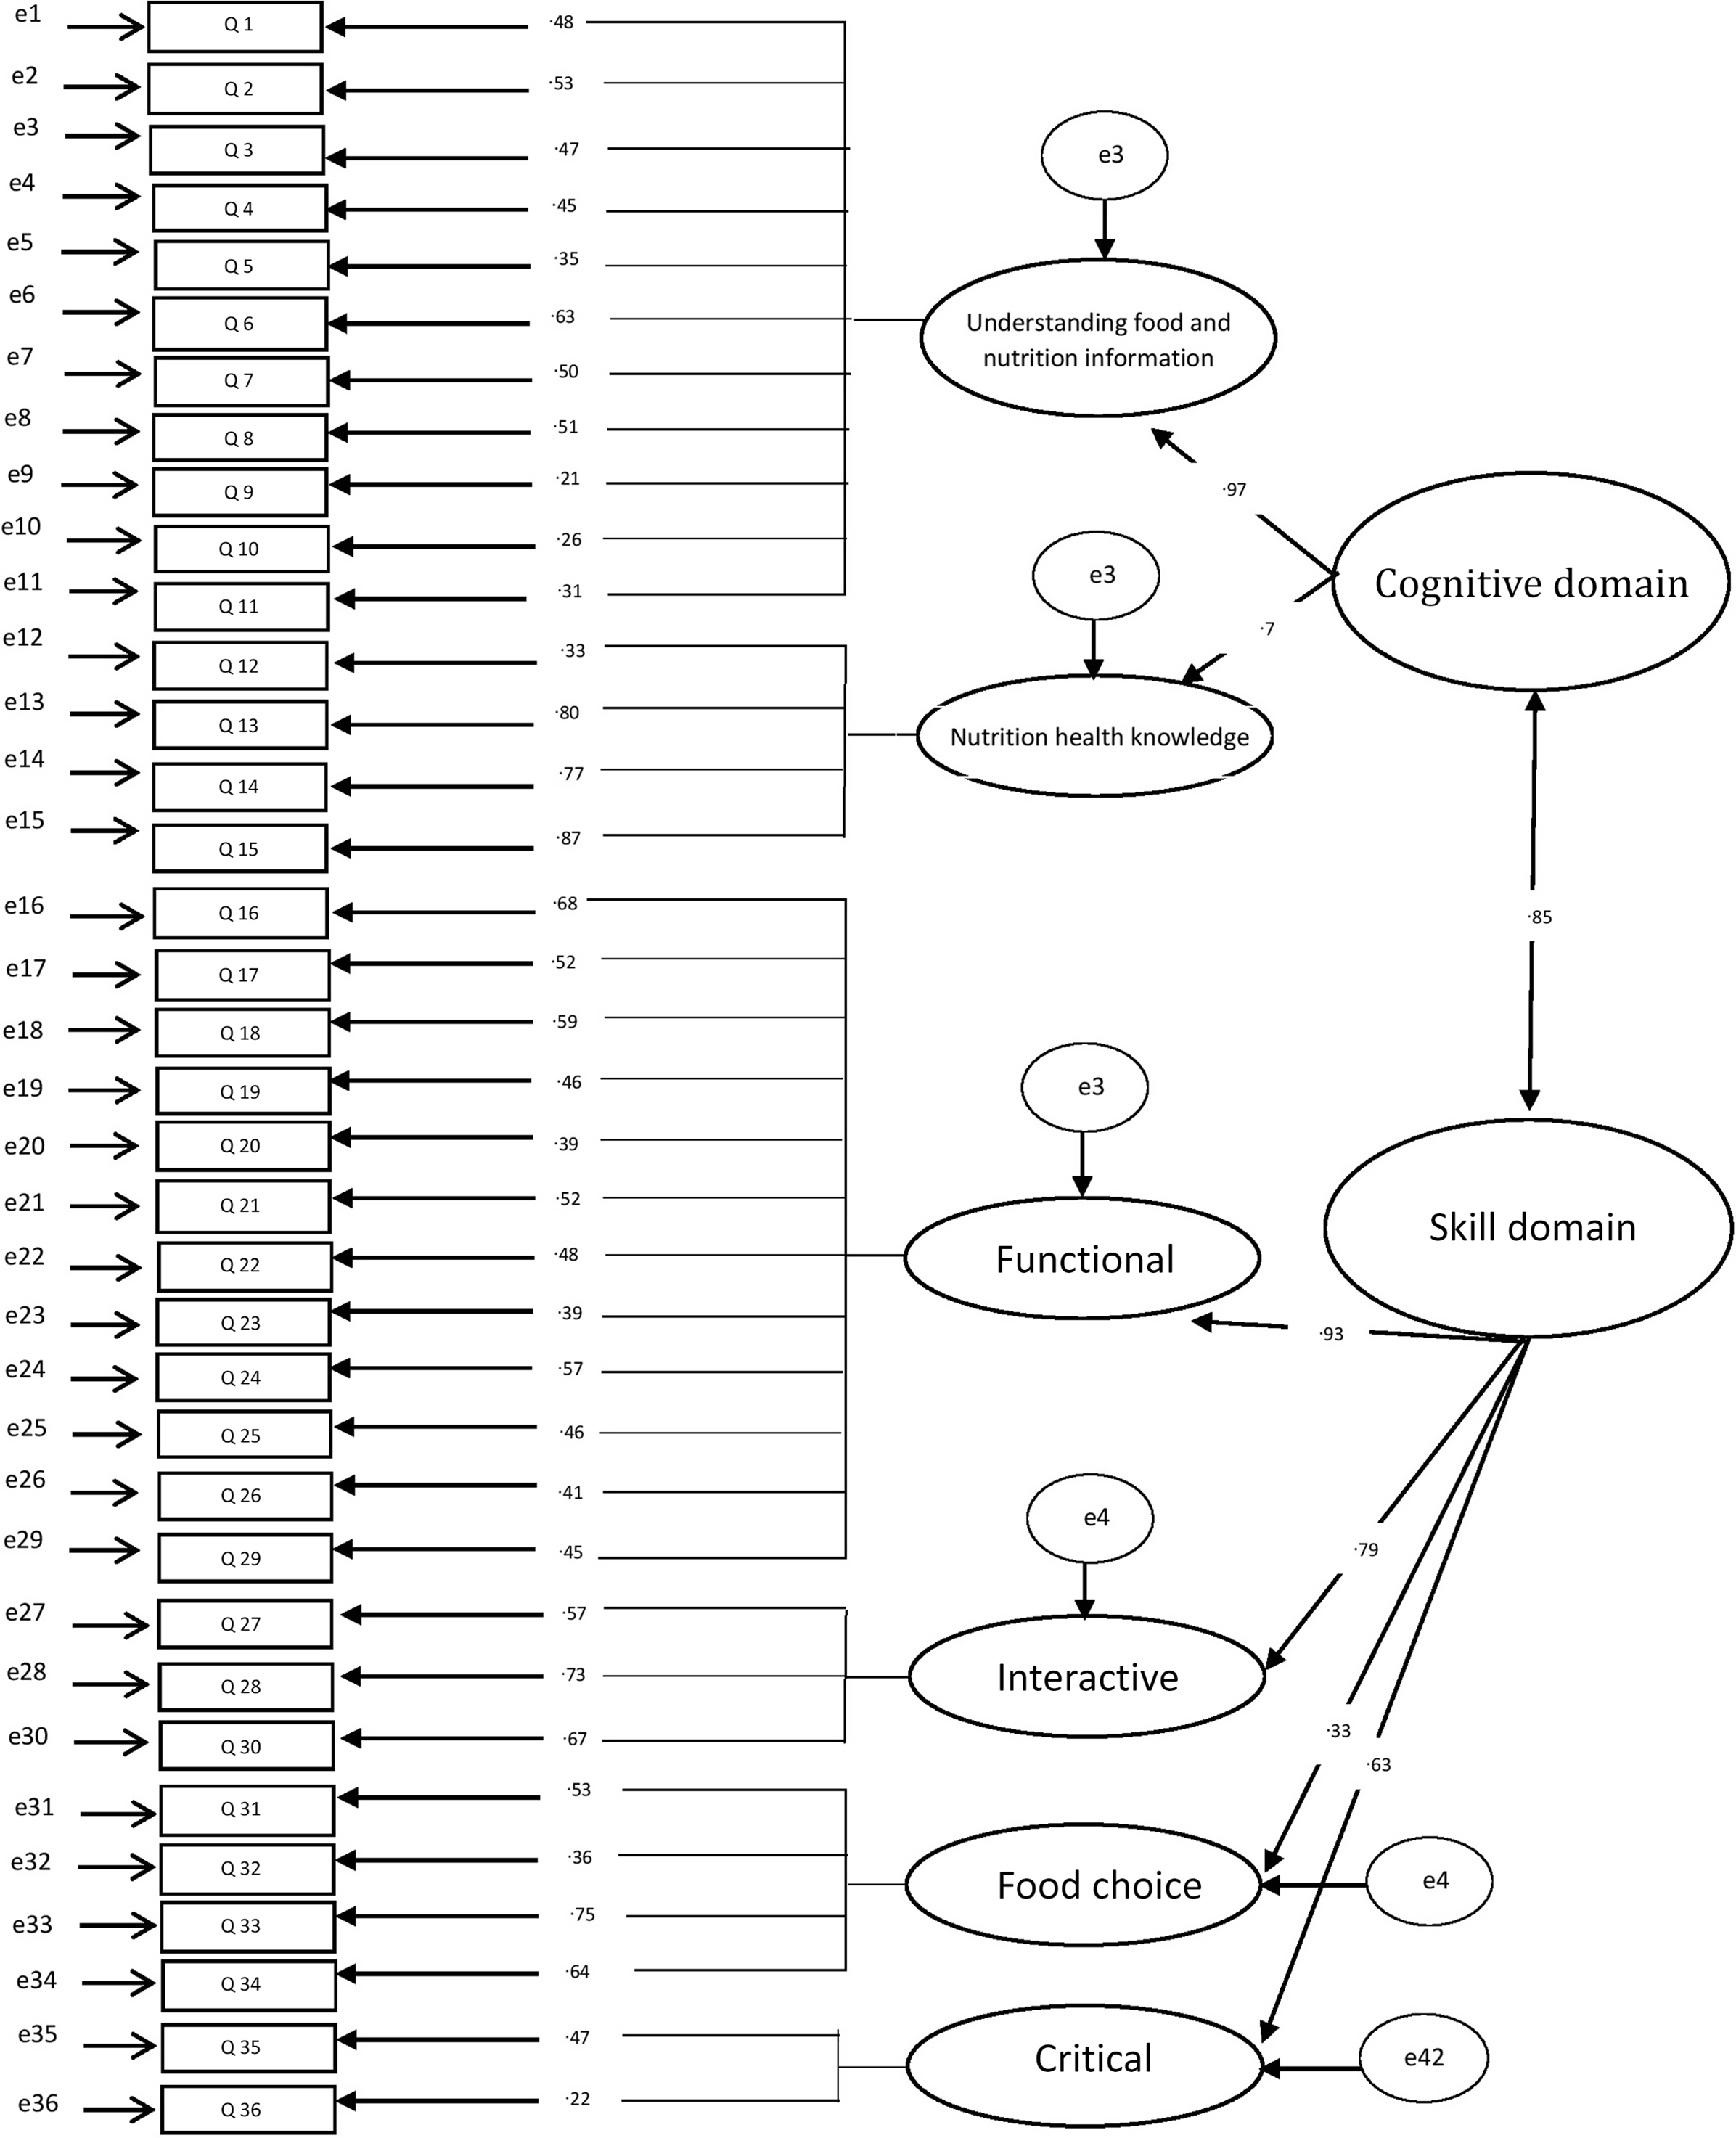
Fig. 4. Second-order confirmatory factor analysis factor loadings construct validity study for modified Food and Nutrition Literacy (M-FNLIT) scale of 9–12-year-old students in the city of Mashhad, 2018 and 2019. n 319; all factor loadings are standardised and are statistically significant, P < 0·001.
Table 2. Results of confirmatory factor analysis of modified Food and Nutrition Literacy (M-FNLIT) scale in 9–12-year-old primary schoolchildren in city of Mashhad, 2018 and 2019

GFI, goodness-of-fit index; AGFI, adjusted goodness-of-fit index; CFI, comparative fit index; RMSEA, root mean square error of approximation.
Phase 3) reliability assessment
The Cronbach’s α coefficients and ICC were calculated for total M-FNLIT and each of the subscales (Table 3). Cronbach’s α showed a proper internal correlation for the total scale (0·88) and ranged between 0·22 and 0·80 for various domains. KR-20 reliability index for the true v. false responses of food label literacy was also acceptable (0·71). Since removing any items did not change the total values of internal consistency substantially, all items were kept.
Table 3. Results of internal consistency and test–retest reliability of modified Food and Nutrition Literacy (M-FNLIT) scale in 9–12-year-old primary schoolchildren in the city of Mashhad, 2018 and 2019

* P < 0·001.
For test–retest reliability, Kappa coefficients for each pair of dichotomous responses (items 37–40) were at acceptable levels of 0·95, 0·96, 0·88 and 0·73, respectively. The ICC (0·95) indicated that the M-FNLIT questionnaire had excellent reproducibility (ICC above 0·8).
Phase 4) the scoring
According to ROC curve analysis, the AUC for low and high cut-off of the total score of M-FNLIT were 0·89 (CI 95 %: 0·79, 0·96) and 0·75 (CI 95 %: 0·63, 0·85), respectively, which were considered to be moderately predictive (Fig. 5 and 6). Results of ROC analyses for high and low cut-offs of the M-FNLIT questionnaire are presented in Table 4. ROC analysis indicated a cut-point of ≥ 81 for differentiating respondents with a high level of FNLIT v. low level of FNLIT (< 81). It also indicated a cut-point of ≤ 58 for differentiating respondents with the low level of FNLIT v. the high level of FNLIT (> 58). Based on the analysis, participants were ranked into three categories of low (≤ 58), moderate (> 58–< 81) and high (≥ 81) FNLIT.

Fig. 5. High cut-off receiver operating characteristic (ROC) curves of modified Food and Nutrition Literacy (M-FNLIT) scale of 9–12-year-old students in the city of Mashhad, 2018 and 2019.

Fig. 6. Low cut-off receiver operating characteristic (ROC) curves of modified Food and Nutrition Literacy (M-FNLIT) scale of 9–12-year-old students in the city of Mashhad, 2018 and 2019.
Table 4. Results of receiver operating characteristic (ROC) analyses for the high cut-off and low cut-off of the modified Food and Nutrition Literacy (M-FNLIT) scale in 9–12-year-old primary schoolchildren in the city of Mashhad, 2018 and 2019

AUC, area under the curve.
* Cut-off score with the highest Youden’s Index value.
Discussion
Results of the study confirm that the M-FNLIT questionnaire has a good level of validity and reliability for measuring food and nutrition literacy in primary school children in Mashhad. This study is one of the first attempts to assess the psychometric properties of the FNLIT questionnaire in children. Most of the previous studies have focused on nutritional knowledge in adults(Reference Diamond27,Reference Weiss, Mays and Martz28) . Also, a limited number of studies have addressed only nutritional literacy or food literacy among children(Reference Amin, Lehnerd and Cash29,Reference Ndahura30) or have emphasised certain aspects of food literacy such as preparation skills and food labelling(Reference Reynolds, Treu and Njike31,Reference Kennedy, Kichler and Seabrook32) . Therefore, providing multi-dimensional tools that represent a wide range of items to assess individual, interpersonal and social factors relating to children’s food and nutrition literacy seems necessary. This study aimed to modify the previously developed FNLIT questionnaire(Reference Doustmohammadian, Omidvar and Keshavarz-Mohammadi12) and then validated it among upper primary school children in Mashhad.
The content validity of this questionnaire was determined by both qualitative and quantitative methods. Some specific items in the original FNLIT questionnaire were merely familiar to children in the area of origin; hence, during the qualitative content validity, the panelists were asked to evaluate them from a socio-cultural as well as age appropriateness points of view. In the quantitative content validity, twenty experts from different geographic locations were invited to maximise the generalisability of the study and ensure if the items adapted to the social context of children, as well. There is no agreement on the number of experts or any criteria that indicate the correct number of panelists; however, the number of experts necessary for evaluation of content validity has been recommended from 2 to 20(Reference Grant and Davis33). It is worthy of note that increasing the number of the knowledgeable experts in relevant disciplines who participate in the panel could reduce the impact of personal views and leads to more realistic and unbiased results. After two rounds of Delphi in the current study, a satisfactory level of Content Validity Ratio was found among seventeen participants (CVI 1:0·72, Content Validity Ratio 2:0·87). In a similar study in the USA, the Content Validity Ratio values were 0·4 and 0·7 in the first and second round of Delphi which was held with sixteen and thirteen experts, respectively(Reference Amin, Lehnerd and Cash29).
Qualitative face validity in the current study helped further revision of the questionnaire more than a pure assessment of psychometric properties, which resulted in alteration of length, font size, formatting and ease of reading. This approach helped to ensure that the under study population comprehended what was being asked and were familiar with the terminology and the subject of the questionnaire. CFA by using the maximum likelihood method was applied to assess whether all items of the M-FNLIT questionnaire were matched to the theoretical frameworks. The results of CFA showed that all model fit indices had acceptable values for the first-order models of cognitive and skill domains of the M-FNLIT questionnaire. Therefore, the two-factor structure of cognitive domain and four-factor structure of skills domains were confirmed. However, in the second-order model, the GFI was lower than the acceptable cut-point (GFI: 0·87). This finding was consistent with the result of Doustmohammadian et al., which also reported that the GFA index was lower than the standard value in both first- and second-order models of the FNLIT questionnaire (GFI: 0·83)(Reference Doustmohammadian, Omidvar and Keshavarz-Mohammadi12). It should be noted that the GFI index is influenced by external factors such as sample size, the number of parameters and the degree of freedom to sample size(Reference Marsh, Balla and McDonald34). The degree of freedom was more than the sample size in our study; thus, to minimise the effects of external factors, the result of adjusted goodness of fit index was also represented(Reference Hoyle35). Regarding the acceptable results of other model fitness indices, particularly the ones that were considered the main factors in structural equation modelling (sem) analysis such as root mean square error of approximation and relative χ 2, the structural validity of the six-factor model of the M-FNLIT questionnaire was confirmed.
The overall M-FNLIT questionnaire and all of the subscales demonstrated satisfying test–retest reliability and their internal consistency reliabilities met the acceptable value of 0·70, except for the critical skill subscale. Similarly, in previous studies, the internal consistency value of Critical food Literacy was reported lower than the standard value(Reference Doustmohammadian, Omidvar and Keshavarz-Mohammadi12,Reference Ndahura30) . However, the internal consistency reliability values depend on the number of items in the questionnaire and since the critical skill subscale consisted of two items, this could have resulted in lower internal consistency values in our study(Reference Abdelmoula, Chakroun and Akrout36).
The time interval between the two tests in test–retest should be selected in a way that not only the instrument phrases are forgotten but also no change occurs in the phenomenon-being measured(Reference Fox37). Evidence recommended taking a period of 1–4 weeks to examine test–retest reliability of items(Reference Nancy and Grove38,Reference Kurpius and Stafford39) . Therefore, the time interval of 4 weeks was chosen to minimise a ‘learned’ response to the questions of the questionnaire. The high ICC scores, which implied excellent reliability, showed that the tool would produce repeated food skill domain measurements that would be consistent for a given individual.
While there is no gold standard to assess food and nutrition literacy among children, the Healthy Eating Index was used to determine the cut-off points of M-FNLIT. Previous studies demonstrated that the index reflected the quality of diet and was positively correlated with the risk reduction of NCD(Reference McCullough, Feskanich and Rimm40). In fact, it can evaluate the adherence to the dietary guidelines and considered the most appropriate indicator to identify the categorisation of food literacy and nutritional scales(Reference T KENNEDY, Ohls and Carlson41).
The results of ROC analysis revealed three levels of low, moderate and high food and nutrition literacy whose scores were almost higher than those of the previous version of the FNLIT questionnaire(Reference Doustmohammadian, Keshavarz Mohammadi and Omidvar14). Considerable attempts were done to make the questionnaire more convenient for self-administering; therefore, the higher levels of cut-points are not surprising.
Children in fourth grade were included in the validation phase of M-FNLIT for the first time as it was evident from the previous studies that children who are nine years old are cognitively able to participate in studies related to health and can fill in self-administered questionnaires(Reference Amin, Lehnerd and Cash29,Reference Riley42) . The study focused on children in grades 4–6 because this age group would be considered as a crucial stage for changes in food and nutrition literacy, including food-related behaviours and skills. Also, narrowing the age group ascertained that the M-FNLIT was developmentally appropriate.
The main strength of this study was the modification and evaluation of a food and nutrition literacy questionnaire with a holistic approach. Although the current questionnaire has been developed in Iran, its modification for usage in other parts of the country with different socio-economic status and cultural backgrounds is highly recommended. However, the study had some limitations. First, the validation study of M-FNLIT was performed in only one city of Iran. To validate the questionnaire, further investigations in the whole country are needed. Second, due to the lack of gold standard assessing food and nutrition literacy among children, we were unable to conduct criterion validity. Third, we used the self-report method that may influence the validity of the study, and it is possible that the respondents overestimate or underestimate their food consumption and overstate their nutrition literacy. Although recall bias and social desirability bias are in the nature of the dietary recall method, to minimise such errors we used visual aids and common household measures. Both Persian and English versions of the questionnaire are available (Supplementary materials).
Conclusions
The results suggested an acceptable validity and reliability of the M-FNLIT questionnaire to measure food and nutrition literacy in upper primary school children in Mashhad. It can be used to evaluate educational interventions in similar settings and age groups.
Acknowledgements
We would like to express our special thanks of gratitude to Mashhad University of Medical Sciences and who financially supported the implementation of this applied study. Special thanks to all coordinators, interviewers and all the students participated in this study.
Conceptualisation, methodology, investigation, project administration and funding acquisition, F. K., M. K. R., A. D., M. A. and M. K.; formal analysis, F. K., M. K. R.; investigation, F. K., S. P., M. S. F; data curation, F. K.; writing – original draft preparation, F. K.; writing – review and editing, A. D., M. A. and M. K.; visualisation, M. S. F.; supervision, M. K. and A. D. and all authors have read and agreed to the published version of the manuscript.
The authors declare no conflict of interest.
Supplementary material
For supplementary materials referred to in this article, please visit https://doi.org/10.1017/S0007114521001586


