


Phytosterols are the plant equivalents of cholesterol and have similar functions in plants as cholesterol has in animals, providing rigidity to cell membranes and being precursors of hormones( Reference Piironen, Lindsay and Miettinen 1 ). Phytosterols are only synthesised in plants, and thus the content of phytosterols in animals comes solely from food via intestinal absorption( Reference Piironen, Lindsay and Miettinen 1 ) or, in the case of aquatic organisms, also from the water, if present there( Reference Gilman, Leusch and Carl Breckenridge 2 ). The use of vegetable oils in feeds for farmed Atlantic salmon (Salmo salar) has increased in recent years, whereas the use of fish oil has decreased. This has caused a range of changes in the salmon feeds, including decreased cholesterol levels and increased content of phytosterols. Different vegetable oils are highly variable in the amount and composition of phytosterols, with particularly high levels in maize oil and rapeseed oil( Reference Gordon and Miller 3 ). Rapeseed oil is the most commonly used vegetable oil in Norwegian salmon feeds( Reference Ytrestøyl, Aas and Åsgård 4 ). There is limited knowledge on how phytosterols may affect the fish, including effects on cholesterol absorption and homoeostasis, and how they are absorbed, excreted or deposited in the fish( Reference Miller, Nichols and Carter 5 , Reference Liland, Espe and Rosenlund 6 ). Phytosterols are well known for lowering plasma cholesterol in humans, and ingesting 2 g of phytosterols/d is shown to lower LDL-cholesterol by approximately 10 %( Reference Katan, Grundy and Jones 7 , Reference Patel and Thompson 8 ).
While the phytosterols are structurally similar to cholesterol, they behave differently in the body. Compared with cholesterol, phytosterols exhibit both poorer absorption from the intestine and faster secretion from the liver; whereas cholesterol absorption in healthy humans is >40 %, phytosterol absorption is <5 %( Reference Ling and Jones 9 ). The intestinal absorption of phytosterols decreased with increasing number of side-chain C atoms at the 24-C position on the sterol chain moiety and with the saturation of the sterol( Reference Ling and Jones 9 ). Phytosterols may also interfere with micellar solubilisation of cholesterol in the intestine and hence reduce its absorption( Reference Field, Born and Mathur 10 , Reference Mel’nikov, Seijen ten Hoorn and Eijkelenboom 11 ), although this may not account for the entire effect. Furthermore, there have been suggestions that phytosterols and stanols may regulate sterol transporters, such as ATP-binding cassette transporter 1 (ABCA1) and ATP-binding cassette subfamily G members 5 and 8 (ABCG5/G8) in the intestine. However, studies conducted with mice deficient in these transporters have shown that this is not the case, and the discussion regarding the exact molecular mechanism behind the reduction in intestinal cholesterol absorption by phytosterols continues( Reference Calpe-Berdiel, Escolà-Gil and Blanco-Vaca 12 ).
The effects of individual phytosterols have not been well studied, as they are mostly provided together in clinical trials( Reference Ostlund and Lin 13 ). However, it is clear that different phytosterols are absorbed to different extents; in rats there was 13 % absorption of campesterol, approximately 4 % absorption of β-sitosterol and stigmasterol and only 1–2 % of β-sitostanol and campestanol( Reference Sanders, Minter and Howes 14 ). Phytosterol accumulation was also variable between different tissues, with the highest amounts retained in the adrenal glands, ovaries and intestinal epithelia( Reference Sanders, Minter and Howes 14 ). This corresponds well with a higher apparent digestibility and accumulation of campesterol than β-sitosterol in Altantic salmon( Reference Miller, Nichols and Carter 5 ). In macrophage foam cells, stigmasterol increased the expression of ABCA1 and ABCG1, whereas campesterol and β-sitosterol had no effect( Reference Sabeva, McPhaul and Li 15 ), demonstrating distinct biological activities of the individual phytosterols.
As most research on phytosterols has been conducted in mammals with a constant body temperature, it is unclear how temperature may affect factors such as phytosterol absorption, interference with cholesterol absorption and tissue retention/distribution. The rearing temperature of Atlantic salmon greatly affects both the general rate of metabolism and lipid digestion and transport in particular( Reference Bendiksen, Berg and Jobling 16 , Reference Ruyter, Moya-Falcòn and Rosenlund 17 ). Furthermore, cholesterol uptake was shown to be temperature dependent in an in vitro human intestine model( Reference Sviridov, Safonova and Nano 18 ). Cholesterol has an important role in thermal adaptation in ectotherm animals, as incorporation of cholesterol in biological membranes affects membrane order and fluidity, stabilising membranes at high temperature( Reference Crockett 19 ), which may lead to differences in tissue sterol incorporation at different temperatures.
The aim of the present work was to investigate how the dietary sterol composition, including cholesterol, phytosterol:cholesterol ratio and phytosterols, affects the absorption, biliary excretion, retention and tissue storage and distribution of cholesterol and individual phytosterols in Atlantic salmon reared at two different temperatures.
Methods
Feeds and feeding trial
In total, nine fish diets were made, all containing the same basal ingredients, and only differing in the addition of cholesterol (Cholesterol SF; Dishman Netherlands B.V.) or a phytosterol mix (CardioAid Plant Sterols; ADM). This gave a range of different cholesterol and phytosterol feed concentrations, as well as varying phytosterol:cholesterol ratios (Table 1). The diets were named according to their added level of phytosterols and cholesterol – for example diet 1000/0 has 1000 mg/kg added phytosterols and no added cholesterol (actual sterol content was higher owing to the contribution from the basal feed ingredients). In addition to the proximate composition and analysed sterol content given in Table 1, further details on diet formulation and composition are published elsewhere( Reference Sissener, Liland and Holen 20 ).
Table 1 Analysed feed composition, including proximate composition and sterols (also previously published( Reference Sissener, Liland and Holen 20 ))
The feeding trial was carried out at Skretting ARC Research Station Lerang (Stavanger, Norway), and was conducted according to the guidelines of the Norwegian State Commission for Laboratory Animals. After 2 weeks of acclimatisation, Atlantic salmon (Salmobreed from Erfjord Stamfisk) with an initial body weight of 250 g (sd 29) was reared in 1-m circular tanks supplied with flow through seawater at 12 or 6°C and exposed to 24-h light. Each tank was stocked with thirty-two fish, and the trial lasted 16 weeks at 12°C and 23 weeks at 6°C, respectively, to allow the fish to reach similar final body weights of approximately 900 g. Each of the nine experimental diets were fed to triplicate tanks at 12°C and to duplicate tanks at 6°C using automatic feeders (Hølland Teknologi AS). Feed was given in slight excess during three meals per day (07.30–09.30; 12.00–14.00; 20.00–22.00 hours) and surplus feed was collected daily to determine feed intake. Standard husbandry routines at the station were followed.
Sampling
At the final samplings at both temperatures, feeding was stopped 24 h before sampling for each tank. The fish were anaesthetised with tricaine methanesulfonate (Tricaine Pharmaq) at a concentration of 40 mg/l and killed by a blow to the head. Homogenised pooled samples were made from fillet (Norwegian quality cut) of six fish per tank and whole fish of another six fish per tank. Blood was collected using vacutainers from six fish per tank, and centrifuged at 3000 g for 7 min to obtain the plasma fraction, which was frozen on dry ice and stored at −80°C. Mid-intestinal samples for RNA extraction were flash-frozen in liquid N2 (individual samples, six fish per tank), whereas mid-intestine samples for sterol analyses were frozen on dry ice (pooled samples, six fish per tank) and all samples were stored at −80°C. Before the intestinal samples were frozen, they were opened longitudinally and flushed with PBS to remove intestinal content. Pooled samples of liver and adipose tissue were also collected and frozen on dry ice (pooled samples, six fish per tank), whereas bile was collected from the gall bladder with a syringe and two aliquots of pooled samples were made (six fish per tank).
Analyses of sterol content
Analyses of phytosterol and cholesterol content in feed, mid-intestine, liver, bile, fillet, visceral adipose tissue and whole fish samples were performed as described by Laakso( Reference Laakso 21 ). The internal standard, 5-β-cholestan-3-α-ol, dissolved in isopropanol to 0·6 mg/ml, was added to the samples before saponification. The samples were directly saponified without prior lipid extraction in 2·5 ml of 2 m KOH solution in an ultrasonic bath for an hour at 65–75°C. After samples were chilled to room temperature, 2 ml of water and 3 ml of hexane were added and samples centrifuged for 1 min at 3000 rpm. Then, the hexane phase was collected and the extraction process repeated with 3 ml of hexane. The extract was dried on a heat block (maximum 70°C) with N2 flow and then derivatised to trimetylsilyl ether of sterols by adding 100 µl of pyridine and 200 µl of silylation reagent (bis[trimethylsilyl]-trifluoroacetamide with 1 % trimethylchlorosilane) and warmed on a heat block at 70°C for 15 min. The samples were diluted 20× in hexane before analysis on a GC. The following instrumentation was used: Thermoquest trace GC 2000 with an autosampler AS2000 (Thermo Finnigan Quest), on-column injector, flame ionisation detector and the column Equity-5 WCOT 30 m×0·25 mm i.d. (Supelco). Helium was used as a carrier gas at 0·9 ml/min; hydrogen and air were used as detector gases at 35 and 350 ml/min, respectively. Temperature started at 100°C, increased by 50°C/min to 300°C and was kept for 12 min. The peaks were identified with the software Chromeleon® version 6.8. Phytosterol-enriched margarine of the brand vita pro-aktiv (Mills DA) was used as control material.
Plasma cholesterol was analysed using a clinical bioanalyzer (Maxmat PL analyzer) according to standardised procedures, reagents and controls. Osmolarity was analysed in bile by measuring the freezing point with Fiske One Ten Osmometer (Fiske Associated).
Gene expression
Total RNA was extracted from intestinal tissue using the EZ1 RNA universal tissue kit (Qiagen) according to the manufacturer’s instructions. Quantity and quality of the RNA were assessed by spectrophotometry and the Agilent 2100 Bioanalyzer (Agilent Technologies) as described previously( Reference Sissener, Hemre and Lall 22 ). RNA integrity number (RIN) was tested for a subset of samples that all had RIN values >9. A two-step PCR was conducted on the target genes acetyl-CoA acetyltransferase 2 (ACAT2), Niemann-Pick C1-like 1 protein (NCP1L1), ABCG5 and ABCA1 and reference genes β-actin, elongations factor 1α (EF1α) and acidic ribosomal phosphoprotein (ARP). RT was performed on a GeneAmp PCR 9700 (Applied Biosystems) using the TaqMan® reverse transcriptase kit with oligo(dT) primers (Applied Biosystems). Samples were run in duplicate (500 ng, ±5 %), in addition to a six-point dilution curve in triplicate (1000 to 31·25 ng), non-template and non-amplification controls. Real-time PCR amplification and analysis were performed on a LightCycler 480 Real-time PCR system (Roche Applied Science) with SYBR® Green I Mastermix (Roche Applied Science). Pipetting of plates was done using a Biomek® 3000 Laboratory automation workstation (Beckman Coulter, Fullerton). Thermal cycling was done for forty-five cycles of 10 s at each of 95, 60 and 72°C, followed by melting curve analysis to confirm that only one product was present. Cycle threshold (C t ) values were calculated using the second maximum derivative method in the Lightcycler® software. Amplification efficiency was determined using the dilution curves with the formula E=10(−1/slope), with the slope of the linear curve of C t -values plotted against the log-dilution( Reference Higuchi, Fockler and Dollinger 23 ). Inter-plate calibration was done according to TATAA (http://www.eppendorf.com/content/1/1/img/20071004_London.pdf). The stability of the expression of each reference gene was calculated from the C t values using the program geNorm( Reference Vandesompele, De Preter and Pattyn 24 ) according to the geNorm manual.
Calculations, data treatment and statistical analyses
The retention (which in the case of cholesterol also will include de novo production and hence might give ‘retention’ values>100 % if there is a net production of cholesterol in the fish) of individual sterols was calculated according to this formula: nutrient retention=((final biomass×final nutrient content)−(initial biomass×initial nutrient content))×100/(total feed intake×nutrient content in feed). Linear regression analyses based on feed content of phytosterols, cholesterol and the phytosterol:cholesterol ratio were conducted in GraphPad Prism 6.0 (Graphpad Software Inc.). One-way ANOVA followed by Tukey’s post hoc test of sterol ratios was performed in Statistica (version 13.1, Statsoft). Tissue sterol composition at the two temperatures were compared by two-sided t test. Statistical analyses of the data from quantitative PCR were performed using the free software environment R( 25 ). Differences between the dietary groups were detected by nested one-way ANOVA (random effect factor: tank) and Tukey’s post hoc test using the packages nlme ( Reference Pinheiro, Bates and DebRoy 26 ) and multcomp ( Reference Hothorn, Bretz and Westfall 27 ), or Kruskal–Wallis when the assumptions of ANOVA were not met. P-values<0·05 are regarded as statistically significant.
Results
Sterol composition in diets
The proximate composition and sterol composition of the diets have already been published( Reference Sissener, Liland and Holen 20 ), but were also included here (Table 1) for a better understanding of the presented results. In the nine experimental diets, the phytosterol concentrations ranged from 1353 to 3147 mg/kg feed, cholesterol from 867 to 3153 mg/kg feed and phytosterol:cholesterol ratio from 0·7 to 3·2.
Tissue sterol composition
Sterol concentrations and composition varied between tissues (Table 2). Cholesterol levels were highest in the liver and mid-intestine, followed by adipose tissue, whole body, muscle and finally bile. While phytosterols constituted 2·0–6·6 % of total sterols in other tissues, they constituted 36·7–46·5 % in the bile (mean values at the two different temperatures). Mid-intestine and adipose tissue had a slightly higher proportion phytosterols of total sterols (5·0–6·6 %) compared with liver and muscle (2·0–3·1 %).
Table 2 Tissue sterol composition in Atlantic salmonFootnote * (Mean values and standard deviations)
Phyto, phytosterol; chol, cholesterol.
* Cholesterol and total phytosterol content are given as mg/kg, phytosterols in percentage of total sterols and individual phytosterols in percentage of total phytosterols. All diet groups are combined, stigmasta-dienol, stigmast-enol and day-7-avenasterol were not included in the table as individual phytosterols, as they were not detected in some tissues and when detected numbers were low and the standards deviations were generally larger than the mean values, but these are included in the ‘sum phytosterols’. Statistical differences between the two temperatures are given in the main text.
There were some temperature effects on tissue sterol composition (Table 2). In the mid-intestine, the total amount of both cholesterol and phytosterols was similar, but there were significant differences in the proportions of the individual phytosterols, with a higher proportion of brassicasterol (P=0·0003) and sitostanol (P<0·0001) at 12°C, but lower campesterol (P=0·03). In the liver, both cholesterol and phytosterol concentrations were lower at 12°C (both P<0·0001). The phytosterol distribution also differed with temperature, with a higher proportion brassicasterol at 12°C (P<0·0001), whereas the proportions of campestanol (P=0·007), stigmasterol (P=0·01) and β-sitosterol (P=0·03) were lower. In the bile, there were significantly less phytosterols at 12°C (P<0·0001), but the proportion of brassicasterol (P<0·0001) and sitostanol was higher (P=0·0005). In adipose tissue, the cholesterol concentration was significantly higher at 12°C (P<0·0001). Furthermore, phytosterols were similar; there was a higher proportion of brassicasterol and stigmasterol (both P<0·0001), whereas campestanol and β-sitosterol were lower (both P<0·0001). In muscle, cholesterol concentration was significantly lower at 12°C (P=0·0002). Total phytosterols were once again similar, but with a higher proportion of brassicasterol (P<0·0001) and lower campesterol (P=0·0004) and β-sitosterol (P<0·0001) at 12°C. In whole fish, only the distribution of individual phytosterols differed between the two temperatures, with higher brassicasterol (P<0·0001) and lower campesterol (P=0·0001), campestanol (P=0·03), stigmasterol (P=0·02) and sitostanol (P<0·0001) at 12°C.
Plasma cholesterol correlated positively with dietary cholesterol both at 6 and 12°C, both 24 and 48 h after the last feeding (Fig. 1). There were also significant negative correlations to the dietary phytosterol:cholesterol ratio (data not shown). At 6°C, this correlation was equally strong as for dietary cholesterol after 24 h, but stronger after 48 h (R 2 0·48), whereas the correlation to the ratio was poorer at 12°C (R 2 0·15 and 0·24 at the two time points after feeding) (data not shown). Generally, tissue cholesterol correlated to dietary cholesterol in most tissues (except mid-intestine) at 12°C, but only in bile and whole fish at 6°C. The statistical results for all significant regressions are given in the online Supplementary data, whereas cholesterol and campesterol in whole fish are shown in Fig. 2. In some instances, there were also negative correlations to the dietary phytosterol:cholesterol ratio, but these were never as strong as the correlations to dietary cholesterol by itself. Tissue campesterol content generally correlated negatively to dietary cholesterol and positively to dietary phytosterol:cholesterol ratio (with mid-intestine at 6°C as the only exception), and it varied whether the strongest correlation was to dietary cholesterol or to the ratio (Fig. 2, online Supplementary Table S1). As campesterol was the main phytosterol in most tissues, significant regressions for campesterol were generally accompanied by significant regressions for total phytosterols and for phytosterols as percentage of total sterols. Neither tissue cholesterol, campesterol nor total phytosterols correlated to dietary phytosterols by themselves in any tissue at either temperature. In the intestine, also brassicasterol, campestanol and sitostanol correlated positively to dietary phytosterol:cholesterol ratio at 12°C, whereas sitostanol correlated both to dietary cholesterol and to the ratio at the same temperature. The content of brassicasterol, stigmasterol, β-sitosterol and sitostanol in bile was also affected by dietary cholesterol and/or phytosterol:cholesterol ratio. Sitostanol content was affected by dietary cholesterol and/or phytosterol:cholesterol ratio both in muscle, adipose tissue and whole fish at 12°C, but not at 6°C. Campestanol and stigmasterol, which were both present in tissues in low concentrations, were the only sterols in which tissue concentrations correlated with dietary phytosterols in several tissues, but only at 6°C.
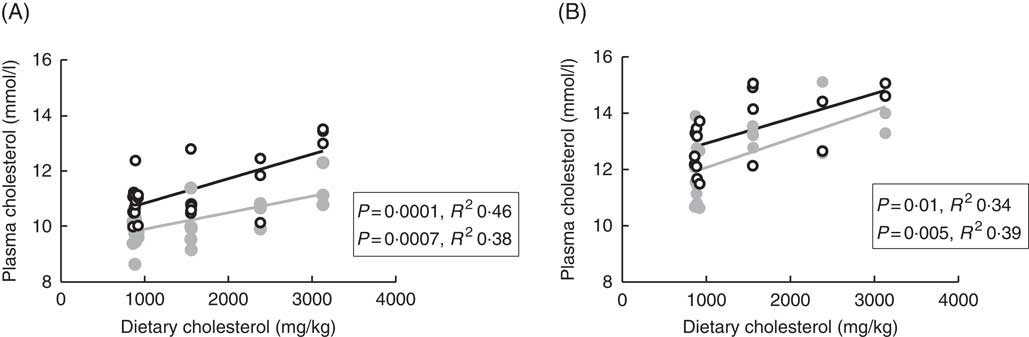
Fig. 1 Plasma cholesterol 24 (![]() ) and 48 h (
) and 48 h (![]() ) after feeding in Atlantic salmon fed different levels of dietary cholesterol at 12°C (A) and 6°C (B), respectively. Each data point represents one fish tank, based on the analysis of a pooled sample consisting of six individual fish.
) after feeding in Atlantic salmon fed different levels of dietary cholesterol at 12°C (A) and 6°C (B), respectively. Each data point represents one fish tank, based on the analysis of a pooled sample consisting of six individual fish.
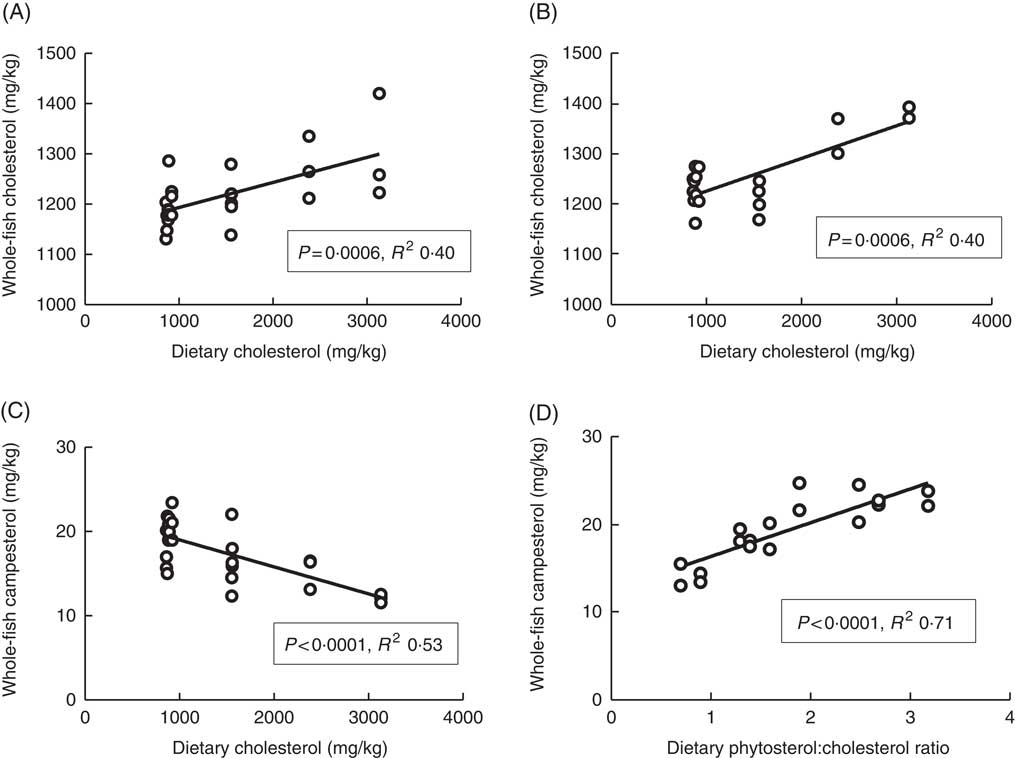
Fig. 2 Whole-fish cholesterol (A, B) and campesterol (C, D) levels in tissues of Atlantic salmon, related to dietary sterol content at 12 and 6°C, respectively. For each tissue sterol and temperature, correlations to dietary cholesterol, dietary phytosterol and dietary phytosterol:cholesterol ratio were tested, and the strongest correlation is shown in the figure (a full overview of the statistical results for all correlations are found in supplementary data). Each data point represents one fish tank, based on the analysis of one pooled sample consisting of six individual fish.
Sterol retention
Whole-body retention of cholesterol was clearly dependent on dietary cholesterol (Fig. 3), with decreasing retention as dietary levels increased. The diet with the lowest cholesterol content had retention values of 162 % (sd 9) and 176 % (sd 2) at 12 and 6°C, respectively. Furthermore, all diets containing <1000 mg/kg cholesterol (the five diets without added cholesterol) had cholesterol retention values >157 % at both temperatures. The diets with added cholesterol on the other hand (>1500 mg cholesterol/kg feed) consistently had retention values below 100 % at both temperatures, with the highest cholesterol diet giving retention values of 51 % (sd 6) and 55 % (sd 1) at 12 and 6°C, respectively. The retention of campesterol correlated negatively with both dietary cholesterol and dietary phytosterol content, but dietary cholesterol could explain more of the variation in retention values at both temperatures, with R 2 values of 0·34 and 0·54 v. 0·30 and 0·28 for dietary phytosterols at the two temperatures. Retention of brassicasterol correlated negatively with dietary phytosterol content at both temperatures (Fig. 3), but not with dietary cholesterol. For β-sitosterol and sitostanol, effects were more inconsistent, possibly related to the low retention values and hence larger variation (β-sitosterol mean 1·5 %, sd 1·9 at 12°C, sitostanol mean 1·5 %, sd 0·7 at 12°C). Sitosterol retention correlated negatively to dietary phytosterol at 12 (R 2 0·24, P=0·01), but not at 6°C (data not shown). Sitostanol retention correlated negatively to dietary cholesterol at 12°C (R 2 0·43, P=0·0003), but to dietary phytosterols at 6°C (R 2 0·45, P=0·002, data not shown). Retention levels were highly variable between the individual phytosterols, with brassicasterol>campesterol >sitostanol>β-sitosterol (Table 3). Retention of the other phytosterols present in the feed (stigmasta-dienol, stigmast-enol and d-7-avenasterol) was not calculated, owing to levels in whole fish<1 mg/kg fish for many of the samples, which were not considered to give reliable retention calculations. Retention of sum phytosterols correlated only to dietary phytosterols at 12°C (R 2 0·37, P=0·001), whereas at 6°C it correlated equally well to both dietary phytosterols and dietary cholesterol (both R 2 0·40, P=0·005). Retention values were mainly similar at the two temperatures, with the exception of brassicasterol, which had a 2-fold-higher retention at 12°C compared with 6°C (Fig. 3, Table 3). The phytosterol:cholesterol ratio did not explain more of the variation than phytosterols or cholesterol alone for any of the retention data.
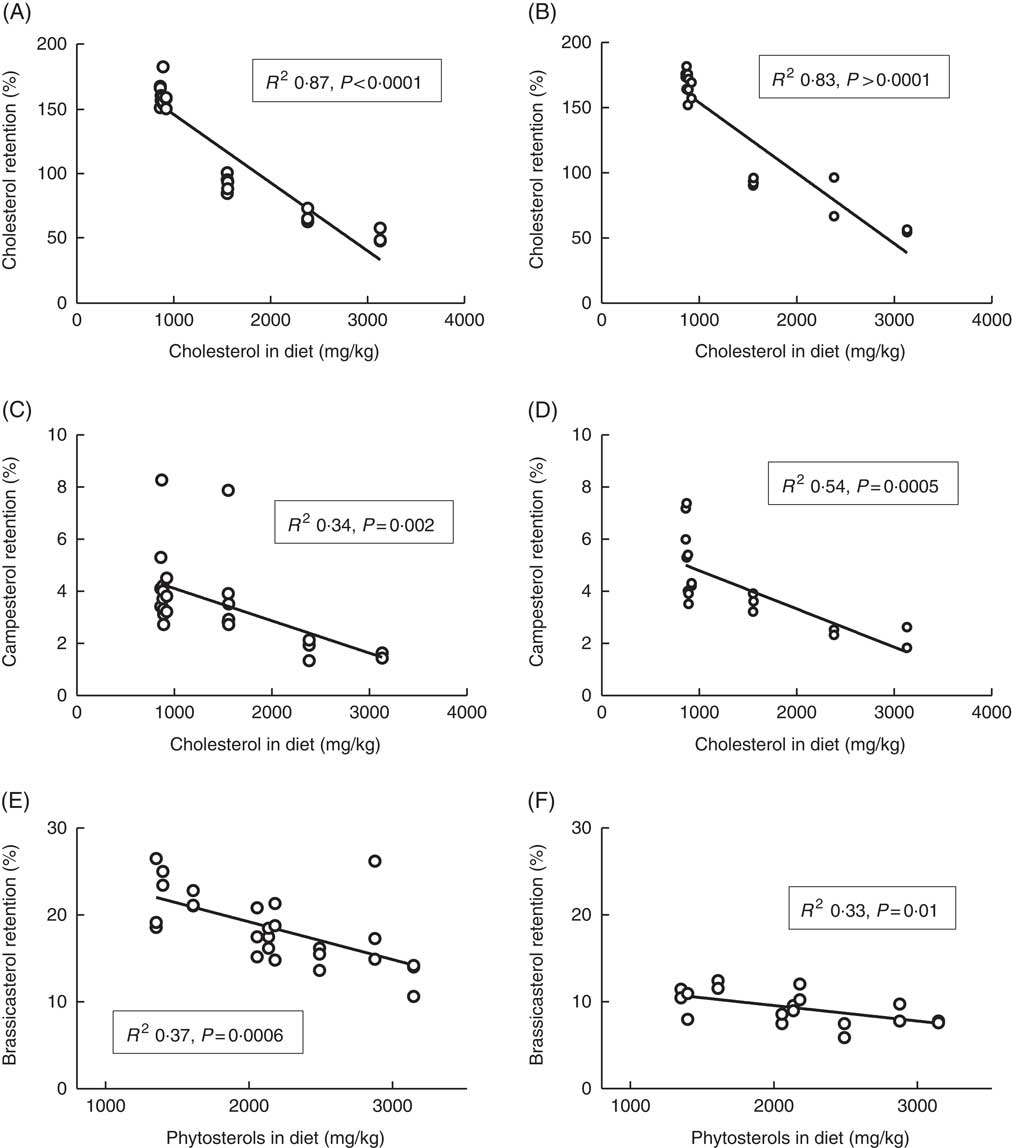
Fig. 3 Retention of cholesterol (A, B), campesterol (C, D) and brassicasterol (E, F) in the whole body of Atlantic salmon during the whole feeding trial, related to dietary sterol content at 12 and 6°C, respectively. For each tissue sterol and temperature, correlations to dietary cholesterol, dietary phytosterol and dietary phytosterol:cholesterol ratio were tested, and the strongest correlation is shown in the figure. Retention was calculated as follows: nutrient retention=((final biomass×final nutrient content)−(initial biomass×initial nutrient content))×100/(total feed intake×nutrient content in feed). Each data point represents one fish tank, based on the analysis of a pooled sample consisting of six individual fish.
Table 3 Mean sterol retention (%) across all diet groups at 12 and 6°C, respectivelyFootnote * (Mean values and standard deviations)
Phyto, phytosterol.
* The large standard deviations for some sterols are owing to a large effect of the different diets; see Fig. 3.
Tissue ratios
The ratio of cholesterol content in the mid-intestine to cholesterol in the feed, which says something about intestinal absorption, was approximately 2·5 at both temperatures, whereas the ratios for the different phytosterols ranged from 0·03 to 0·22 (Fig. 4). There were also significant differences between the individual phytosterols at both temperatures, with the highest ratio for campesterol, followed by brassicasterol, whereas campestanol, stigmastanol, β-sitosterol and sitostanol were similarly low (Fig. 4). The ratio of sterol content in bile to sterol content in liver, which says something about biliary excretion, was much higher for campesterol, β-sitosterol and sitostanol, compared with the other sterols (Fig. 5). Regarding the ratio between sterol content in adipose tissue to liver, which says something about the extent to which sterols are transported to and stored in this tissue, the ratio was highest for brassicasterol at both temperatures, but more so at 12°C, whereas stigmasterol had a higher ratio at 12°C but not at 6°C (Fig. 5).
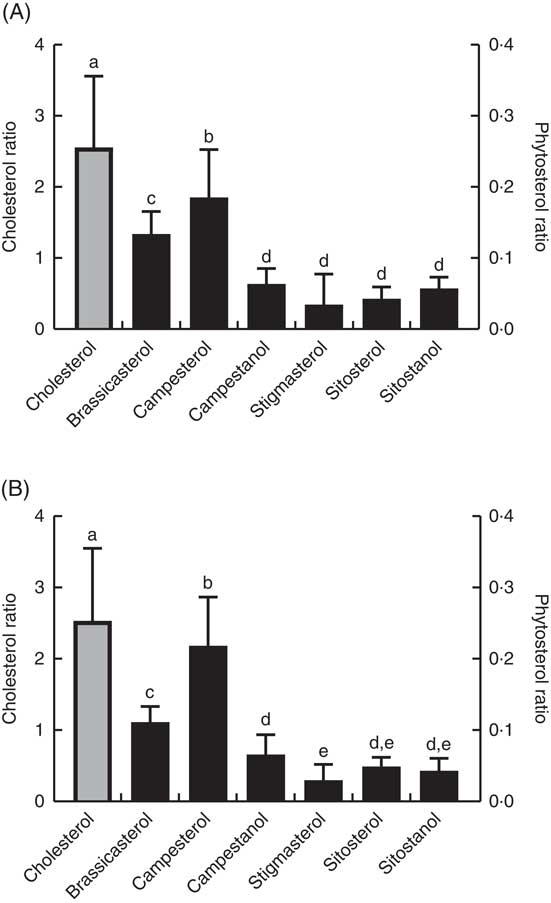
Fig. 4 The ratio of individual sterol content in the mid-intestine to the content in the feed at 12°C (A) and 6°C (B), which can give an indication about differences in absorption between the different sterols (although cholesterol will also be present as part of the cell membranes). Please note the 10-fold difference in scale of the cholesterol data (left-hand scale, ![]() ) compared with the phytosterol data (right-hand scale,
) compared with the phytosterol data (right-hand scale, ![]() ). All diet groups are combined. a–e Values with unlike letters were significantly different (P<0·05).
). All diet groups are combined. a–e Values with unlike letters were significantly different (P<0·05).
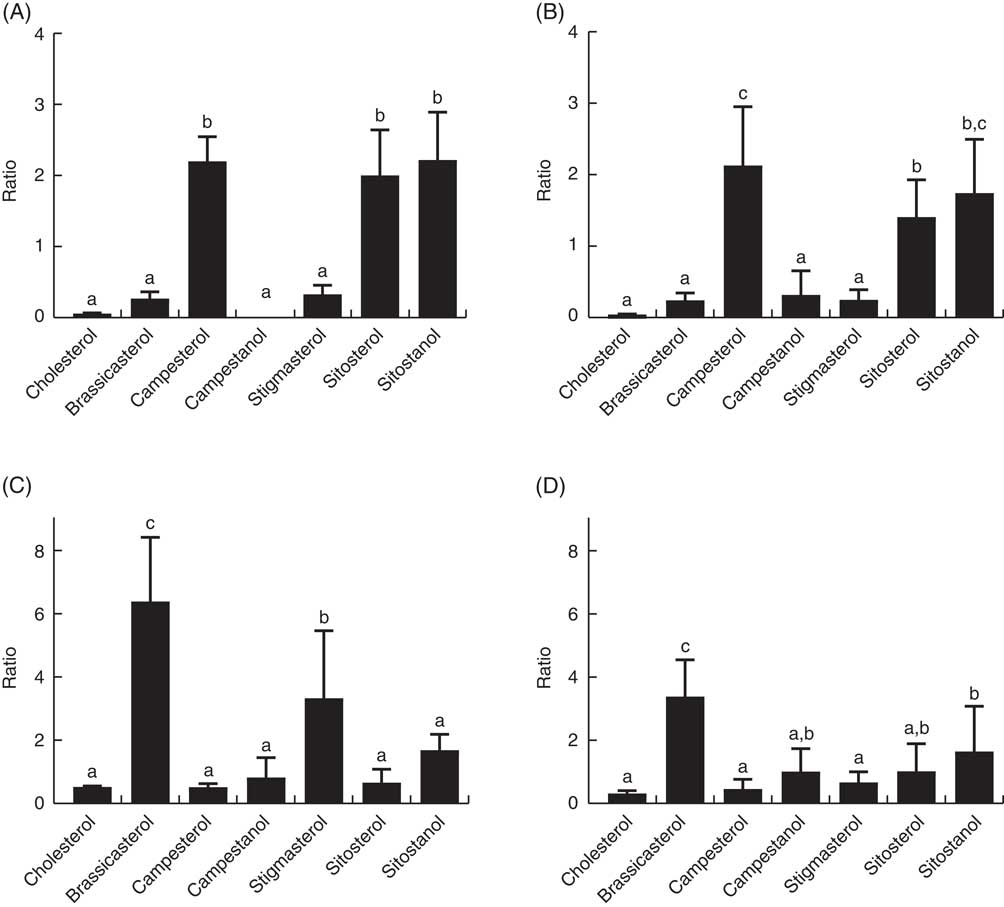
Fig. 5 The ratio of individual sterols in the bile (A, B) and adipose tissue (C, D) to the content in the liver, which can give an indication about differences in excretion through the bile and deposition in adipose tissue between the different sterols. All diet groups are combined. a,b,c Values with unlike letters were significantly different (P<0·05).
Gene expression in intestine
There were no significant differences in the RNA transcription of ACAT2, NCP1L1, ABCG5 or ABCA1 between the diet groups 0/0, 0/1000, 2000/0 and 2000/2000 at either temperature (data not shown).
Discussion
Phytosterols have been sparsely studied in fish, but are now increasing in aquafeeds, whereas cholesterol is decreasing, owing to increased replacement of fishmeal and fish oil with plant-based feed ingredients and especially with the use of rapeseed oil. Changes in sterol levels can have marked effects on membrane properties, affecting signal transduction and trafficking of membrane proteins and lipids( Reference Maxfield and Menon 28 ). Cholesterol also plays an important role in thermal adaptation of ectotherm animals, as incorporation of cholesterol into biological membranes affects membrane order and fluidity, stabilising membranes at high temperatures( Reference Crockett 19 ). Hence, knowledge is needed regarding phytosterol absorption, possible interference with cholesterol absorption and tissue cholesterol levels, excretion and tissue distribution of dietary phytosterols in the major aquaculture species Atlantic salmon. The phytosterol and cholesterol levels used in the present study cover the range found in commercial Norwegian salmon diets( Reference Sanden, Hemre and Måge 29 ).
The intestinal absorption is the first place where discrimination between cholesterol and phytosterols, and between the individual phytosterols, occurs. The differences in the phytosterol:cholesterol ratios between the mid-intestine and the feed in the present trial indicate a higher absorption of cholesterol compared with phytosterols, as well as of campesterol, and, second, brassicasterol compared with the other phytosterols. Important factors for sterol absorption are solubilisation in micelles, and then transfer rate from the micelles, which combined correlated well with lymphatic recovery of sterols in rats( Reference Hamada, Goto and Yamahira 30 ). While Hamada et al.( Reference Hamada, Goto and Yamahira 30 ) found the highest absorption for cholesterol, followed by campesterol and then similarly low values for brassicasterol and β-sitosterol, others have reported a higher absorption of brassicasterol both in rats and humans( Reference Vahouny, Connor and Roy 31 , Reference Gregg, Connor and Lin 32 ), which is more in line with our results. Higher proportional brassicasterol in the intestine at 12°C may indicate a higher absorption of this sterol at this temperature, possibly explaining the higher retention also seen at this temperature. In 2004 it was shown both in rats, mice and humans that NCP1L1 is critical for intestinal cholesterol absorption( Reference Altmann, Davis and Zhu 33 ), but this has not yet been confirmed in teleosts. To enter the bloodstream from the enterocyte, sterols can either be esterified by ACAT2 and incorporated into chylomicrons or be directly loaded onto apoA/HDL particles by ABCA1. Unesterified sterols present in the enterocyte are excreted back into the intestinal lumen by the heterodimeric transport proteins ABCG5/G8. NCP1L1, ACAT1 and ABCG5/G8 in the intestine do not discriminate between cholesterol and phytosterols, but ACAT2 displays cholesterol preference( Reference Brauner, Johannes and Ploessl 34 ). Excretion by ABCG5/G8 happens quite rapidly after absorption( Reference Igel, Giesa and Lütjohann 35 ); hence, this had probably to a large extent already occurred at the time point we sampled in the present trial (24 h after feeding). The clear differences in apparent absorption between the different sterols also support this; if less differences had been found, one could have suspected that the sampling had taken place mid-absorption. Cholesterol absorption does not seem to be affected by dietary phytosterols in the present trial, which might relate to the levels of phytosterols present, which were chosen to be relevant for aquaculture feeds. In a previous trial with Atlantic salmon smolt, dietary phytosterols from rapeseed oil in the feed did not significantly affect apparent digestibility of cholesterol( Reference Miller, Nichols and Carter 5 ). Gene expression of the intestinal transporters (ABCG5 and NPC1L1) was not significantly affected in our trial, whereas results on this in other animal models have varied( Reference Calpe-Berdiel, Escolà-Gil and Blanco-Vaca 12 ). NPC1L1 expression in CaCo2 cells was affected by PUFA but not by phytosterols( Reference Park and Carr 36 ), and DHA added to Caco-2 cells or fish oil in the diet of hamsters reduced intestinal expression of NCP1L1 ( Reference Mathur, Watt and Field 37 ). This might explain expression differences in other salmon feeding trials where differences both in dietary sterols and dietary fatty acid composition occurred simultaneously( Reference Liland, Espe and Rosenlund 6 ), but not in the present experiment.
Another important factor affecting the retention/deposition of sterols in the fish is biliary excretion, and the bile:liver ratios of the individual sterols can indicate whether certain sterols are preferentially excreted. Our results show that campesterol, β-sitosterol and sitostanol are excreted in bile to a large extent. Very low content of brassicasterol in the bile, combined with relatively high apparent absorption, helps explain why this phytosterol accumulates in the adipose tissue in the present trial. In humans, higher biliary secretion of β-sitosterol compared with campesterol has been reported( Reference Sudhop, Sahin and Lindenthal 38 , Reference Brufau, Canela and Rafecas 39 ), which does not seem to be the case for Atlantic salmon. The very low biliary excretion of brassicasterol in Atlantic salmon also points to possible species differences, as in wild-type mice the bile:liver ratios of individual phytosterols were similarly high for brassicasterol and β-sitosterol, whereas lower for campesterol( Reference Dikkers, Freak de Boer and Annema 40 ). However, consistent with our results, another study in Atlantic salmon reported an apparent digestibility of campesterol of 14–18 %, 9 % for brassicasterol and 1–7 % for β-sitosterol( Reference Miller, Nichols and Carter 5 ). The general rank of efficiency of biliary sterol secretion in animals has been reported as cholesterol>campesterol >brassicasterol>β-sitosterol>stigmasterol( Reference Yu, von Bergmann and Lutjohann 41 ), which is in line with our data, with the exception of brassicasterol. ABCG5/G8-mediated secretion of non-cholesterol sterols into bile plays a crucial role in preventing their accumulation in liver, and minor structural differences in the sterols seem to have a profound effect on trafficking by ABCG5/G8 in the liver, but it is unclear why( Reference Yu, von Bergmann and Lutjohann 41 ). However, there is also ABCG5/G8-independent secretion of sterols into bile, at least in mice( Reference Dikkers, Freak de Boer and Annema 40 ); hence, species differences may relate to the relative importance of the different pathways in the different species. Brassicasterol, for which excretion and deposition in salmon seemed to deviate most from mammals, is abundant in rapeseed oil, but also in the marine food chain, both in certain microalgae and in mollusks( Reference Gladu, Patterson and Wikfors 42 , Reference Sinclair, Murphy and Li 43 ), which could mean that wild salmon is also exposed to this phytosterol.
Unlike cholesterol in other tissues, which is mainly incorporated into membranes in the form of free cholesterol, the liver also stores a substantial amount of its cholesterol as cholesteryl ester in the sterol ester pool( Reference Alhazzaa, Oen and Sinclair 44 ). Changes in hepatic cholesterol levels can thus be due to changes in this rapidly exchangeable pool of sterol esters to be transported to the plasma. The slower rate of this transport at the lower temperatures may therefore be the cause of the higher liver cholesterol at 6°C. This is supported by also plasma levels being higher at 6°C, whereas whole-body levels were similar. Slower metabolism at 6°C may also explain the results for the phytosterols, which were higher both in liver and bile at 6°C, whereas whole fish levels and retention values were similar, suggesting a similar total biliary excretion at the two temperatures. The high TAG content in the liver of the fish reared at 6°C compared with 12°C( Reference Laakso 21 ) may also be a factor in the increased liver sterol content at this temperature. The increasing liver cholesterol with dietary cholesterol found at 12°C, but not at 6°C (possibly due to the high variation at this temperature), is previously reported in Atlantic salmon( Reference Liland, Espe and Rosenlund 6 ). Liland et al.( Reference Liland, Espe and Rosenlund 6 ) reported phytosterol levels in liver of Atlantic salmon at up to 117 and 155 mg/kg in two different feeding trials, which is higher than in the present trial, especially at 12°C. In those two trials, fish were reared at 9 and 10°C, and had lower maximum dietary phytosterol levels than in the present trial, but the fish were bigger (approximately 3 kg) and were fed the experimental diets for a longer period, which might explain the difference to our trial.
Generally, tissue cholesterol correlated more pronounced to dietary cholesterol, whereas tissue campesterol correlated more strongly to the dietary phytosterol:cholesterol ratio. For campesterol retention, increasing dietary cholesterol had a negative effect, possibly indicating lower intestinal absorption when there is increasing ‘competition’ from cholesterol. On the other hand, retention of brassicasterol was more dependent on the dietary concentration of phytosterols, and the decreasing retention with increasing dietary level explains why tissue levels of brassicasterol remained unaffected by dietary phytosterols. The fact that retention of campesterol was affected by dietary cholesterol, while the retention of brassicasterol was most affected by dietary phytosterol, indicated differences in the absorption of these two phytosterols. Hamada et al.( Reference Hamada, Goto and Yamahira 30 ) showed that campesterol was much more solubilised in the micelles than brassicasterol, whereas this was to some extent compensated by the higher transfer rate of brassicasterol from the micelles. The clear temperature difference in brassicasterol retention and tissue levels has to our knowledge not been reported before, and interestingly did not apply to any of the other phytosterols, once again indicating differences in the absorption and/or excretion mechanisms. Cholesterol uptake was shown to be temperature dependent in an in vitro human intestine model( Reference Sviridov, Safonova and Nano 18 ), but this has to our knowledge not been investigated for the different phytosterols. Although retention of cholesterol was higher at 6°C, the fact that whole-body concentration was similar shows that this might be more related to differences in feed intake and feed conversion at the two temperatures. The retention results for cholesterol prove a high extent of de novo production in Atlantic salmon when fed low dietary levels, although fish fed low dietary cholesterol did not fully compensate, as tissue cholesterol levels generally correlated positively with dietary cholesterol. On the contrary, in a feeding study with rainbow trout, there was significantly more cholesterol in whole body of the fish fed the vegetable oil diet without cholesterol fortification compared with if extra cholesterol was added to the diet( Reference Norambuena, Lewis and Hamid 45 ), indicating an overcompensation in the endogenous cholesterol production when dietary levels were low. Dietary rapeseed oil compared with fish oil affected plasma lipoproteins( Reference Torstensen, Frøyland and Lie 46 ) and reduced the total plasma cholesterol and LDL-cholesterol in Atlantic salmon( Reference Jordal, Lie and Torstensen 47 ). In light of the present results, this was probably more related to the decreased dietary cholesterol rather than the increased phytosterols.
One dinner portion (150 g) of fillet with the highest phytosterol content from our trial would just contain 4·2 mg of phytosterols. In comparison, one tablespoon (8 g) of a high-phytosterol oil as maize oil (up to 15·6 mg phytosterols/g oil( Reference Jordal, Lie and Torstensen 47 )) provides 125 mg of phytosterols. The content of phytosterols in a typical Western diet varies between 160 and 360 mg/d, being even higher for vegetarians( Reference Connor 49 – Reference de Vries, Jansen and Kromhout 51 ). Although a larger fish with a higher fillet lipid content (the normal harvest size of Atlantic salmon is approximately 5 kg) might accumulate somewhat higher phytosterol levels than the 900 g fish in our study, farmed salmon fed rapeseed oil will only make a very minor contribution to phytosterol intake in humans.
In conclusion, dietary phytosterols did not seem to affect cholesterol absorption or tissue cholesterol levels, and, furthermore, did not affect tissue phytosterol levels, as this was more affected by dietary cholesterol and the phytosterol:cholesterol ratio. Campesterol and, second, brassicasterol appear to be the phytosterols with the highest intestinal absorption in Atlantic salmon, and are also the ones that accumulate to the highest extent in tissues. Unlike campesterol, there was hardly any biliary excretion of brassicasterol, resulting in even higher retention of brassicasterol than campesterol. Brassicasterol appears to particularly accumulate in adipose tissue, and interestingly also has a 2-fold-higher retention at 12°C compared with 6°C. This study clearly shows that there are differences in how the individual phytosterols are absorbed, excreted and deposited in tissues of Atlantic salmon.
Acknowledgements
The authors thank Synnøve Winterthun, Ikram Belghit and Nathaniel Sibinga from NIFES for valuable help with the samplings.
The study was kindly funded by The Norwegian Seafood Research Fund – FHF (grant number: 901049, ‘Steroltemp’). Bashir Adbulkader, Joar Breivik, Eva Mykkeltvedt and Hui-Shan Tung at NIFES are acknowledged for technical assistance with sample analyses, and Tårn Helgøy Thomsen from Skretting ARC is acknowledged for technical assistance at the Lerang research station.
N. S. L., N. H. S. and G. R. designed and planned the trial; I. S. formulated the diets; N. S. L., N. H. S. and G. R. participated in sampling; N. S. L. was responsible for gene expression analyses and data; and N. H. S. was responsible for sterol analyses and data. N. H. S. was the main author of the manuscript, but all authors participated in the writing of the manuscript and approved the final version.
There are no conflicts of interest.
Supplementary materials
For supplementary material/s referred to in this article, please visit https://doi.org/10.1017/S0007114517003853


