


Consumption of sugar-sweetened beverages (SSB) has more than doubled in the USA in the past 50 years( Reference Popkin 1 ), providing a significant source of energy to the diet of Americans. Sugary drinks make up about 9 % of the US daily energy intake( Reference Nielsen and Popkin 2 ) and >40 % of ‘added sugars’ in the diet( Reference Marriott, Olsho and Hadden 3 ). Sucrose and high-fructose maize syrup are sugars commonly used to sweeten soft drinks, whereas artificial sweeteners such as aspartame are used in diet soft drinks.
Data from cross-sectional, longitudinal and experimental studies implicate a high intake of sweetened beverages and risk for cardiometabolic risk factors and diseases including obesity( Reference Olsen and Heitmann 4 , Reference Vartanian, Schwartz and Brownell 5 ), type 2 diabetes mellitus( Reference Greenwood, Threapleton and Evans 6 – Reference O’Connor, Imamura and Lentjes 8 ), hypertension( Reference Chen, Caballero and Mitchell 9 ) and the metabolic syndrome( Reference Malik, Popkin and Bray 7 , Reference Malik, Popkin and Bray 10 ). Obesity rates have also risen over the same period of time that intakes of sugar-containing beverages have increased( Reference Popkin 1 ), with more than two-thirds of American adults (68·8 %) currently classified as overweight or obese( Reference Flegal, Carroll and Kit 11 ). The prevalence of type 2 diabetes in the USA is also increasing, affecting over 29 million Americans (9·3 % of the population in 2012)( 12 ). These risk factors have all been linked with impaired cognitive functioning( Reference van den Berg, Dekker and Nijpels 13 , Reference van den Berg, Kloppenborg and Kessels 14 ). Decrements in cognition and memory complaints in healthy individuals represent an increased risk for the development of dementia later in life( Reference Elias, Beiser and Wolf 15 , Reference Jonker, Geerlings and Schmaud 16 ).
Although numerous studies have examined the association between soft drinks (both sugar-sweetened and artificially sweetened) and cardiometabolic outcomes, fewer studies have specifically assessed soft drink intake, including both regular and diet drinks, in relation to cognition. In one recent study, greater intakes of total sugars, added sugars and SSB (including both carbonated and fruit drinks with added sugars) were associated with poorer performance on a general global cognition measure, the Mini-Mental State Examination (MMSE), in middle aged to elderly adults free of diabetes( Reference Ye, Gao and Scott 17 ).
In the present study, we examined the relationships between soft drink intake and cognitive function in a community-based, dementia-free population. We distinguished soft drinks from SSB, which included fruit drinks with added sugars, included individuals with diabetes in the analysis and utilised a thorough cognitive test battery comprised of multiple cognitive domains. As it remains unclear whether sugar-sweetened soft drinks differ in their relations with cognition relative to diet soft drinks, we also examined these relationships, before and after adjustment for cardiovascular risk factors and dietary and lifestyle factors that impact upon cognition. Finally, due to the significant amount of research linking type 2 diabetes with intakes of SSB and with cognitive performance, we examined whether relations vary according to diabetes status.
Methods
Participants
Participants were selected from the Maine–Syracuse Longitudinal Study (MSLS), a community-based study of cardiovascular risk factors and cognitive functioning in adults( Reference Dore, Elias and Robbins 18 – Reference Robbins, Elias and Elias 21 ). The MSLS consists of five cohorts defined by time of entry into the study (1975–2000). At initial recruitment, participants were living independently in Syracuse, New York. The only exclusions at recruitment were diagnosis of or treatment for psychiatric illness, alcoholism and inability to comprehend English. Participants of the present study were those returning for the sixth study wave (2001–2006), as dietary intake measures were first obtained at this time. The MSLS was approved by the University of Maine Institutional Review Board, and informed consent for data collection and medical record review was obtained from all participants.
From a sample of 1049 individuals, participants were excluded for the following reasons: missing dietary or cognitive data (n 169), acute stroke (n 28), probable dementia (n 8), undertaking dialysis treatment (n 5), inability to read English (n 1) and previous alcohol abuse (n 1), leaving 803 participants. Dementia cases were excluded as we were interested in examining relationships between diet and cognitive performance, but not in those with severe cognitive impairment. The clinical diagnosis of dementia was determined by the committee using the National Institute of Neurological and Communicative Diseases and Stroke/Alzheimer’s Disease and Related Disorders Association criteria, MSLS cognition data, diagnostic records and medical interview data( Reference McKhann, Drachman and Folstein 22 ). Stroke was defined as a focal neurological deficit of acute onset persisting for more than 24 h and was based on self-report or medical records.
This study was conducted according to the guidelines laid down in the Declaration of Helsinki, and all procedures were approved by the University of Maine Institutional Review Board. Written informed consent was obtained from all subjects.
Procedure and assessment
Demographic, socio-economic and lifestyle characteristics were obtained from the Nutrition and Health Questionnaire( Reference Kaaks and Riboli 23 , Reference Riboli and Kaaks 24 ). Data obtained included smoking history, living situation, marital status and medical history. Physical activity was measured using the Nurses’ Health Study Activity Questionnaire – a validated measure of time spent engaging in various physical activities( Reference Wolf, Hunter and Colditz 25 ). The Center for Epidemiological Studies Depression Scale( Reference Radloff 26 ) was used to assess depressive symptoms. Education level was obtained through self-report and ranged from 4 to 20 years.
Dietary intake
Dietary intake was also assessed using the Nutrition and Health Questionnaire( Reference Kaaks and Riboli 23 , Reference Riboli and Kaaks 24 ). Participants were required to stipulate how frequently they consumed a list of foods including meat, fish, eggs, breads, cereals, rice and pasta, fruits, vegetables, dairy foods, chocolate, nuts, other snack-type foods and beverages. Participants were required to stipulate how frequently they consumed each food item, with six response options ranging from never to once or more per day. Beverages included tea, coffee, water, fruit juice and alcohol. For soft drinks, participants were required to indicate how many glasses/cans of carbonated soft drinks (regular, sugar-sweetened) and ‘diet’ carbonated soft drinks (artificially sweetened) they consumed each day.
In order to estimate the mean intakes of the major food groups and total energy intake, the median score within each response option was used to estimate total intakes per week – for example, two to three times per week was estimated at 2·5. The mean number of times each food was consumed on a weekly and then daily basis was calculated for all foods in the questionnaire. As portion sizes were not stipulated to participants, these totals are an estimate of the number of times each food was consumed on a daily basis. Individual foods were categorised into six major food groups – grains, fruits, vegetables, protein foods, dairy foods and fats/sweets/other – based on the United States Department of Agriculture Food Guide Pyramid( 27 ). Intakes of individual foods and beverages within each food group were summed to give an estimate of total intake for each group. An estimation of total energy intake was calculated by adding intakes of all food groups and was used to control for energy intake in subsequent analyses.
Cognitive function
Cognitive function was assessed using the MSLS neuropsychological test battery, which has been used in numerous health and cognition studies( Reference Dore, Elias and Robbins 18 – Reference Robbins, Elias and Elias 21 , Reference Elias, Elias and Seliger 28 ). The following composite scores have been previously derived using factor analysis from twenty individual tests designed to measure a wide range of cognitive domains: visual spatial memory and Organisation, scanning and tracking, Verbal Episodic Memory, working memory and executive function. The Wechsler Adult Intelligence Scale (WAIS) similarities test( Reference Lezak, Howieson and Loring 29 ), a measure of abstract reasoning, loaded on all composite scores (factors), and was thus used separately. A global cognition composite score was derived by averaging the z-scores for all individual tests and then re-standardising these scores to obtain a z-score with a mean of 0 and sd of 1·00. In addition, the MMSE( Reference Folstein, Folstein and McHugh 30 ), a global measure of mental status widely used in the literature, was included in the MSLS battery. The derivation of these composites has been described previously( Reference Elias, Robbins and Budge 20 ) and they have been repeatedly utilised in MSLS studies. All cognitive performance measures are expressed in the same unit of measurement (sd units) – that is, z-scores.
Physical health assessment
Standardised protocols for data collection were used. Standard assay methods were used( Reference Elias, Robbins and Budge 20 ) to obtain values of fasting plasma glucose (mmol/l), total cholesterol (TC, mmol/l), LDL-cholesterol (mmol/l), HDL-cholesterol (mmol/l), TAG (mmol/l) and C-reactive protein (CRP, nmol/l), following an overnight fast. Body weight was measured with participants wearing light clothing to the nearest 0·1 kg, and height was measured using a vertical ruler to the nearest 0·1 cm. BMI was calculated as weight in kilograms divided by height in metres squared. Waist circumference (cm) was measured over light clothing, using a non-extendable measuring tape, at the level of the iliac crest. Automated blood pressure (BP) measures (GE DINAMAP 100DPC-120XEN; GE Healthcare) were taken five times each in the reclining, sitting and standing positions after a supine rest for 15 min, and were averaged for systolic and diastolic BP. Obesity was defined as having a BMI of at least 30 kg/m2.
Interaction with diabetes
Diabetes was defined as having a fasting glucose level of at least 7·0 mmol/l or being treated with anti-diabetic medication. Any interaction between diabetes status and soft drink intake was tested. Two interaction terms were created: diabetes (Y/N)×regular soft drink intake and diabetes (Y/N)×diet soft drink intake. These terms were included in the basic model (described below) to test for such interactions.
Statistical analyses
Participant demographics, health and dietary variables and cognitive scores were compared according to soft drink intake (type and quantity). Independent samples t tests were used for continuous variables and χ 2 test for categorical variables.
Regular and diet soft drink intakes were examined in relation to each measure of cognitive performance using multiple linear regression. Potential confounding factors were identified on the basis of two criteria: (1) had to be theoretically relevant( Reference Jaccard and Jacoby 31 ) and (2) had to show a statistically significant association (P<0·05) with both soft drink intake and the global composite.
The covariates included were organised into three models:
-
(1) Basic set: age, sex and education.
-
(2) Extended covariate set 1: basic set plus estimated energy intake (total daily intakes of all food groups as previously described), depressed mood, CRP, HDL-cholesterol, TAG, diabetes and total grains, fruit and vegetable intakes per day.
-
(3) Extended covariate set 2: the basic set and extended set 1 plus BMI.
The other risk factors measured did not correlate significantly with both predictor and outcome, and thus were not included in the statistical models. As a significant interaction between diabetes and regular soft drink intake was observed, these analyses were performed according to diabetes status (Y/N).
All the statistical analyses were performed using PASW for Windows® version 21.0 software (formerly SPSS Statistics Inc.); P<0·05 was considered to be statistically significant.
Results
Participant characteristics and soft drink consumption
Table 1 shows the demographic and health-related variables, cognitive scores and dietary intakes of the MSLS participants, according to soft drink intake. Nearly 20 % of the sample consumed one or more regular soft drinks each day, and 27 % consumed at least one diet soft drink per day. Males consumed regular soft drinks more frequently than females. Individuals who did not consume regular soft drinks smoked less, had lower waist circumference and BMI, lower TAG and higher HDL-cholesterol, compared with those who consumed regular soft drinks daily. They also had significantly higher scores on a number of cognitive performance measures. From a dietary perspective, non-consumers of regular soft drinks had higher intakes of fruit and vegetables and lower intakes of grains and overall energy. Individuals who did not consume diet soft drinks had lower cognitive scores than those who consumed diet soft drinks daily.
Table 1 Baseline demographics and health and dietary factors according to soft drink intake in the Maine–Syracuse Longitudinal Study sample (n 803) (Mean values and standard deviations)

BP, blood pressure; CES-D, Center for Epidemiological Studies Depression Scale.
Mean values are significantly different: * P<0·05, ** P<0·01, *** P<0·001.
† CES-D: higher score indicates greater number of depressive symptoms.
‡ Diabetes defined as having a fasting glucose level of at least 126 mg/dl, or treated with anti-diabetic medication.
§ Total energy intake=total serves/day all food groups.
The online Supplementary Table S1 shows the demographic and health-related variables, cognitive scores and dietary intakes of the MSLS participants, according to diabetes status (Y/N).
Soft drink consumption and cognitive performance in the Maine–Syracuse Longitudinal Study: stratification by diabetes
A significant interaction was observed between diabetes status and daily regular soft drink intake (basic model: b=−0·30, P=0·009). No interaction was observed for diet soft drinks and diabetes (b=0·09, P=0·09). Table 2 summarises the associations between regular soda intake and cognitive functioning measures, stratified by the presence or absence of diabetes.
Table 2 Association between regular soft drink intake (serves/d) and cognitive functioning measures, stratified by diabetes statusFootnote * (Raw regression coefficients for z-scores with their standard errors)

* Diabetes defined as having a fasting glucose level of at least 126 mg/dl, or treated with anti-diabetic medication.
† Basic model: regression coefficients were adjusted age, education, sex; extended model 1; regression coefficients were adjusted for variables in basic model plus age, education, sex, CES-D, CRP, HDL-cholesterol, TAG, smoking status, total energy intake, total grains per day, total fruits per day, total vegetables per day; extended model 2: regression coefficients were adjusted for variables in basic model and extended model 1 plus BMI.
In individuals with type 2 diabetes, there were significant linear, inverse associations between regular soft drink intake and cognitive functioning scores for the global composite, visual spatial memory and organisation, working memory, scanning and tracking, executive function and MMSE (all P<0·01, basic model). With the addition of cardiovascular, lifestyle and dietary risk factors, significant inverse linear associations remained for all of these cognitive outcomes. The addition of BMI to this model did not attenuate these associations (all P<0·05).
In non-diabetic individuals, there were significant linear, inverse associations between regular soft drink intake and cognitive functioning scores for the global composite, working memory, scanning and tracking, executive function and MMSE (all P<0·01, basic model). All these relationships remained significant with further statistical adjustment for cardiovascular, lifestyle, dietary factors and BMI (extended 2 model, all P<0·05).
Fig. 1 and 2 show the multivariate adjusted z-scores for the global composite and the MMSE, respectively, in diabetic and non-diabetic individuals. As can be seen, scores decreased significantly for both measures, in both subject groups, as regular soft drink intakes increased; however, the differences between scores were considerably greater in those with type 2 diabetes.

Fig. 1 Multivariate adjusted global composite z-scores in diabetic (![]() ) and non-diabetic (
) and non-diabetic (![]() ) subjects according to regular soft drink intake. Z-scores adjusted for age, education, sex, Center for Epidemiological Studies Depression Scale, C-reactive protein, HDL-cholesterol, TAG, smoking, total energy intake, total grains per day, total fruit per day, total vegetables per day, BMI. Significantly different from 0/d group: ** P<0·01.
) subjects according to regular soft drink intake. Z-scores adjusted for age, education, sex, Center for Epidemiological Studies Depression Scale, C-reactive protein, HDL-cholesterol, TAG, smoking, total energy intake, total grains per day, total fruit per day, total vegetables per day, BMI. Significantly different from 0/d group: ** P<0·01.
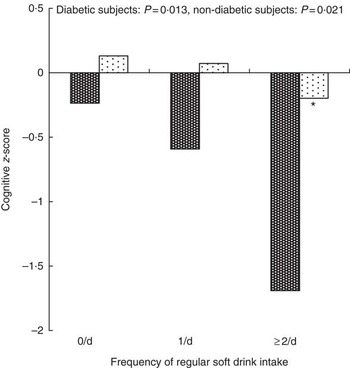
Fig. 2 Multivariate adjusted Mini-Mental State Examination (MMSE) z-scores in diabetic (![]() ) and non-diabetic (
) and non-diabetic (![]() ) subjects according to regular soft drink intake. Z-scores adjusted for age, education, sex, Center for Epidemiological Studies Depression Scale, C-reactive protein, HDL-cholesterol, TAG, smoking, total energy intake, total grains per day, total fruit per day, total vegetables per day, BMI. Significantly different from 0/d group: * P<0·05.
) subjects according to regular soft drink intake. Z-scores adjusted for age, education, sex, Center for Epidemiological Studies Depression Scale, C-reactive protein, HDL-cholesterol, TAG, smoking, total energy intake, total grains per day, total fruit per day, total vegetables per day, BMI. Significantly different from 0/d group: * P<0·05.
There were no significant associations found between intakes of diet soft drinks and cognitive outcomes (basic or extended models).
Secondary analyses
Sensitivity analyses were performed by substituting BMI for waist circumference:waist hip ratio, and the results were unchanged. Any interaction between regular soft drink intake and BMI was tested in relation to the global composite. In both diabetic and non-diabetic individuals, this interaction term was not significant (basic model, diabetic group: b=−0·004, P=0·8; non-diabetic group: b=0·002, P=0·6).
We also tested the same associations between regular and diet soft drink intake and cognitive function in a pre-diabetic subgroup (n 146). These individuals were defined as having a fasting plasma glucose level of 5·5–7·0 mmol/l( 32 ). There were no significant associations between regular or diet soft drink intake and any of the cognitive performance outcomes in this subgroup (basic model, all P>0·08).
Discussion
Regular, sugar-sweetened soft drink intake was inversely associated with cognitive performance across a range of cognitive domains in this dementia-free, community-dwelling population. The associations between greater regular soft drink consumption and poorer cognitive performance remained significant after adjustment for a number of cardiovascular risk factors, including TAG, HDL-cholesterol, CRP and smoking status. Associations were not attenuated with the addition of dietary variables, indicating that soft drinks are associated with cognition, irrespective of other dietary behaviours. In a final step, the addition of BMI did not attenuate these associations. The same result was obtained when the waist circumference:waist hip ratio was substituted for BMI in the sensitivity analyses. These inverse associations were observed for those with and without type 2 diabetes, but the strength of the associations and the magnitude of change across cognitive scores were considerably greater in individuals with diabetes. There were no associations observed between diet soft drink intakes and cognitive performance.
Our results support those of Ye et al. ( Reference Ye, Gao and Scott 17 ), who examined habitual sugar intake and cognitive function in a middle-aged, Puerto Rican sample, excluding diabetic subjects. Ye et al. ( Reference Ye, Gao and Scott 17 ) found that SSB intake, which included fruit drinks as well as soft drinks, was inversely associated with cognitive function. In the Ye et al. ( Reference Ye, Gao and Scott 17 ) study, total sugars, added sugars, sucrose, glucose and added fructose were each significantly, inversely associated with general cognitive function, as measured by the MMSE. No associations between SSB and specific cognitive functions (memory, executive function, attention) were noted. This differs from our study, in which sugar-sweetened soft drinks were inversely associated with a number of specific cognitive domains including visual spatial memory, working memory, scanning and tracking and executive function.
In addition, the present study indicates that inverse associations between soft drinks and cognitive performance are exacerbated in type 2 diabetes patients, and supports the existing literature demonstrating the positive association between intake of sugar-sweetened soft drinks and risk for type 2 diabetes( Reference Greenwood, Threapleton and Evans 6 – Reference O’Connor, Imamura and Lentjes 8 ). A meta-analysis by Malik et al. ( Reference Malik, Popkin and Bray 7 ) showed that individuals in the highest quartile of SSB intake (1–2 servings/d) had a 26 % greater risk of developing type 2 diabetes than those in the lowest quartile (none or <1 serving/month). Findings from the Nurses’ Health Study II showed that women consuming one or more sugar-sweetened soft drinks per day had a relative risk of 1·83 for developing type 2 diabetes, compared with those who consumed <1 serving/month( Reference Schulze, Manson and Ludwig 33 ). This study included over 91 000 women over an 8-year period.
The review by Malik et al. ( Reference Malik, Popkin and Bray 7 ) has been supported and expanded upon by a more recent systematic review and meta-analysis by Greenwood et al. ( Reference Greenwood, Threapleton and Evans 6 ). These investigators concluded that findings from nine cohort studies indicated a positive association between sugar-sweetened soft drinks and type 2 diabetes risk( Reference Greenwood, Threapleton and Evans 6 ). Exploring dose–response trends, Greenwood et al. ( Reference Greenwood, Threapleton and Evans 6 ) have shown that an increase of 330 ml/d was associated with an approximate increased diabetes risk of 20 %. This association was attenuated by adjustment for BMI. For artificially sweetened soft drinks, the trend was less consistent. On the basis of these observations, the authors proposed that BMI is involved in the causal pathway between soft drink consumption and type 2 diabetes.
It may therefore be hypothesised that BMI may play a similarly important role in the causal pathway between soft drink consumption and cognitive functioning. In the USA, soft drinks have been the single largest contributor to energy intake during the last decade( Reference Block 34 ). Mean daily intakes are estimated at 500 ml of soft drinks (or approximately one 16-oz beverage) per person( Reference Popkin 1 , Reference Nielsen and Popkin 2 ), with many consuming more than this amount. A typical 20-ounce (590 ml) soda contains 15–18 teaspoons of sugar and upwards of 1·004 kJ (0·240 kcal)( 35 ). Sugar consumption from a high intake of soft drinks may lead to increased body weight and obesity, which may increase one’s risk for type 2 diabetes( Reference Malik, Popkin and Bray 10 , Reference Bray 36 ), and therefore risk for cognitive decline. This may in part occur as energy from beverages does not appear to produce a resultant decrease in energy obtained from solid food, whereas energy ingested from solid food is followed by an ‘off-setting’ reduction in the intake of other foods( Reference Mattes and Campbell 37 ). People who consume higher amounts of sugar-containing soft drinks may fail to compensate for these ‘calories consumed in liquid form’ at their next meal, promoting a positive energy balance and weight gain( Reference DiMeglio and Mattes 38 ). The energy compensation made for beverages is not equivalent to that made for solid foods, and therefore the energy content of soft drinks can contribute to a cumulative excess of energy over time to produce obesity( Reference Bray 36 ).
Other observational studies and a number of randomised clinical trials have examined associations between sugar-containing beverages and metabolic outcomes in addition to body composition. Raben et al. ( Reference Raben, Vasilaras and Moller 39 ) compared two groups of overweight individuals consuming either sugar-sweetened cola or aspartame-sweetened cola for 10 weeks. Body weight, fat mass, energy intake and BP increased in the sucrose group, but these effects were not observed in the artificial sweeteners group.
Stanhope et al. ( Reference Stanhope, Schwarz and Keim 40 ) compared the regular intake of glucose v. fructose-sweetened beverages in overweight adults for 10 weeks with respect to a number of cardiometabolic outcomes. In subjects consuming the fructose drinks, but not glucose, fasting plasma glucose, insulin and visceral adiposity increased significantly and insulin sensitivity decreased. The fructose may be responsible for visceral fat deposits by providing substrates for fat development when it is metabolised, predominantly in the liver( Reference Bray 36 ). The adverse metabolic effects of fructose have been supported in other studies( Reference Teff, Grudziak and Townsend 41 ). The fructose in these beverages may stimulate an increase in TAG( Reference Stanhope, Schwarz and Keim 40 , Reference Teff, Grudziak and Townsend 41 ). High-fructose maize syrup is the sole sweetener in US soft drinks( Reference Bray, Nielsen and Popkin 42 ), and in contrast to glucose fructose does not stimulate insulin secretion or enhance leptin production, both key to the regulation of food intake. High-fructose maize syrup has therefore been suggested as playing a role in the obesity epidemic( Reference Bray, Nielsen and Popkin 42 ).
A longer-term study lasting 6 months and comparing cardiometabolic effects from the consumption of 1 litre of either sugar-sweetened cola, semi-skimmed milk, aspartame-sweetened cola or water showed that the frequent consumption of regular cola resulted in detrimental metabolic changes( Reference Maersk, Belza and Stodkilde-Jorgensen 43 ). In the regular soft drink group, visceral, liver and muscle fat, TAG, TC and systolic BP were all significantly increased at the end of the 6-month trial, and these effects were not observed in the remaining groups. The effects of regular cola consumption therefore are not limited to obesity and weight gain, as body weight did not change significantly in this trial.
A systematic review and meta-analysis by Vartanian et al. ( Reference Vartanian, Schwartz and Brownell 5 ) examined the association between soft drink consumption and nutrition and health outcomes. Clear associations were found between soft drink intake and increased energy intake, body weight and lower intakes of milk, Ca and other nutrients. This raises the possibility that soft drinks displace other nutrient sources, which may have beneficial effects on not only cardiometabolic health but also brain function. Second, soft drinks may be associated with a higher energy consumption that can be accounted for by the soft drinks alone, which may increase the likelihood that soft drinks( Reference Mattes and Campbell 37 , Reference DiMeglio and Mattes 38 ) increase hunger or preference for energy-dense or sweet foods. Relationships have been shown between higher intakes of sugar-sweetened soft drinks and lower intakes of fruit and dietary fibre and higher carbohydrate intakes( Reference Vartanian, Schwartz and Brownell 5 ); therefore, soft drink intakes could be an indicator of overall poor dietary habits.
A few studies have suggested that patients with Alzheimer’s disease (AD) may have a greater preference for sweet foods than non-impaired controls( Reference Mungas, Cooper and Weiler 44 ). However, some studies have shown associations between SSB and lower cognitive function, but not sugar-sweetened solid foods( Reference Ye, Gao and Scott 17 ). This could potentially be due to the differential contributions of sucrose, glucose and fructose in beverages compared with solid foods. It also indicates that the inverse associations between sugar consumption and cognitive function are not explained by other aspects of a poorer dietary pattern – that is, solid foods high in sugar.
Overall, the evidence from clinical studies for the adverse effects from regular consumption of sugar-sweetened soft drinks on risk factors for cardiometabolic disease including obesity, type 2 diabetes, the metabolic syndrome and CVD( Reference Olsen and Heitmann 4 , Reference Vartanian, Schwartz and Brownell 5 , Reference Malik, Popkin and Bray 7 , Reference Malik, Popkin and Bray 10 , Reference Bray 36 ) is substantial. These disease states have all been shown to have a negative impact upon cognition( Reference van den Berg, Dekker and Nijpels 13 , Reference van den Berg, Kloppenborg and Kessels 14 , Reference van den Berg, Biessels and de Craen 45 , Reference Kivipelto, Ngandu and Fratiglioni 46 ). Type 2 diabetes has been repeatedly associated with decreases in psychomotor speed, executive function, verbal and working memory, verbal fluency, recall tasks and global cognitive dysfunction( Reference Gregg, Yaffe and Cauley 47 – Reference Kodl and Seaquist 51 ), as well as risk for dementia and AD( Reference Kloppenborg, van den Berg and Kappelle 52 – Reference Biessels, Staekenborg and Brunner 56 ).
The mechanisms responsible for relative lower cognitive performance in those with type 2 diabetes are not completely understood. Potential mechanisms or causative factors include hyperglycaemia, insulin resistance, hyperinsulinaemia, inflammation and amyloid deposition( Reference Kodl and Seaquist 51 , Reference Roriz-Filho, Sa-Roriz and Rosset 57 ). Type 2 diabetes and AD share the common pathophysiology of inflammation( Reference Hak, Pols and Stehouwer 58 , Reference Hull, Strauss and Berger 59 ). A high consumption of sugar-sweetened foods and beverages has been demonstrated to increase inflammatory markers( Reference Sorensen, Raben and Stender 60 ), which is a major risk factor for diabetes as well as dementia. A second mechanism may be via the disruption of the hypothalamic–pituitary–adrenal axis, which occurs with type 2 diabetes, with resultant increased serum cortisol levels( Reference Lee, Chan and Yeung 61 ). Elevated cortisol levels have been associated with deficits in cognitive performance( Reference Lupien, Lecours and Lussier 62 ). A third mechanism is via the formation of senile plaques composed of β-amyloid found in AD, as insulin resistance or hyperinsulinaemia may impact upon the metabolism of β-amyloid, reducing β-amyloid clearance, and therefore increasing the formation of such plaques( Reference Kodl and Seaquist 51 ). Diabetic patients are also more at risk for generalised brain atrophy and greater white matter, high-intensity lesions, indicative of accelerated brain ageing( Reference Akisaki, Sakurai and Takata 63 , Reference Lazarus, Prettyman and Cherryman 64 ). Individuals with advanced white matter lesions are at increased risk for executive dysfunction, cognitive decline and dementia( Reference Roriz-Filho, Sa-Roriz and Rosset 57 ). The hippocampal and amygdala atrophy seen in subjects with type 2 diabetes with brain imaging are also found to be atrophied in AD patients( Reference den Heijer, Vermeer and van Dijk 65 ). These areas of the brain are responsible for memory and behaviour. Indeed, cognitive impairment in type 2 diabetes has been more evident for verbal memory than for attention, concentration or executive function( Reference Greenwood 66 ).
We may hypothesise that the stronger associations between sugar-sweetened soft drinks and cognition in diabetic individuals than in non-diabetic individuals may be due to the combined or accumulative detrimental metabolic effects from both sugar-sweetened soft drinks and type 2 diabetes on the brain. Increased inflammation, for example, is common to both type 2 diabetes and the consumption of sugar-sweetened foods and beverages( Reference Kodl and Seaquist 51 , Reference Roriz-Filho, Sa-Roriz and Rosset 57 , Reference Sorensen, Raben and Stender 60 ). This may then be further exacerbated by other poor dietary habits such as increased intakes of energy-dense or foods high in sugar and lower intakes of fruits and dietary fibre.
Some study limitations must be acknowledged. Our data are cross-sectional, and the dietary questionnaire used has a number of limitations. Soft drink intakes were not specified, regarding the exact serving size. Self-reported nutritional intake can lead to underestimation or overestimation of true associations, and measurement at only one point may not reflect long-term consumption patterns.
The present study has a number of strengths. This is the first cross-sectional study that has examined both regular and diet soft drink intakes and cognitive performance using a standardised battery of cognitive tests while controlling for cardiovascular risk factors and lifestyle and dietary factors. The assessment methods used have enabled us to discriminate between effects on different cognitive domains, and the results may be generalisable to the wider community.
Diet modification is one way in which individuals can potentially prevent or slow neuropsychological dysfunction. In this study, a higher intake of regular soft drinks was associated with poorer cognitive performance, and these relations were particularly strong in those with type 2 diabetes. To enhance our understanding of this possible association, longitudinal studies need to be carried out with detailed assessments of both diet and cognition at multiple time periods. Ultimately, large, well-controlled, long-term intervention trials are needed.
Acknowledgements
The authors thank Amanda Goodell and Suzanne Brennan, Maine–Syracuse Longitudinal Study, University of Maine, for their help with data acquisition and data management.
The research was supported in part by the National Heart, Lung and Blood Institute (grants HL67358 and HL81290) and the National Institute on Aging (grant AG03055) of the National Institutes of Health to the University of Maine. The first author was supported by a Sidney Sax Research Fellowship (National Health and Medical Research Council, Australia, grant number APP1054567).
The authors’ contributions are as follows: M. F. E. contributed to the conception, design and acquisition of data for the MSLS. G. E. C. and M. F. E. conceived the research question. G. E. C. analysed the data and drafted the manuscript. R. V. T. contributed to the literature review and interpretation of the data. All the authors contributed to critical revisions, have read and approved the final version of the manuscript.
The authors declare that there are no conflicts of interest.
Supplementary Material
For supplementary material/s referred to in this article, please visit http://dx.doi.org/doi:10.1017/S0007114516000325


