Systemic low-grade (or chronic) inflammation is widely recognised as a modifiable risk factor for disease and premature death( Reference Candore, Caruso and Jirillo 1 , Reference Minihane, Vinoy and Russell 2 ). Knowledge about how lifestyle affects the inflammatory status is therefore of importance for health professionals if they are to reduce the risk of disease.
Soluble urokinase plasminogen activator receptor (suPAR) has been established as a stable marker of chronic inflammation and as a predictor of disease and mortality in the general population( Reference Thuno, Macho and Eugen-Olsen 3 – Reference Persson, Engstrom and Bjorkbacka 5 ). suPAR has also been shown to predict disease severity and mortality in acutely admitted medical patients( Reference Eugen-Olsen and Giamarellos-Bourboulis 6 , Reference Rasmussen, Ladelund and Haupt 7 ). It has previously been shown that the serum suPAR concentration in the general population is associated with lifestyle habits including alcohol (U shaped) and diet (linear)( Reference Eugen-Olsen, Ladelund and Sorensen 8 , Reference Haupt, Kallemose and Ladelund 9 ). The relationship between diet and inflammation is supported by several studies that show associations between healthy dietary patterns and lower serum concentrations of high-sensitivity C-reactive protein and IL-6( Reference Akbaraly, Shipley and Ferrie 10 – Reference Boden, Wennberg and Van Guelpen 13 ). Dietary habits are an important risk factor for CVD and overall mortality( Reference Sala-Vila, Estruch and Ros 14 – Reference Schulze and Hoffmann 18 ). This relates to dietary components as well as overall dietary quality. A healthy diet is recognised as a diet high in fruits, vegetables, fish and fibre and low in saturated animal fat. About a decade ago, it was noted that the study of dietary patterns is important because such patterns express the complex nature of a composite diet and the actions and interactions of the diet in the body more accurately than the study of single nutrients is able to( Reference Schulze and Hoffmann 18 ).
Though a relationship between overall dietary quality and suPAR has been shown earlier( Reference Haupt, Kallemose and Ladelund 9 ), a specific pattern for this relationship has not been established. The aim of this study was to investigate the relationship between dietary quality and suPAR in detail as well as to investigate the association of each of these factors with mortality and future IHD and stroke. This investigation was carried out using a large random sample of the general Danish population followed for 12 years.
Methods
Study population
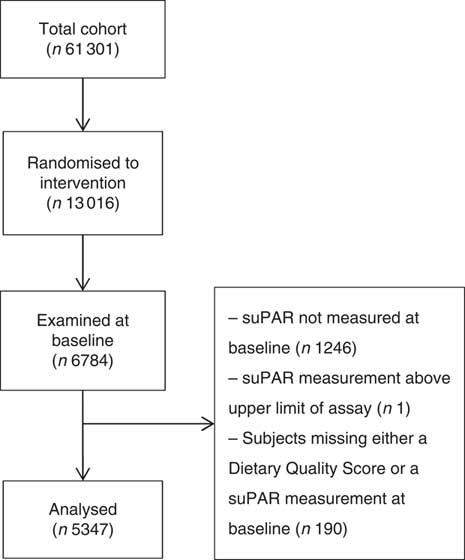
This study includes participants from the Inter99 study. Inter99 was a randomised intervention study investigating the effect of individual lifestyle counselling and group-based lifestyle education on the risk of CVD. Detailed design and results are presented elsewhere( Reference Jorgensen, Borch-Johnsen and Thomsen 19 , Reference Jorgensen, Jacobsen and Toft 20 ). In short, the Inter99 cohort comprised 61 301 randomly selected individuals aged 30–60 years from the southwestern area of the Capital Region of Denmark. Of these, 13 016 (21·2 %) were randomly assigned to the intervention group and 6784 (52·1 %) were examined at baseline in 1999–2001. We analysed the 5347 (78·8 %) of the examined participants who had both a suPAR measurement and a dietary quality score (DQS) available (Fig. 1). Characteristics of excluded participants are shown in online Supplementary Tables S1 and S2.

Fig. 1 Flowchart of study population. suPAR, soluble urokinase plasminogen activator receptor.
Data collection
The collection of data is described in detail elsewhere( Reference Jorgensen, Borch-Johnsen and Thomsen 19 , Reference Jorgensen, Jacobsen and Toft 20 ). In short, the participants answered a detailed questionnaire about demographics, lifestyle habits and healthcare contacts and underwent a physical examination at baseline. Fasting blood samples were drawn from all participants. Total cholesterol was measured instantly and the blood samples were stored at –80°C for later analysis of the remaining biomarkers( Reference Jorgensen, Borch-Johnsen and Thomsen 19 , Reference Jorgensen, Jacobsen and Toft 20 ). Efficient matching of collected data with the individual study participant was achieved through linking of the data to personal id numbers (Central Person Registry (CPR)-numbers)( Reference Pedersen 21 ).
Demographics
Data on sex and age were extracted from the Danish Civil Registration System using each participant’s CPR number. Socio-economic status was stratified into three groups based on the length of vocational training/tertiary education: <2 years (‘low’), 2–4 years (‘average’) and >4 years (‘high’).
Lifestyle habits
Lifestyle habits were self-reported by questionnaire. Dietary intake was measured using a validated self-administered forty-eight-item FFQ including questions about the intake of fruit, vegetables, fish and fat. From this, the DQS was calculated. The DQS was developed on the basis of Danish national dietary guidelines in 2007 by Toft et al. ( Reference Toft, Kristoffersen and Lau 22 ) using a forty-eight-item FFQ and validated against a 198-item FFQ. The DQS divides individuals into one of nine categories based on questions regarding the intake of fruits, boiled vegetables, raw vegetables, vegetable or vegetarian dishes, fish for lunch and fish for dinner, fat as spread and fat used at preparation. The categories of the DQS range from non-prudent (group 1) to prudent (group 9) dietary habits( Reference Toft, Kristoffersen and Lau 22 ). For fruit, vegetables and fish, the score was based on quantity; but for fat, points were assigned based on the type of fat. Baseline smoking habits were categorised as daily smoker (min. 1 cigarette/g tobacco per d), occasional smoker, former smoker or never smoker. Weekly alcohol consumption (in units of 12 g alcohol/week) was divided into four groups based on national health recommendations in 1999: abstinent (0 units/week), within recommendations (1–14 units/week for women, 1–21 units/week for men), borderline consumption (14–35 units/week for women, 21–35 units/week for men) and overuse (more than 35 units/week for all). Physical activity was defined as the sum of leisure time physical activity and the amount of the time spent on transportation to and from work, consisting of walking, running or biking( Reference von Huth Smith, Borch-Johnsen and Jorgensen 23 ). The sum was converted into minutes a week, using a 5-d working week, and was divided into four groups: 0–112·5, 142·5–225, 255–420 and 450–720 min/week.
Recording of endpoints
Data on endpoints were extracted from Danish registries using the participants’ unique CPR number. Deaths were extracted from the Danish Civil Registration System( Reference Pedersen 21 ), hospital admissions from the National Patient Registry( Reference Lynge, Sandegaard and Rebolj 24 ) and causes of death from the National Registry of Causes of Death( Reference Jorgensen, Jacobsen and Toft 20 , Reference Helweg-Larsen 25 ). IHD was defined as the International Classification of Diseases (ICD)-8 codes 410–414 or ICD-10 codes I20–I25 or as relevant cardiac surgery (bypass, recanalisation or reconstruction of coronary arteries). Stroke included both haemorrhagic and ischaemic stroke and was defined as the ICD-8 codes 430–434 or 436 or ICD-10 codes I60–I64 or I69( Reference Jorgensen, Jacobsen and Toft 20 ).
Biomarker measurements
The baseline plasma samples were collected in 1999–2001 and stored at –80°C until measurement of suPAR, which took place in 2011. suPAR levels were determined using the suPARnostic sandwich ELISA (ViroGates A/S)( Reference Haupt, Kallemose and Ladelund 9 ). One participant with a suPAR concentration above 22 ng/ml (upper limit of assay) was excluded from further analyses. The concentration of total cholesterol, HDL-cholesterol and TAG were determined on fresh unfrozen samples at baseline (1999–2001) by enzymatic techniques with the Hitachi 912 System (Roche Diagnostics)( Reference Jorgensen, Borch-Johnsen and Thomsen 19 ). The concentration of LDL-cholesterol was calculated by Friedewald’s equation( Reference Friedewald, Levy and Fredrickson 26 ). Participants had their weight and height measured, and BMI was calculated as weight (kg)/height (m)2 ( Reference Jorgensen, Borch-Johnsen and Thomsen 19 ).
Ethics
All participants provided written informed consent before taking part in the study. The study was approved by the local ethics committee (KA 98 155), by the Danish Data Protection Agency, and it was conducted in accordance with the Declaration of Helsinki. The study is registered with ClinicalTrials.gov (NCT00289237).
Statistics
Baseline characteristics were described by mean value, standard deviation and range for continuous variables and number of observations and percentages for categorical variables.
To guide the analysis plan, we created a directed acyclic graph (Fig. 2)( Reference Pearl 27 ). The graph contains all investigated factors, and arrows indicate a causal relation. This visualisation allowed for a ready identification of potential confounders. The causal pattern and adjustments for confounders enables the control for unknown confounding by closing all ‘backdoors’ in the directed acyclic graph( Reference Pearl 27 ). When assessing the total effect of diet on endpoints, we did not adjust for intermediary factors to avoid overadjustment biases and unnecessary adjustments( Reference Schisterman, Cole and Platt 28 ). From the directed acyclic graph, it is further visualised that adjusting for suPAR in an analysis of the dietary effect on endpoints provides an assessment of all effects of diet on endpoints that is not mediated by suPAR.

Fig. 2 Directed acyclic graph showing the hypothesised causality between the investigated factors and confounders. The causality relations of the factors are visualised by arrows. * Unmeasured confounders include genetic makeup and other known or unknown individual characteristics that affect behaviour and health. † Other lifestyle factors include smoking habits, alcohol consumption and physical activity. ‡ Cardiovascular event includes IHD and stroke. suPAR, soluble urokinase plasminogen activator receptor.
In the univariate analyses, we used one-way ANOVA to test the distributions of biomarkers (suPAR, total cholesterol, HDL-cholesterol and BMI) in the groups of the DQS. We tested the distributions of these biomarkers in the individual food groups as well, if an association with the DQS was found. The adjusted analyses were multiple linear regressions with log2-transformed suPAR, total cholesterol, HDL-cholesterol and BMI modelled as functions of sex, age, lifestyle factors (smoking habits, alcohol intake and physical activity) and the DQS (reference was DQS=group 5). In the adjusted analyses, we allowed for an interaction between sex and age. In addition, the effect of the DQS on biomarkers was modelled as a continuous variable, as the DQS showed no departure from trend (P=0·27–0·81). Estimates were back transformed by (2 β –1)×100 % and interpreted as percentage difference in biomarker concentration.
Data on endpoints are presented as mean follow-up time in years, number and percentage of participants who reached the specific endpoints, events per 1000 person years and, for IHD and stroke, the case fatality rates. We analysed time to IHD, stroke and death with cumulative incidence plots stratified by the DQS (dichotomised into ‘unhealthy diet‘ (scores 1–3) and ‘intermediate/healthy diet’ (scores 4–9)) and sex- and age-specific (≤45 or >45 years) suPAR quartiles. For both IHD and stroke, death was set as a competing endpoint. Log-rank tests were carried out to determine whether the cumulative incidence was different between the groups. Furthermore, time-to-event were analysed by the Cox proportional hazards method to estimate three effects: any total effect of DQS, any effect of DQS not going through changes in suPAR concentration and any total effect of suPAR. Thus, three models were devised for each endpoint:
(1) The total dietary effect with dichotomised DQS, sex, age and lifestyle factors as explanatory variables.
(2) The suPAR-adjusted dietary effect with dichotomised DQS, sex, age, lifestyle factors and suPAR concentration as explanatory variables.
(3) The total suPAR effect with suPAR concentration, sex, age, dichotomised DQS, lifestyle factors, total and HDL-cholesterol, blood pressure, prevalent diabetes mellitus and prevalent CVD as explanatory variables.
For all survival analyses, participants with prior IHD was excluded from analyses with IHD as the endpoint. The same approach was used for stroke. All Cox models were performed as single failure-time analyses. Data were right censored at the end of follow-up, and for IHD and stroke we used a censoring variable with three levels: 0 (no event in the follow-up period), 1 (event within the follow-up period) and 2 (death within the follow-up period). For death, we used a censoring variable with two levels: 0 (no event in the follow-up period) and 1 (death within the follow-up period). Time to event was measured from the date of enrolment into the study (between March 1999 and January 2001), and follow-up in national registries was carried out until 11th of July 2011. Time on study in days was used as the underlying timescale. We tested the potential interaction between age and diet and age and suPAR, respectively; the estimates are shown in online Supplementary Table S3.
To quantify the effect of missing values on the regression results, we did the following modelling: we performed each regression twice for each confounding variable containing missing values (physical activity, alcohol consumption and smoking status). First, we performed the regression excluding the variable of interest. Then, we performed the same regression but excluding participants with a missing value in the variable of interest. Last, we compared the estimates from the two regressions.
R 3.2.3 (R Foundation) and SAS 9.4 (SAS Institute) were used for statistical analyses. In the Cox regressions, the Efron approximation was used to handle tied observations.
Results
Cohort characteristics
In total, 5347 participants (51·5 % women, P=0·03) were included. Baseline characteristics are presented in Table 1.
Table 1 Characteristics of the study cohort at baseline (Numbers, percentages and ranges; mean values and standard deviations)

suPAR, soluble urokinase plasminogen activator receptor.
* Missing data are not shown.
Soluble urokinase plasminogen activator receptor and dietary quality score
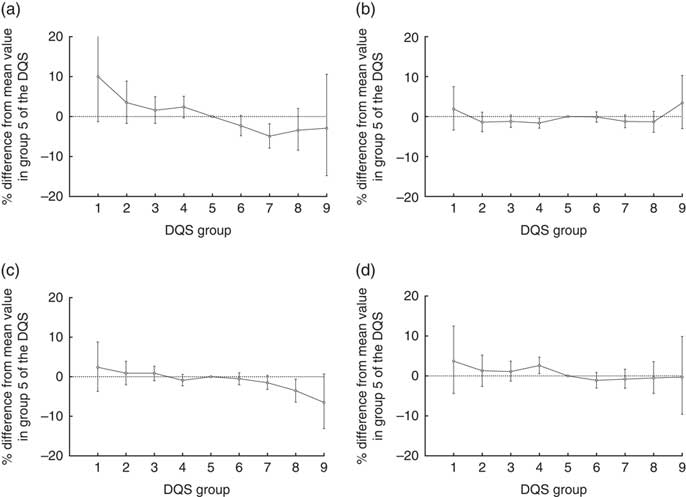
When suPAR concentrations were stratified according to the DQS groups and tested with one-way ANOVA, we found a significant difference in the means of the groups (Table 2; P<0·0001). When adjusted for sex, age and lifestyle factors (smoking habits, alcohol intake and physical activity) in the linear model, suPAR was associated with the DQS (β group1=10·0 (–1·3–22·6) %; β group9=–2·9 (–14·8–10·6) %; reference=group 5; P=0·0005; Fig. 3). The linear effect of the DQS on suPAR was a 1·6 % decrease (95 % CI 1·0, 2·3 %, P<0·0001) in suPAR per one step increase in DQS. When instead stratifying suPAR concentrations according to the food groups comprising the DQS (fruit, vegetables, fish and fat), we found a significantly different distribution of suPAR values between the healthy, intermediate and unhealthy group in each food group except in the ‘fish’ group (Table 3).
Table 2 Biomarker values distributed in dietary quality score (DQS) groups (Mean values and standard deviations)

suPAR, soluble urokinase plasminogen activator receptor.
* P values from the one-way ANOVA test of differences in biomarker level between groups of the DQS.

Fig. 3 Percentage differences in level of (a) soluble urokinase plasminogen activator receptor (suPAR), (b) BMI, (c) total cholesterol and (d) HDL-cholesterol between each group of the dietary quality score (DQS) and group 5. Adjusted for sex, age and smoking habits; 95 % CI indicated by error bars.
Table 3 Soluble urokinase plasminogen activator receptor (suPAR) values distributed in food component groups (Mean values and standard deviations)

* P values from the one-way ANOVA test of differences in suPAR concentration between subgroups in each food component group.
Cholesterol, BMI and dietary quality score
HDL-cholesterol was distributed significantly different between the groups of the DQS (Table 2; P<0·0001). This was not the case for total cholesterol (Table 2; P=0·10) nor BMI (Table 2; P=0·27). When adjusted for sex, age and lifestyle factors, borderline associations with the DQS were found for total cholesterol (β group1=2·4 (–3·7 to 8·8) %; β group9=–6·5 (–13·1 to 0·7) %; reference=group 5; P=0·07; Fig. 3) and HDL-cholesterol (β group1=3·7 (–4·4 to 12·5) %; β group9=–0·3 (–9·6 to 9·9) %; reference=group 5; P=0·07; Fig. 3). No association was found with BMI (β group1=1·9 (–3·4 to 7·5) %; β group9=3·24 (–3·0 to 10·3) %; reference=group 5; P=0·16; Fig. 3). The linear effect of the DQS was a 0·5 % (95 % CI 0·2, 0·9 %, P=0·007) decrease in total cholesterol and a 0·7 % (95 % CI 0·2, 1·2 %, P=0·0065) decrease in HDL-cholesterol per one step increase in DQS. BMI showed no association with the continuous version of the DQS. As none of the cardiovascular risk markers were significantly associated with the categorical DQS in the adjusted model, we did not examine the univariate distributions of these markers in the food groups.
Dietary quality score, soluble urokinase plasminogen activator receptor and risk of IHD, stroke and death
During 11·3 years of mean follow-up, 339 (6·3 %) were diagnosed with IHD (5·6/1000 person-years, case fatality rate=3·5 %), 189 (3·5 %) were diagnosed with stroke (3·1/1000 person-years, case fatality rate=2·1 %) and 215 (4·0 %) had died (3·6/1000 person-years). Fig. 4 shows cumulative incidence plots for IHD, stroke and death according to dichotomised DQS (unhealthy v. average/healthy) and sex- and age-specific suPAR quartiles. The DQS was significantly associated with IHD and mortality but not with stroke (Fig. 4(a)–(c)), whereas suPAR was significantly associated with stroke and mortality (Fig. 4(e) and (f)) and borderline associated with IHD (Fig. 4(d)). When adjusted for sex, age and lifestyle factors, low dietary quality showed no significant association with IHD risk, stroke risk or mortality (Table 4). Similar results were found in the suPAR-adjusted model (Table 4). The total effect of suPAR was a 13 (95 % CI 2, 25) % increase in the risk of stroke and an 18 (95 % CI 9, 26) % increase in the risk of death from any cause for each 1 ng/ml increase in suPAR, while no association was found between suPAR and IHD risk (Table 4).

Fig. 4 Kaplan–Meier estimate curves showing differences in IHD-free probability, stroke-free probability and survival probability between an unhealthy diet (![]() ) and an intermediate or healthy diet (
) and an intermediate or healthy diet (![]() , a–c) and between sex- and age-specific (≤45 years or >45 years) soluble urokinase plasminogen activator receptor (suPAR) quartiles (d–f) through the follow-up period of approximately 12 years. IHD-free and stroke-free probabilities are calculated, with death as a competing endpoint. Log-rank tests were performed and the χ
2 values and P values are listed by the corresponding graph. suPAR quartiles: Q1 (
, a–c) and between sex- and age-specific (≤45 years or >45 years) soluble urokinase plasminogen activator receptor (suPAR) quartiles (d–f) through the follow-up period of approximately 12 years. IHD-free and stroke-free probabilities are calculated, with death as a competing endpoint. Log-rank tests were performed and the χ
2 values and P values are listed by the corresponding graph. suPAR quartiles: Q1 (![]() ): 0·65–2·99 ng/ml; Q2 (
): 0·65–2·99 ng/ml; Q2 (![]() ): 2·52–3·64 ng/ml; Q3 (
): 2·52–3·64 ng/ml; Q3 (![]() ): 3·04–4·59 ng/ml; Q4 (
): 3·04–4·59 ng/ml; Q4 (![]() ): 3·79–21·2 ng/ml.
): 3·79–21·2 ng/ml.
Table 4 P values from the Cox proportional hazards method of comparing time to event at a low dietary quality compared with an intermediate or high dietary quality and at each 1 ng/ml change in soluble urokinase plasminogen activator receptor (suPAR) (Hazard ratios (HR) and 95 % confidence intervals)

Ref., reference.
* Adjusted for sex, age, smoking habits, alcohol intake and physical activity.
† Adjusted for sex, age, smoking habits, alcohol intake, physical activity and suPAR.
‡ Adjusted for sex, age, DQS, smoking habits, alcohol intake, physical activity, total cholesterol, HDL-cholesterol, blood pressure, prevalent diabetes mellitus and prevalent CVD.
Discussion
In this large cohort study of randomly selected individuals from the general population, we showed that the serum concentration of the inflammatory biomarker suPAR was inversely associated with the DQS. When following the participants for 12 years, a higher suPAR concentration was associated with greater risk of stroke and higher mortality but not with IHD risk.
To compare suPAR to established biomarkers of CVD risk, we examined the association of the DQS with total and HDL-cholesterol and BMI. None of these cardiovascular risk markers was associated with the DQS as a categorical variable adjusted for sex, age and lifestyle factors (smoking habits, alcohol intake and physical activity). When treated as a continuous variable, the DQS was associated with total and HDL-cholesterol, indicating that the dietary quality does affect plasma cholesterol concentration. Toft et al. ( Reference Toft, Kristoffersen and Lau 22 ) has investigated the association of the DQS with total and HDL-cholesterol and BMI in the same cohort and found a significant trend toward lower total cholesterol concentrations in subjects with higher DQS, but no association between the DQS and HDL-cholesterol or BMI. The difference between the findings by Toft et al. and our results may be due to the adjustment of alcohol intake and the smaller number of analysed participants in the present study. Both HDL-cholesterol and BMI are affected by intake of refined sugars( Reference Escola-Gil, Julve and Griffin 29 , Reference Malik, Pan and Willett 30 ), and since the DQS does not incorporate an estimation of refined sugar intake, we were unable to control for this effect. In addition, the DQS correlates with higher total energy intake( Reference Toft, Kristoffersen and Lau 22 ) but no unique estimation of this factor is available in the score. This made us unable to control for any effect of total energy intake on biomarker concentrations and to estimate the relative intake of the individual food groups comprising the DQS composite score. Both of these limitations of the DQS may have affected the results( Reference Willett, Howe and Kushi 31 ). In the categorical covariates (smoking status, alcohol consumption and physical activity), there was a varying degree of missing values. This could have affected the regression estimates. When analysing the individual food groups, suPAR varied significantly with fruit, vegetable and fat intake but not with fish intake. Fish intake within recommended dietary amounts is found to reduce CVD risk and inflammation in the general population( Reference Sala-Vila, Estruch and Ros 14 , Reference Mozaffarian, Lemaitre and King 32 , Reference Robinson and Mazurak 33 ), and suPAR is a marker of inflammation and cardiovascular events( Reference Thuno, Macho and Eugen-Olsen 3 , Reference Hodges, Bang and Wachtell 34 ). The lack of variation in mean suPAR concentration between the categories of fish intake is therefore somewhat surprising but may be explained by the univariate nature of the analysis and the limitations of the DQS mentioned above.
Regarding endpoints, we found that the DQS was not associated with the risk of IHD or stroke or with the mortality when adjusted for sex, age and lifestyle factors; adjusting for suPAR did not change the results. suPAR was found to associate strongly with mortality and weakly with stroke risk, when the total effect of a one-unit suPAR difference was examined. The association between suPAR and stroke risk after adjustment for blood pressure, which is the most important risk factor for stroke( Reference Wolf, D’Agostino and Belanger 35 ), is in agreement with another study showing suPAR as an independent predictor of ischaemic stroke( Reference Persson, Engstrom and Bjorkbacka 5 ). However, since stroke was included as a composite endpoint in the present study, we were unable to test whether suPAR only explained the difference in the risk of ischaemic and not haemorrhagic stroke or whether suPAR also predicts haemorrhagic stroke independently of blood pressure. Association between suPAR and IHD risk has been shown earlier in a large population cohort( Reference Persson, Ostling and Smith 36 ), and since suPAR is highly predictive of mortality( Reference Thuno, Macho and Eugen-Olsen 3 – Reference Rasmussen, Ladelund and Haupt 7 ), we speculate that the association between suPAR and IHD risk may be driven by high case fatality rates in historic cohorts( Reference Buch, Rasmussen and Gislason 37 – Reference Schmidt, Ulrichsen and Pedersen 39 ). Missing values regarding survival analyses generally seem to produce a slight underestimation of effect of diet on IHD risk and a slight overestimation of the effect of diet on stroke risk. The effect of suPAR on IHD and stroke and the estimates for all-cause mortality seems to be unaffected by the missing values. We also tested for interactions between age and DQS and age and suPAR, respectively. From the data presented in online Supplementary Table S3, it seems as though there generally is a tendency towards less importance of suPAR and more importance of dietary patterns in risk prediction in older individuals. The exception is IHD, where there seems to be less importance of diet with age. Dietary quality has previously been shown to predict mortality and CVD, but our results suggest that these endpoints are poorly predicted by the DQS. The DQS is, on the other hand, associated linearly with suPAR concentration, which in turn associates strongly with mortality. Thus, our study suggests that DQS may be associated with mortality, though this is only indicated through the association with suPAR concentration.
Perspectives
Results from this and other cohort studies have shown that suPAR is strongly associated with dietary quality, smoking habits and smoking cessation as well as other lifestyle factors( Reference Eugen-Olsen, Ladelund and Sorensen 8 , Reference Haupt, Kallemose and Ladelund 9 ). Considered together with the location of suPAR in the causal chain as represented in our directed acyclic graph, the before mentioned results make way to a new hypothesis: that suPAR can be seen as a marker of general health. A marker that sums up the influence of different predispositions, lifestyle factors and disease processes in a single mortality measure. Further, suPAR may reflect the combined health effect of all these factors including all possible interactions between them that the examination of the individual factors prevents us from quantifying.
Limitations
This study has certain limitations. It uses the cohort from the Inter99 study, which was not designed to show differences in suPAR or time to event between participants; therefore, associations may be underestimated. The cross-sectional design used to examine associations between diet and suPAR at baseline made us unable to determine whether a change in dietary habits causally affects the concentration of suPAR and in turn the risk of CVD or mortality. Likewise, we were unable to control for any changes in lifestyle or biomarkers through the 12 years of follow-up. Finally, the number of events with regard to incident stroke was low and results should therefore be cautiously interpreted and repeated in a larger study. This study was based on self-reported lifestyle data and may be affected by social desirability bias, misinterpretation of questions or mistakes in the reported answers. Furthermore, the categorisation of lifestyle habits based on the questionnaire used in the Inter99 study was limited in certain ways: we were not able to distinguish whether participants abstained from alcohol because of health-related reasons or as part of a healthy lifestyle; and we were not able to assess the energetic equivalents of exercise, as there was no detailed description of types of exercise for each individual. The DQS is based on a short FFQ of forty-eight items. This makes it a rough index of dietary habits and prevents inferences about the effect of dietary components. Furthermore, it may lead to misclassification bias with respect to the actual quality of the diet. To avoid such misclassification, the DQS was constructed according to the Danish national dietary recommendations and to index the intake of recommended food groups. Second, it was validated against a 198-item FFQ and the validation and performance of the DQS in risk prediction were evaluated against other dietary indexes including the healthy eating index. It was found that the DQS performed reasonably well in comparison with other scores and was well correlated with important measurements of a generally healthy diet: fibre, low intake of saturated fat, fruits, vegetables and fish( Reference Toft, Kristoffersen and Lau 22 ). In addition, the short formulation of the FFQ might have reduced non-response and thus reduced the risk of introducing bias( 40 ). As we use the DQS in the same cohort it is developed in, we run the risk of autocorrelation of results. On the other hand, it is advised to use an index developed with the diet of the examined population in mind to best fit the actual dietary patterns of that population( 41 , Reference Yokoyama, Takachi and Ishihara 42 ); the DQS was the best fitted tool for use in a Danish adult population that we had available. This study also has several strengths, including the high number of participants and the high validity of the registries used to track endpoints.
Conclusion
We showed that suPAR was strongly associated with the DQS, both in univariate and in adjusted analyses, whereas cholesterol and BMI were not. The DQS was not associated with IHD risk, stroke risk or mortality, when adjusted for sex, age and other lifestyle factors. suPAR was strongly associated with mortality and, to a lesser degree, with stroke risk, but not with IHD risk, when adjusted for sex, age, lifestyle factors and other cardiovascular risk factors. Further studies are needed to confirm the found relationship between dietary quality and suPAR – preferably by using other scoring methods and different cohorts. Longitudinal studies are needed to investigate a causal link between suPAR and dietary quality over time and whether a change in suPAR concentration due to changes in dietary habits in turn affects disease risk.
Acknowledgements
We are grateful to Christian Thorball and Tomasz Pielak for measuring samples for suPAR and to Thomas Kallemose for statistical assistance.
P. B. S. T. has received a scholar grant from Herlev Hospital. None of the other authors has any funding to declare. The kits for measuring suPAR were kindly donated by ViroGates. ViroGates had no influence on the design of the study, on the interpretation of data or on the decision to publicise the data.
C. P. and U. T. were involved in the design and execution of the Inter99 study; P. B. S. T., T. H. H. and J. E.-O. formulated the research question; P. B. S. T., T. H. H. and S. L. performed statistical analysis; P. B. S. T., T. H. H. and J. E.-O. wrote the article; and all authors read and commented on the paper and had primary responsibility for final content.
J. E.-O. is co-founder of, and shareholder in, ViroGates A/S, Denmark. ViroGates has an exclusive right to use patents on suPAR that are owned by Copenhagen University Hospital Hvidovre and, on these, J. E.-O. is one of the inventors. The remaining authors have no conflicts of interest to report.
Supplementary material
For supplementary material/s referred to in this article, please visit https://doi.org/10.1017/S0007114518003720