


Obesity is one of the major public health problems in the world and, in recent decades, has become a major risk factor for CVD, due to its association with cardiometabolic disorders such as dyslipidemia, insulin resistance and hypertension(Reference Caleyachetty, Thomas and Toulis1). However, some obese individuals have a healthier metabolic profile, characterised by normal insulin sensitivity, lipid profile, blood pressure and inflammation markers, despite their elevated fat mass. This condition is defined as metabolically healthy obesity(Reference Caleyachetty, Thomas and Toulis1–Reference Lee, Hee and Sung3). Similarly, normal-weight individuals are not necessarily protected from metabolic disorders associated with obesity and, when those occur, the individuals are characterised as metabolically unhealthy non-obese(Reference Caleyachetty, Thomas and Toulis1–Reference Lee, Hee and Sung3).
Different metabolic phenotypes may be expressed in individuals with the same BMI, which suggests that other determinants besides BMI may influence the clinical outcomes related to cardiometabolic health(Reference Gonçalves, Glade and Meguid4,Reference Kim, Park and Yang5) . As an example, research shows that the metabolically healthy phenotype in obese individuals may be a transient condition, influenced by age, environmental factors, lifestyle and body composition changes(Reference Gonçalves, Glade and Meguid4,Reference Stefan, Haring and Hu6) . Thus, identifying factors that can lead to metabolic disorders in normal-weight and overweight individuals could be important to prevent future CVD(Reference Lee, Hee and Sung3,Reference Hwang, Cho and Jeong7) .
Muscle mass is one of the body composition parameters that is closely related to insulin sensitivity and has recently been associated with metabolic disorders(Reference Rubio-Ruiz, Guarner-Lans and Pérez-Torres8,Reference Zhang, Lin and Gao9) . The impact of muscle mass deficit on health began to be studied in the 1990s, when research created skeletal muscle mass (SMM) indices or skeletal mass indices (SMI), based on body composition measurements assessed by dual-energy X-ray absorptiometry (DXA) or bioelectrical impedance(Reference Baumgartner, Koehler and Gallagher10,Reference Cruz-Jentoft, Bahat and Bauer11) .
SMI is a measurement of relative muscle mass. This method uses the appendicular lean mass (ALM) or the body SMM adjusted for body size in different ways, for example, using height squared, weight or BMI(Reference Baumgartner, Koehler and Gallagher10,Reference Cruz-Jentoft, Bahat and Bauer11) . The first studies with SMI associated the deficit of muscle mass with reduced functional capacity and physical fragility(Reference Baumgartner, Koehler and Gallagher10,Reference Cruz-Jentoft, Bahat and Bauer11) . More recently, studies have suggested a relationship between muscle mass deficit and cardiometabolic risk factors such as type 2 diabetes, hypertension, and the metabolic syndrome(Reference Zhang, Lin and Gao9,Reference Kim, Kim and Han12– Reference Lim, Kim and Kang15).
The association of SMM (by SMI) with the metabolic phenotype of normal-weight and overweight/obese individuals has still not been adequately explored and the results are uncertain(Reference Lee, Hee and Sung3,Reference Kim, Park and Yang5,Reference Hwang, Cho and Jeong7,Reference Xia, Dong and Gong16–Reference Ding, Liu and Shang20) . However, evidence indicates that it plays a key role in regulating glucose and lipid metabolism and releasing a wide variety of endocrine and autocrine active substances, which might prevent some harmful metabolic conditions(Reference Lee, Hee and Sung3,Reference Kim, Cho and Park21,Reference Stump, Henriksen and Wei22) .
The relation between SMM and metabolic phenotypes is divergent and variable among studies. Some studies have found that lower muscle mass is associated with a better metabolic profile in obese individuals and post-menopausal obese women(Reference Barbat-Artigas, Filion and Plouffe23–Reference Estrella, Pirzada and Durazo-Arvizu25). On the other hand, other studies show that in non-obese men and women, higher muscle mass or SMI is significantly associated with better metabolic profile,(Reference Lee, Hee and Sung3) and in non-obese men, muscle mass is inversely associated with metabolically unhealthy phenotype(Reference Hwang, Cho and Jeong7). Kim et al.(Reference Kim, Park and Yang5) suggested that the muscle mass deficit may be associated with different metabolic phenotypes according to BMI. Other studies also revealed a variable association of SMI with the phenotypes, depending on sex and age(Reference Hwang, Cho and Jeong7,Reference Xia, Dong and Gong16,Reference Ding, Liu and Shang20) .
Therefore, the aim of the present study was to evaluate the association of the SMI with the metabolically unhealthy phenotype in normal-weight and overweight/obese adults of both sexes.
Material and methods
Study design and participants
This population-based cross-sectional study was developed with a representative sample of the adult population in Viçosa, Minas Gerais, Brazil, conducted from 2012 to 2014. The study included adults 20–59 years old of both sexes who resided in the urban area of the city. Pregnant women, bedridden individuals, amputees, individuals on whom anthropometric or body composition measurements was impossible and individuals without the ability to answer the questionnaire were not included.
For the sample calculation, the following parameters were considered: reference population of 43 431 adults, 95% confidence level, expected prevalence of low muscle mass of 15 %(Reference Baumgartner, Koehler and Gallagher10), estimated sampling error of 3 % and effect of the estimated sampling design at 1·0. There was addition of 20 % related to losses or refusals and 10 % to control of confounding factors. The final calculated sample was 697 adults. In the end, 660 individuals were studied (Fig. 1).

Fig. 1. Flow chart of the study. DXA, dual-energy X-ray absorptiometry.
Probabilistic sampling was used without replacement, by double-stage clusters, with census tracts as the first-stage units and households as the second-stage units. A total of thirty census tracts were selected from the ninety-nine existing in the urban area of Viçosa, and in each case the blocks were identified and numbered to specify the order to start work.
The present study was conducted according to the declaration of Helsinki. The research project was approved by the Research Ethics Committee of the Federal University of Viçosa (ref. 02/2013). All participants signed the Informed Consent Form.
Study variables
Sociodemographic variables, health conditions and lifestyle
All of the participants underwent a structured interviewer-administered questionnaire about health conditions and current medication use, as well as sociodemographic and lifestyle variables, namely: age (years), sex (female and male), education (years of study), smoking (non-smoker, smoker and former smoker) and alcohol consumption (drinks per week: 0; 1–7; >8)(Reference Furlan-Viebig and Pastor-Valero26).
To assess the level of leisure-time physical activity (LTPA), the long-form International Physical Activity Questionnaire (IPAQ) version 6 was used(Reference Pardini, Matsudo and Araújo27). The LTPA was calculated from the time spent on LTPA in a normal week (IPAQ domain 4). Individuals who scored ≥ 150 min were classified as physically active and those with <150 min as insufficiently active or inactive(Reference Haskell, Lee and Pate28).
Anthropometric, clinical and body composition variables
Weight and height were measured with participants wearing as little clothing as possible and without shoes. Stadiometers were used to measure height and Tanita® digital scales for body weight. BMI was calculated using the weight/height2 equation. Waist circumference was measured using a thin inelastic tape measure positioned midway between the iliac crest and the last rib. Blood pressure was measured in duplicate on the same upper limb, with the first measurement after 5 min of rest and the second measure 15 min after the first. The mean of those two measurements was used.
Body composition was assessed by DXA, Lunar Prodigy Advance DXA System (GE Healthcare). All evaluations were performed by the same staff using the standard Incore Users’ Manual procedure. The precision quality was measured. The CV for lean mass of arms and legs ranged from 0·31 to 0·33 %.
The sum of the lean mass of the arms and legs was used to represent the ALM in kilograms. From ALM, we derived the SMI relative to weight (SMIweight: ALM/weight × 100, expressed in %)(Reference Janssen, Heymsfield and Ross29) and the SMI relative to the BMI (SMIBMI: ALM/BMI, expressed in kg/kg per m2)(Reference Studenski, Peters and Alley30). The body fat percentage (% fat) was also assessed by DXA. For regression analyses, the SMI were standardised in z score.
Biochemical variables
Blood samples were collected after 12 h of fasting. The fasting glucose was determined by the enzymatic method of glucose oxidase (CV 0·52, 1·06 %). Total cholesterol (CV 0·59, 2·75 %), TAG (CV 0·38, 0·78 %), and HDL-cholesterol (CV 0·11, 3·15 %) were measured by the Bioclin® kit colorimetric enzymatic method. Plasma insulin was determined by ELISA (Linco Research) (CV 2·1, 2·6 %), and insulin resistance was estimated by homoeostasis model assessment: homoeostatic model assessment of insulin resistance = fasting insulin × fasting glucose/22·5. Ultra-sensitive C-reactive protein was determined by immunoturbidimetry (Bioclin®, Quimbasa Basic Chemistry) (CV 0·79, 4·51 %).
Metabolic phenotypes
Participants were classified into four different phenotypes: (a) metabolically healthy normal weight, (b) metabolically unhealthy normal weight, (c) metabolically healthy overweight/obese and (d) metabolically unhealthy overweight/obese.
The definition of phenotypes was based on the criteria of Wildman et al.(Reference Wildman, Muntner and Reynolds2), in which individuals are considered metabolically unhealthy when they have two or more of the following cardiometabolic alterations: (1) systolic/diastolic blood pressure ≥ 130/85 mmHg or use of antihypertensive drugs; (2) TAG ≥ 1·71 mmol/l; (3) HDL < 1·03 mmol/l in men and < 1·29 mmol/l in women or use of lipid lowering medication; (4) fasting glucose ≥ 5·55 mmol/l or use of antidiabetic medication; (5) Insulin resistance: homoeostatic model assessment of insulin resistance > percentile 90 of the population and (6) ultrasensitive C-reactive protein > percentile 90 of the population. According to BMI, individuals were classified as normal weight (18·5 to 24·9 kg/m2) and overweight/obese (≥25 kg/m2). The latter group included the obese participants (BMI ≥ 30 kg/m2).
Statistical analysis
Descriptive analysis was presented through tables, as means and standard deviations for continuous variables, and frequencies and percentages for categorical variables, after testing the normal distribution of the variables with the Shapiro–Wilk test, skewness coefficient and graphical analysis. Differences between sexes and between phenotypes were analysed using Student’s t test for continuous variables, and Pearson’s χ 2 for categorical variables.
Logistic regression was used to estimate the association between the increase of 1 sd of each SMI (standardised explanatory variables in z score) and the metabolically unhealthy phenotype (variable response). In the adjusted models, the following variables were considered as potential confounders of the studied relationship: age, education, alcoholism, smoking and LTPA. OR with a 95 % CI was used as an association measure. Analyses were stratified by sex and BMI. The Hosmer–Lemeshow test was used to verify the final model fit, where P values above 0·05 indicate a good fit of the model and the likelihood ratio test, where a P value less than 0·05 indicates that the explanatory variable significantly predicts the dependent variable.
The interaction between sex and SMI was tested for normal-weight and overweight/obese phenotypes by adding multiplicative interaction terms to the adjusted model. We considered a P value less than 0·10 as significant for interaction terms.
Data analyses were performed using the STATA 13.1 statistical program. Level of significance for all statistical tests was set at 5 %.
Results
The sample was composed of 290 men and 370 women, with a mean age of 34·46 years and 37·39 years, respectively. The prevalence of each of the phenotypes was 44·24 (95 % CI 40·48, 48·06) % for metabolically healthy normal weight, 10·61 (95 % CI 8·47, 13·20) % for metabolically unhealthy normal weight, 21·52 (95 % CI 18·53, 24·82) % for metabolically healthy overweight/obese and 23·64 (95 % CI 20·54, 27·03) % for metabolically unhealthy overweight/obese. No difference was observed between men and women in the frequency of these phenotypes (Table 1). Analysis of metabolic characteristics that make up the phenotypes indicates that the men had a worse metabolic profile when analysing blood pressure and HDL-cholesterol, while women had the highest ultrasensitive C-reactive protein and homoeostatic model assessment of insulin resistance values (Table 1).
Table 1. Prevalence of phenotypes and metabolic characteristics of the total sample according to sex, Viçosa, Minas Gerais, Brazil, 2012–2014
(Percentages; mean values and standard deviations)

MHN, metabolically healthy normal weight; MUN, metabolically unhealthy normal weight; MHO, metabolically healthy overweight; MUO, metabolically unhealthy overweight; us-CRP, ultra-sensitive C-reactive protein; HOMA-IR, homoeostatic model assessment of insulin resistance; SBP, systolic blood pressure; DBP, diastolic blood pressure; FG, fasting glucose.
* Student’s t test or Pearson χ 2 test.
Tables 2 and 3 show that metabolically unhealthy individuals were older than metabolically healthy ones in both sexes, independent of BMI. Among overweight/obese women, those who were metabolically unhealthy were less educated than those who were metabolically healthy. When evaluating SMI among men, those classified as metabolically unhealthy, both normal weight and overweight/obese had lower values than those metabolically healthy. In addition, they had higher body fat percentage and higher waist circumference. No significant differences were observed in the SMI and the body fat percentage in women’s metabolic phenotypes. However, metabolically unhealthy women had higher waist circumference.
Table 2. Characteristics of men, according to different phenotypes, Viçosa, Minas Gerais, Brazil, 2012–2014
(Percentages; mean values and standard deviations)

MHN, metabolically healthy normal weight; MUN, metabolically unhealthy normal weight; MHO, metabolically healthy overweight; MUO, metabolically unhealthy overweight; LTPA, leisure-time physical activity; SMI, skeletal mass index; WC, waist circumference.
* Student’s t test or Pearson χ 2 test among normal-weight individuals (metabolically healthy v. unhealthy).
† Student’s t test or Pearson χ 2 test among overweight individuals (metabolically healthy v. unhealthy).
Table 3. Characteristics of women, in accordance with the different phenotypes, Viçosa, Minas Gerais, Brazil, 2012–2014
(Percentages; mean values and standard deviations)
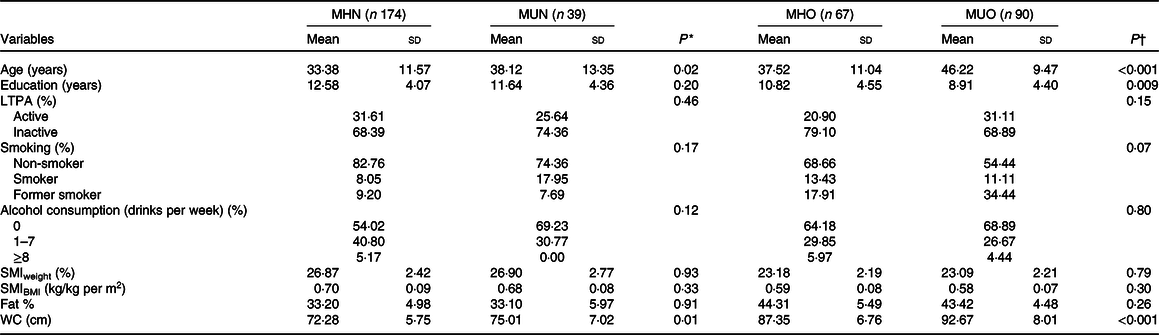
MHN, metabolically healthy normal-weight; MUN, metabolically unhealthy normal-weight; MHO, metabolically healthy overweight; MUO, metabolically unhealthy overweight; LTPA, leisure-time physical activity; SMI, skeletal mass index; WC, waist circumference.
* Student’s t test or Pearson χ 2 test among normal-weight individuals (metabolically healthy v. unhealthy).
† Student’s t test or Pearson χ 2 test among overweight individuals (metabolically healthy v. unhealthy).
Among both women and men, the characteristics related to lifestyle, smoking, alcohol consumption, and LTPA were not statistically different between phenotypes.
Among men, after adjusting for age, education, smoking, alcohol consumption and LTPA, SMIweight was inversely associated with the metabolically unhealthy phenotype, both in normal-weight individuals (OR 0·49, 95 % CI 0·24, 0·99) and overweight/obese ones (OR 0·32, 95 % CI 0·16, 0·64). The SMIBMI was inversely associated with the metabolically unhealthy phenotype in overweight/obese men (OR 0·36, 95 % CI 0·18, 0·72), but not in normal-weight individuals (OR 0·70, 95 % CI 0·34, 1·43). Women did not exhibit significant association between SMI and metabolic phenotypes (Table 4).
Table 4. Association between the skeletal mass indices* and metabolically unhealthy phenotype, according to sex and BMI, Viçosa, Minas Gerais, Brazil, 2012–2014†
(Odds ratios and 95 % confidence intervals)
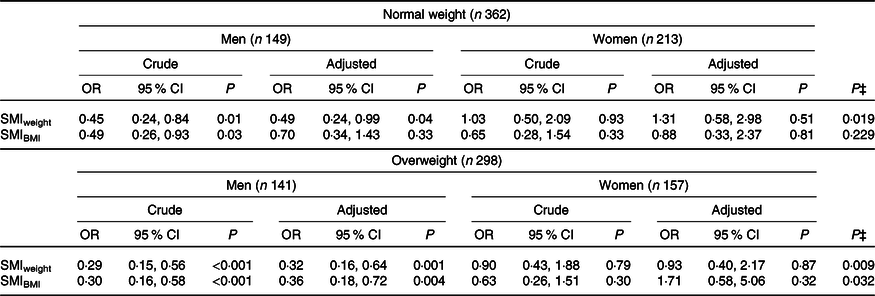
SMI, skeletal mass index.
* Standardised in z score.
† Adjustment variables: age, education, alcohol consumption, smoking and level of physical activity in leisure time.
‡ P value for interaction with sex.
Significant interaction with sex was observed for SMIweight in normal-weight and overweight/obese individuals and for SMIIMC among overweight/obese individuals (P for interaction< 0·10) (Table 4).
Discussion
This is the first Brazilian population-based study that analysed the association between SMI and metabolic phenotypes in normal-weight and overweight/obese adults, which was not limited to the evaluation of individuals with muscle mass deficit.
In the present study, SMI was inversely associated with metabolically unhealthy phenotype among men after adjustment for age, education and life habits, except for SMIBMI in normal-weight men. This association was not found in women, regardless of BMI. In addition, compared with the healthy phenotype, metabolically unhealthy men, regardless of BMI, had lower SMI values and higher fat percentage; unlike women, where we did not find a significant difference.
The results of the present study demonstrate that a lower muscle mass, evidenced by the SMI, is a possible explanation for the existence of the metabolic unhealthy phenotypes in normal-weight and overweight/obese men. The exact explanations and mechanisms involved in the relationship between muscle mass and metabolically unhealthy phenotype have not been fully elucidated. The skeletal muscle is a major metabolically active tissue, closely related to insulin sensitivity and glucose uptake. Furthermore, the skeletal muscle is also considered an active endocrine organ, releasing myokines, stimulating lipolysis and promoting decreased obesity(Reference Lee, Hee and Sung3,Reference Stump, Henriksen and Wei22,Reference Tournadre, Vial and Capel31) . In addition, active lifestyle associated with preserved SMM may help the metabolic health of individuals. Thus, greater SMM may be able to maintain individuals’ metabolic homoeostasis and protect them from a metabolic unhealthy phenotype. However, the beneficial metabolic effects of SMM may depend on the specific population studied. Our findings do not reveal the influence of muscle mass in the phenotypic expression of adult women.
The absence of an association between SMM and metabolic phenotypes among women has also been reported in studies with a wide age range of women, from childhood to post-menopause, regardless of BMI(Reference Poggiogalle, Lubrano and Gnessi17–Reference Ding, Liu and Shang20). One study of healthy post-menopausal women suggested a predominant effect of fat distribution on women’s metabolic profile, outperforming the contribution of other body composition parameters, like muscle mass, in determining the metabolically unhealthy phenotype(Reference Peppa, Koliaki and Boutati18). In our sample, significantly higher waist circumference values were found in metabolically unhealthy women compared with metabolically healthy women, despite similar values for the percentage of body fat. On the other hand, we did not find a difference in SMI among women with different metabolic phenotypes.
A longitudinal study with Korean adults revealed that greater SMM, assessed by bioimpedance and using SMIweight, plays a protective role against progression from metabolically healthy phenotype to metabolically unhealthy phenotype in normal-weight men and women(Reference Lee, Hee and Sung3). Xia et al.(Reference Xia, Dong and Gong16), using the same method, also demonstrated an inverse association between greater muscle mass and metabolically unhealthy phenotype in Chinese normal-weight females and males. This same study noticed a mitigation of muscle mass association with the metabolically unhealthy phenotype in women over 60 years of age(Reference Xia, Dong and Gong16).
Therefore, the association between muscle mass and phenotypes clearly varies according to sex, age, SMI assessment methodology and BMI. In addition, metabolic determinants related to body composition in men and women and in obese and non-obese differ significantly between studies(Reference Stefan, Haring and Hu6,Reference Peppa, Koliaki and Papaefstathiou19) .
The different tools used to measure muscle mass are possible explanations for divergent results between studies, as some use bioimpedance, magnetic resonance and computed tomography instead of DXA(Reference Lee, Hee and Sung3,Reference Kim, Park and Yang5,Reference Xia, Dong and Gong16,Reference Estrella, Pirzada and Durazo-Arvizu25) . In addition, the use of the SMI varies between studies(Reference Poggiogalle, Lubrano and Gnessi17,Reference Peppa, Koliaki and Papaefstathiou19,Reference Ding, Liu and Shang20) , as there is still no consensus on the most appropriate index to determine the degree of muscle mass deficit or which one is most associated with cardiometabolic outcomes(Reference Kim, Jang and Lim32). Few studies compare these indices and the conclusions are discordant(Reference Scott, Park and Kim13,Reference Kim, Jang and Lim32,Reference Furushima, Miyachi and Iemitsu33) .
To measure these indices, several definitions are suggested, most of them using the ALM adjusted for height(Reference Baumgartner, Koehler and Gallagher10), weight(Reference Janssen, Heymsfield and Ross29) or BMI(Reference Studenski, Peters and Alley30). In the present study, SMI adjusted for body weight and BMI were used, since research that analysed the association and correlation between muscle mass and cardiometabolic diseases has demonstrated the superiority of SMIweight and SMIBMI over SMIheight (Reference Lim, Kim and Kang15,Reference Furushima, Miyachi and Iemitsu33–Reference Lee, Hong and Shin35) . The fact that SMIheight does not consider adipose mass in its adjustment may result in overestimated muscle mass in overweight and obese individuals and impair muscle mass assessment in the context of cardiometabolic risk in this sample(Reference Newman, Kupelian and Visser36).
Among normal-weight men in the present study, the association between SMIBMI and the metabolically unhealthy phenotype lost significance in the adjusted models. There are no studies correlating SMIBMI with the metabolic phenotypes in normal-weight or overweight/obese individuals. Likewise, studies of this index in the context of cardiometabolic diseases(Reference Scott, Park and Kim13,Reference Furushima, Miyachi and Iemitsu33,Reference Kim, Park and Lee34,Reference Kim, Lee and Jun37) are rare, although these studies already indicate the importance of SMIBMI in identifying of the muscle mass deficit and in predicting cardiometabolic risk.
Compared with the rare studies that evaluated the association between SMI or muscle mass and metabolic phenotypes in adults(Reference Lee, Hee and Sung3,Reference Kim, Park and Yang5,Reference Hwang, Cho and Jeong7,Reference Xia, Dong and Gong16) , our study was the only one that could demonstrate the inverse and significant association between SMI and metabolically unhealthy phenotype in overweight/obese men. This relationship among overweight or obese individuals was not observed in other studies.
This finding can be explained by the average age of our sample, which was about 30 to 40 years old, lower than what was reported in previous studies, which was between 50 and 60 years. In the population over 50–60 years, the deleterious effect of adiposity in overweight or obese individuals may be more important than the beneficial effects of muscle mass(Reference Lee, Hee and Sung3). In addition, myosteatosis, which refers to fat infiltration into muscle tissue, is associated with increased insulin resistance, increased oxidative stress, mitochondrial dysfunction and consequently greater metabolic dysfunction, reducing the benefits of muscle mass in maintaining metabolic balance in elderly and obese individuals(Reference Lee, Hee and Sung3,Reference Taaffe, Henwood and Nalls38) .
The prevalence of phenotypes has been shown to be quite variable and in the present study they are within the variations of the literature(Reference Wildman, Muntner and Reynolds2,Reference Wang, Zhuang and Luo39,Reference Lin, Zhang and Zheng40) . The meta-analysis conducted by Wang et al.(Reference Wang, Zhuang and Luo39) found a prevalence of metabolically healthy obese ranging between 1·3 and 25·8 % in the population above 18 years, with highest values among young people and women. A large difference exists between populations worldwide with the highest prevalence of metabolically healthy obese found in the American population(Reference Wang, Zhuang and Luo39). The prevalence of metabolically unhealthy phenotype with normal weight ranged from 6·6 to 45·9 %, with the highest prevalence observed among older individuals, among men, and Europeans(Reference Wang, Zhuang and Luo39).
To date, there is no uniform criterion for the diagnosis of metabolic phenotypes. Studies use different definitions of metabolically unhealthy phenotype, which may explain the variability in estimates of phenotype prevalence. It is important to acknowledge that there is no specific definition for the Brazilian population. In this paper, we use the definition proposed by Wildman et al.(Reference Wildman, Muntner and Reynolds2), which was created from a large epidemiological study, the National Health and Nutrition Examination Surveys (NHANES), 1999–2004, with representativeness of the White, Black and Latin American population in the USA and is the most widely used by researchers.
As in the two meta-analyses cited(Reference Wang, Zhuang and Luo39,Reference Lin, Zhang and Zheng40) in the present study, both in normal-weight and overweight/obese individuals, the mean age of metabolically unhealthy phenotype individuals was significantly higher than the healthy phenotype. This finding reinforces the hypothesis that age is one of the factors that favours the onset of metabolic abnormalities in predisposed individuals and even with the hypothesis of transient metabolic stability in obese individuals(Reference Gonçalves, Glade and Meguid4,Reference Stefan, Haring and Hu6) .
A limitation of the present study is the possibility of reverse causality since it is a cross-sectional study. In addition, dietary information was not evaluated, which could act as a potential confounder. Other characteristics such as muscle quality, muscle strength and physical performance that were not evaluated made it impossible for us to assess the current definition of sarcopenia and its association with nutrition(Reference Cruz-Jentoft, Bahat and Bauer11). The use of a definition of metabolic phenotypes based on a database from the USA can be considered a limitation when studying people in Brazil. Finally, although our study was carried out with a representative sample of adults from a city of Minas Gerais, caution should be taken in extrapolating the results to the whole Brazilian population, taking into account the size of our country and the different characteristics of each region.
In our analysis, higher muscle mass was significantly associated with a lower chance of metabolically unhealthy phenotype expression in normal-weight and overweight/obese men. Given the scarcity of studies on this issue, the real role of muscle mass deficit in determining the metabolic phenotype of individuals must still be clarified.
In conclusion, our results reveal that muscle mass assessed from the SMI adjusted by weight and BMI was inversely associated with metabolically unhealthy phenotype in overweight/obese adult men. In normal-weight men, this association was verified when the SMIweight was used, but not with SMIBMI. These findings corroborate with evidence about the importance in preserving metabolic and muscle health in overweight/obese and normal-weight individuals. With a multidisciplinary approach, including both pharmacological and non-pharmacological interventions like exercises and a nutritional intervention, muscle mass deficit may be an important therapeutic target for reducing adverse profile of metabolically unhealthy patients. However, the lack of association observed between SMI and metabolically unhealthy phenotype in women, the heterogeneous definition of phenotypes, and the divergence in the evaluation of muscle mass indicate the need for further studies to clarify the role of this body compartment in predicting cardiometabolic outcome.
Acknowledgements
We would like to thank all the adults participating in the study, as well as the collaborators of the ESA project. We would also like to thank the health division of the Federal University of Viçosa.
The present study was not sponsored by any pharmaceutical company. The ESA project was supported by the National Council for Scientific and Technological Development – CNPq (grant number 481418/2011-3) and the Foundation for Supporting Research in the State of Minas Gerais – Fapemig (grant number APQ-00296-12).
C. J. C. contributed to the study design and data analyses, wrote the initial draft of the manuscript and assembled the final version. G. Z. L., L. L. J. and A. Q. R. contributed to the study design, analyses design and data analyses and participated in the approval of the final version of the manuscript. K. J. S. contributed to the data collection and participated in the approval of the final version of the manuscript. A. M. K. and P. F. P. contributed to the study design and participated in the approval of the final version of the manuscript.
The authors declare that there are no conflicts of interest.


