


Environmental changes have important impacts on all species, and broilers seem to be particularly sensitive to temperature-associated environmental challenges, especially heat stress. It has been suggested that modern broiler genotypes produce more body heat, as a result of their greater metabolic activity( Reference Deeb and Cahaner 1 ), and most broiler production occurs in tropical and subtropical regions( Reference Windhorst 2 ), where chronic heat stress seriously affects the broiler industry. Chronic heat stress can decrease the feed intake of broilers, increase their maintenance requirements and induce a negative energy balance. In addition, heat-exposed chickens have been reported to exhibit lower growth rates and feed efficiency and greater fat deposition than pair-fed birds exposed to thermoneutrality( Reference Geraert, Padilha and Guillaumin 3 ). When considering their state of negative energy balance, the decreased growth and increased fat deposition observed in heat-exposed chickens seems contradictory and suggests that heat-stressed broilers initiate some special post-absorptive metabolic changes( Reference Geraert, Padilha and Guillaumin 3 ). However, the metabolic changes of heat-exposed broilers are intricate and multifactorial, and the regulatory mechanisms remain unclear.
Metabolomics provides a powerful platform for identifying small molecular metabolites in biological samples (biofluids or tissues) using high-throughput approaches( Reference He, Kong and Wu 4 , Reference Bujak, Struck-Lewicka and Markuszewski 5 ). The identification and integrative analysis of these metabolites can facilitate the characterisation of metabolism at the molecular and cellular levels and comprehensively reveal the change rule and related mechanisms of the biosystem affected by internal or external stimulating conditions( Reference Patti, Yanes and Siuzdak 6 ). Thus, this technology is expected to provide novel insight into the effects of heat stress on the metabolism of broilers. Among the methods used in metabolomics, GC-MS has been used extensively, owing to its high resolution and detection sensitivity, for metabolic profiling in a variety of biological samples( Reference Li, Ni and Su 7 ). However, the metabolomics of birds remains poorly understood, and most metabolomics studies have been focused on mammals.
The aim of the present study was to characterise the serum metabolic profile of heat-stressed broilers and to investigate the change rule and related regulatory mechanisms using GC-MS techniques, biochemical validation and multivariate data analysis. The study also aimed to elucidate the relationships between growth performance, carcass composition and metabolic changes in heat-stressed broilers.
Methods
Birds, husbandry and experimental design
All experimental procedures involving the use of animals were approved by the Animal Care Committee of Nanjing Agricultural University, Nanjing, P.R. China. In all, 200 newly hatched male broilers (Arbor Acres) were obtained from a commercial hatchery and raised in battery brooders. From 1 to 21 d of age, the birds received commercial standard diets and husbandry.
At 22 d of age, 144 chicks with similar body weights were selected and randomly allocated to three different environment-controlled chambers. After 7 d of acclimation, the birds were separated equally into three groups, with six cages per group and eight chickens per cage. The normal control (NC) group was kept at 22°C ambient temperature (thermoneutrality) and provided ad libitum access to feed, whereas the heat stress (HS) group was reared at 32°C and provided ad libitum access to feed. Meanwhile, the pair-fed (PF) group was maintained at 22°C and provided with feed amounts that were equal to the those consumed by the HS group on the previous day. More specifically, the average feed intake was measured for the HS group each day, and this exact amount was offered to the PF group on the following day. The PF group was designed to understand the effects of heat stress on performance, carcass and serum metabolites independent of the reduction in feed intake. The relative humidity of all the chambers was maintained at 55±5 %, and all birds received the same feed, a common commercial grower feed (19 % crude protein and 13·20 MJ metabolisable energy/kg) and ad libitum access to water.
Data collection and sampling
Daily feed intake was measured at 09.00 hours, and the live weights of the broilers were recorded at 28, 35 and 42 d of age. The average daily gain (ADG), average daily feed intake (ADFI) and feed:gain (F:G) ratio were calculated on a per-cage basis. After 2 h, 3 d, 7 d and 14 d of heat exposure, the cloacal temperatures of two randomly selected birds from each cage were measured at 10.00 hours using a rectal probe. The probes were inserted approximately 50 mm beyond the cloacal sphincter and allowed to equilibrate for a minute. At 42 d of age, 36 birds were selected (two from each cage), and a blood sample was drawn from the wing vein of each bird. Serum was obtained by centrifugation at 4000 g for 10 min at 4°C and was stored at –80°C. Immediately after the blood samples were taken, the broilers were killed by cervical dislocation and exsanguination.
Dissection procedure
After being plucked mechanically, the broiler carcasses were weighed, and the bilateral breast muscles and legs were removed, according to the standard method of dissection( Reference Jensen 8 ). Abdominal fat, including the fat tissues surrounding the proventriculus and gizzard and those lying against the inside abdominal wall and around the cloaca, was collected( Reference Ain Baziz, Geraert and Padilha 9 ), and the subcutaneous fat of the leg was removed and weighed as described previously( Reference Ain Baziz, Geraert and Padilha 9 – Reference Bochno, Michalik and Murawska 11 ). In brief the subcutaneous fat, which included the skin and associated subcutaneous fat of the thigh and drumstick and the fat associated with the sartorius muscle, were removed carefully by lifting the skin and slowly scraping the undersurface with a scalpel( Reference Ricard, Leclercq and Touraille 10 ); the fat associated with the sartorius muscle was removed carefully using forceps( Reference Bochno, Michalik and Murawska 11 ). After removing all dissectible fat depots, a muscle sample was taken from the right thigh of each specimen and frozen, in order to measure the intramuscular fat( Reference Ricard, Leclercq and Touraille 10 ). Later, the samples were thawed, and the total lipid contents of the samples were determined gravimetrically after extraction( Reference Folch, Lees and Sloane Stanley 12 ). Dissected fat, breast muscle and legs were weighed, and the proportions of breast muscle, legs and abdominal fat in the carcasses and the proportions of subcutaneous fat in the leg and intramuscular fat in thigh muscle were calculated.
Sample preparation
The serum samples stored at −80°C were thawed at room temperature and prepared as previously described( Reference Ren, Yin and Gao 13 ), but with some modifications. In brief, 80 μl of each serum sample was added to a 1·5-ml Eppendorf tube that contained 10 μl 2-chloro-l-phenylalanine (0·3 mg/ml in methanol; Hengchuang Biotech), an internal quantitative standard, and vortexed for 10 s. Subsequently, 240 μl of an ice-cold 2:1 (v:v) mixture of methanol and acetonitrile was added to each tube, and the tubes were then vortexed for 1 min, ultrasonicated at ambient temperature (25–28°C) for 5 min, and chilled at −20°C for 10 min. The resulting extracts were centrifuged at 12 000 rpm at 4°C for 10 min. A quality control (QC) sample was prepared by mixing aliquots of all the samples into a pooled sample. Aliquots (250 μl) of the supernatants were transferred to individual glass sampling vials, vacuum-dried at room temperature, mixed with 80 μl methoxylamine hydrochloride (15 mg/ml in pyridine), vortexed vigorously for 2 min, and then incubated at 37°C. After 90 min, 80 μl N,O-bis(trimethylsilyl) trifluoroacetamide (BSTFA+TMCS 99:1) and 20 μl n-hexane (CNW Technologies GmbH) was added to each mixture, and the mixtures were vortexed vigorously for 2 min and derivatised at 70°C for 60 min. The samples were kept at ambient temperature (25–28°C) for 30 min before GC-MS analysis.
GC-MS analysis
The derivatised serum samples were analysed using an Agilent 7890B GC system coupled to an Agilent 5977A MSD system (Agilent Technologies Inc.), and a DB-5MS fused-silica capillary column (30 m×0·25 mm×0·25 μm; Agilent J & W Scientific) was used to separate the derivatives. He (>99·999 %) was used as the carrier gas, at a constant flow rate of 1 ml/min, and the injector temperature was maintained at 260°C. The injection volume was 1 μl by splitless mode, and the solvent delay time was 5 min. The column temperature was increased from 50 to 125°C at a rate of 15°C/min, increased to 210°C at a rate of 5°C/min, increased to 270°C at a rate of 10°C/min, increased to 305°C at a rate of 20°C/min, and then kept at 305°C for 5 min. The MS quadrupole temperature was set to 150°C, and the ion source temperature was set to 230°C. The collision energy was 70 eV. Mass data were acquired using a full-scan mode (m/z 50–450). The QC sample was injected at regular intervals (every twelve samples) throughout the analytical run, in order to assess repeatability.
Biochemical assays
The serum concentrations of uric acid (no. C012) and NEFA (no. A042) were measured using commercial diagnostic kits (Nanjing Jiancheng Bioengineering Institute), according to the manufacturer’s instructions.
Data processing and analyses
Statistical analyses of cloacal temperature, growth performance, carcass composition and serum biochemical parameters were performed using SPSS 19.0 (SPSS Inc.). The data were checked for normal distribution and homogeneity of variance using the Shapiro–Wilk and Levene’s tests, respectively. Data that were normally distributed and exhibited homogeneity of variance were analysed using one-way ANOVA and Fisher’s least significant difference (LSD) test. Data were expressed as means and standard deviations, and significance was set at P<0·05.
ChemStation (version E.02.02.1431; Agilent) was used to convert the file format of the raw data to common data format, and ChromaTOF (version 4.34; LECO) was used to analyse the data. The metabolites were identified qualitatively from the NIST and Fiehn databases. Normalised data were imported into the SIMCA software package (14.0; Umetrics), and after mean-centring and unit variance scaling, both principal component analysis (PCA) and orthogonal projections to latent structures discriminant analyses (OPLS-DA) were performed to visualise differences in the metabolism of the experimental groups. The Hotelling’s T2 region, which is drawn as an ellipse in the score plots of the models, defines the 95 % CI of the modelled variation. The overall quality of the model for the data sets was assessed using cumulative R 2 Y, which is defined as the proportion of variance in Y explained by the predictive component of the model, and cumulative Q 2, which is defined as the class prediction ability of the model obtained by the cross-validation default method (7-fold cross-validation). Higher R 2 Y (cum) and Q 2 (cum) values indicate better separation between the lines. Variable importance in the projection (VIP) ranks the overall contribution of each variable to the OPLS-DA model, so variables with VIP values of >1 were considered relevant for group discrimination. Differential metabolites were selected based on the combination of statistically significant VIP values and P values from a two-tailed Student’s t test of the normalised peak areas, that is, metabolites with VIP values of >1 and P values of <0·05, and were further identified and performed functional enrichment analysis using Metabolites Biological Role (MBROLE, http://csbg.cnb.csic.es/mbrole2), according to Javier et al. ( Reference Javier, Florencio and Mónica 14 ).
Pearson’s correlation coefficients were calculated to determine correlations among growth performance, carcass composition and differential metabolites of the NC and HS groups.
Results
Cloacal temperature
As shown in Fig. 1, cloacal temperature of the HS group was significantly higher than that of the two other groups at all four different points in time (P=0·002, 0·031, 0·009 and 0·023 at 2 h, 3 d, 7 d and 14 d of heat exposure, respectively; Fig. 1), and there was no significant difference in cloacal temperature of the NC and PF groups.

Fig. 1 Effects of heat exposure duration on the cloacal temperature of broilers. Values are means (n 6), and standard deviations represented by error bars. ![]() , normal control;
, normal control; ![]() , heat stress (HS);
, heat stress (HS); ![]() , pair-fed. * Significant difference between the HS group and the other two groups (P=0·002, 0·031, 0·009 and 0·023 at 2 h, 3 d, 7 d and 14 d of heat exposure, respectively).
, pair-fed. * Significant difference between the HS group and the other two groups (P=0·002, 0·031, 0·009 and 0·023 at 2 h, 3 d, 7 d and 14 d of heat exposure, respectively).
Growth performance
Table 1 summarises the growth performance parameters of the broilers. Constant heat stress decreased the growth performance of the broilers. The ADG and ADFI of the HS group were significantly lower than those of the NC group, by 28·76 and 18·42 %, respectively (P<0·001), and the F:G ratio was significantly higher, by 14·49 % (P=0·003). In addition, the ADG of the HS group was significantly lower than that of the PF group based on the same feed intake, by 9·64 % (P=0·020), and the F:G ratio of the HS group was significantly higher than that of the PF group, by 9·87 % (P=0·026). Although the ADG of the NC group was higher than that of the PF group (P<0·001), there was no significant difference in F:G ratios of the two groups (P=0·303).
Table 1 Effects of heat exposure on the growth performance of broilers (Mean values and standard deviations)
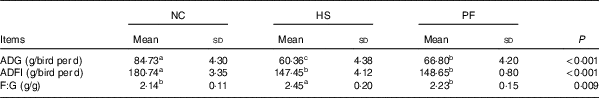
NC, normal control group; HS, heat stress group; PF, pair-fed group; ADG, average daily gain; ADFI, average daily feed intake; F:G, feed:gain ratio.
a,b,c Mean values within a row with unlike superscript letters were significantly different (P<0·05).
Carcass characteristics
The proportions of breast muscle, leg and abdominal fat in the broiler carcasses, as well as the proportions of subcutaneous fat and intramuscular fat in the broiler legs and thigh muscle, respectively, are shown in Table 2. Heat stress significantly increased the leg (P=0·027) and intramuscular fat proportions (P<0·001), when compared with the NC group, and significantly decreased the breast proportion (P=0·009). There was a tendency for on the proportion of abdominal fat to increase in the HS group compared with the NC group (P=0·056). In addition, the proportions of abdominal fat (P=0·001), subcutaneous fat (P=0·009) and intramuscular fat (P<0·001) of the HS group were significantly higher than those of the PF group.
Table 2 Effects of heat exposure on the carcass characteristics of broilers (Mean values and standard deviations)
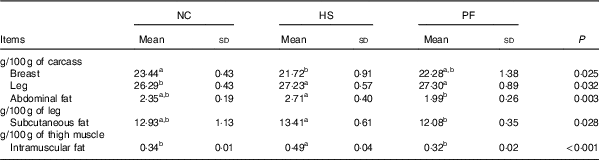
NC, normal control group; HS, heat stress group; PF, pair-fed group.
a,b Mean values within a row with unlike superscript letters were significantly different (P<0·05).
Metabolomics profiling of samples
Representative GC-MS total ion chromatograms chromatograms of samples from the NC, HS and PF groups are shown in Fig. 2. In total, 680 valid peaks and 257 metabolites were identified in the serum samples.
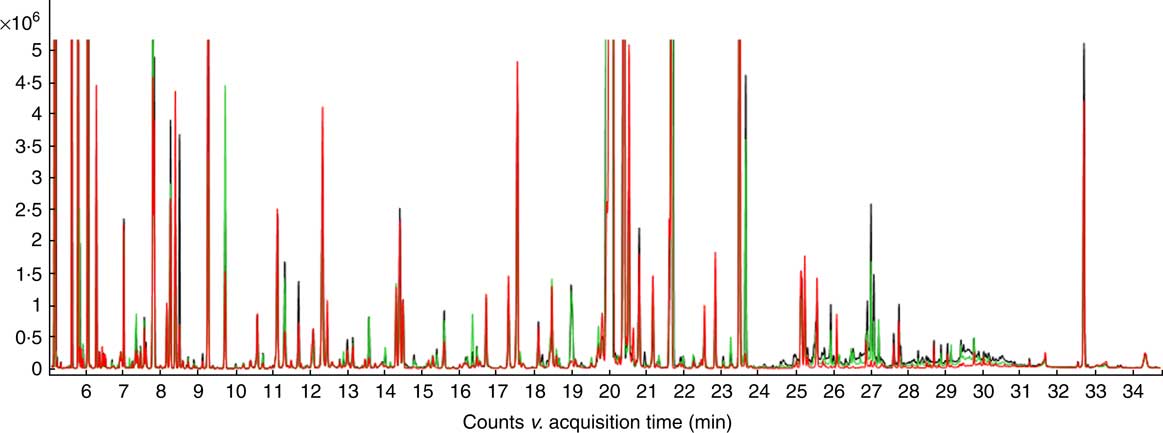
Fig. 2 The typical total ion chromatograms (TIC) of serum samples from broilers. ![]() , Normal control group;
, Normal control group; ![]() , heat stress group;
, heat stress group; ![]() , pair-fed group.
, pair-fed group.
Principal component analysis
Fig. 3 shows PCA score plots that represent the distribution of all the serum samples. There was an obvious separation between the NC group and the other two groups. All the samples in the score plots of the samples were within the 95 % Hotelling T 2 ellipse, and there were no significant differences among the three QC samples.
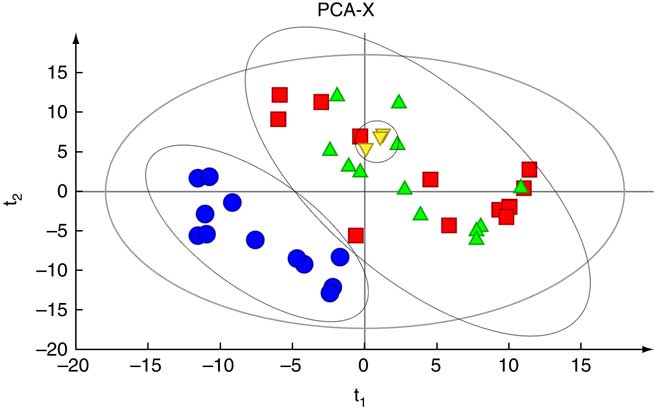
Fig. 3 Principal component analysis (PCA) based on the GC-MS spectra of quality control (![]() ) samples and metabolites in serum samples obtained from the normal control (
) samples and metabolites in serum samples obtained from the normal control (![]() ), heat stress (
), heat stress (![]() ) and pair-fed (
) and pair-fed (![]() ) groups.
) groups.
Orthogonal supervised pattern recognition
The OPLS-DA revealed a clear separation between the HS and NC groups (Fig. 4(a)), as well as between the HS and PF groups (Fig. 4(b)). The parameters of the HS v. NC model, R 2 Y (cum)=0·972 and Q 2 (cum)=0·695, indicated that 97·2 % of the samples (data records) fit the established discriminant mathematic model and that the prediction accuracy of the model was 69·5 %. Similarly, the parameters of the HS v. PF model, R 2 Y (cum)=1 and Q 2 (cum)=0·928, indicated that 100 % of the samples (data records) fit the established discriminant mathematic model and that the prediction accuracy of the model was 92·8 %. The OPLS-DA models indicate that heat stress significantly affects serum metabolic pattern.
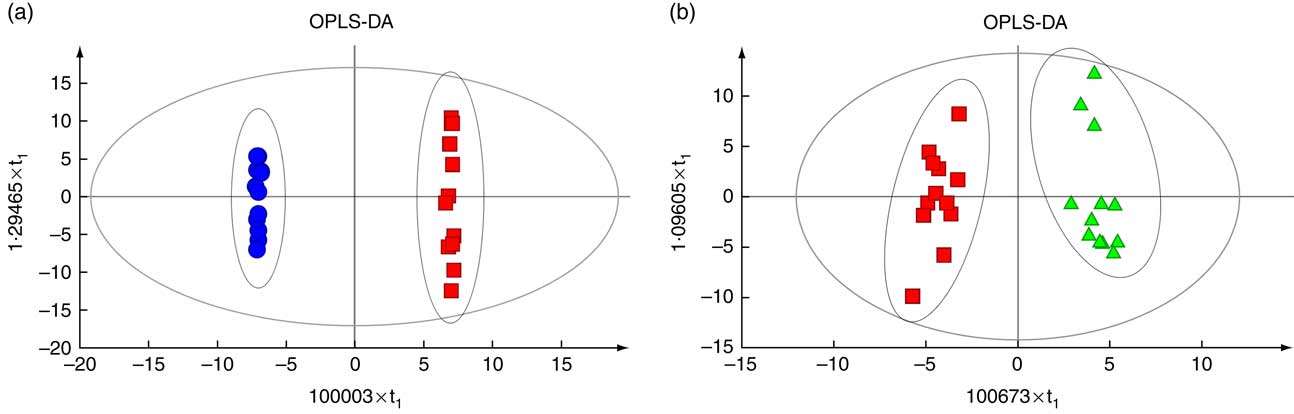
Fig. 4 Score plot of orthogonal projections to latent structures discriminant analyses (OPLS-DA) derived from the GC-MS profiles of serum samples obtained from the heat stress (HS) group v. the normal control (NC) group (a) or the HS group v. the pair-fed (PF) group (b). The descriptive and predictive performance characteristics of the models are R
2
Y (cum)=0·972 and Q
2 (cum)=0·695 for the HS group v. the NC group; R
2
Y (cum)=1 and Q
2 (cum)=0·928 for the HS group v. the PF group. a: ![]() , NC;
, NC; ![]() , HS; b:
, HS; b: ![]() , HS;
, HS; ![]() , PF.
, PF.
Significantly different metabolites analysis
In total, seventy-eight and thirty-four metabolites with significantly different levels (VIP>1 and P<0·05) in the HS and groups and in the HS and PF groups, respectively, were identified, and the differences were expressed as fold-change values to indicate the specific variable quantity of the HS group when compared with the NC or PF groups. Of the seventy-eight metabolites that differed significantly between the HS and NC groups, forty-six and thirty-two had higher and lower concentrations in the HS group than in the NC group, respectively (Table 3), and of the thirty-four metabolites that differed significantly between the HS and PF groups, twenty-three and eleven had higher and lower concentrations in the HS group than in the PF group, respectively (Table 4).
Table 3 Metabolites with significantly different levels in the serum of heat stress (HS) and normal control (NC) broilers
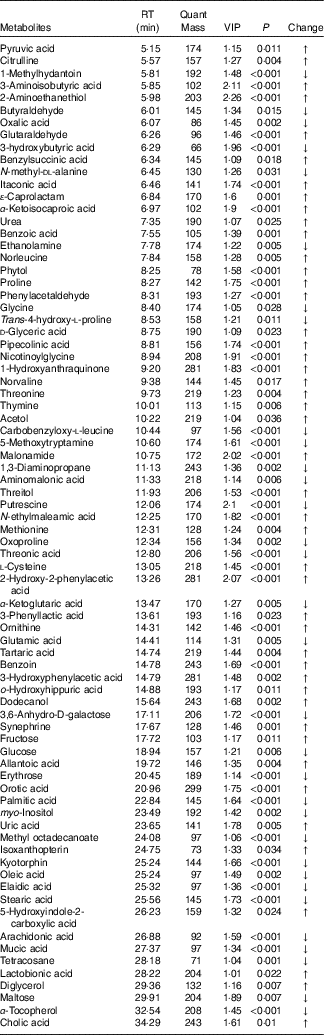
RT, retention time; VIP, variable importance in the projection; Change, ratio of mean peak area of the HS group to the mean peak area of the NC group; ↑, metabolites with higher concentrations in the HS group than in the NC group with values >1; ↓, metabolites with lower concentrations in the HS group than in the NC group with values <1.
Table 4 Metabolites with significantly different levels in the serum of heat stress (HS) and pair-fed (PF) broilers
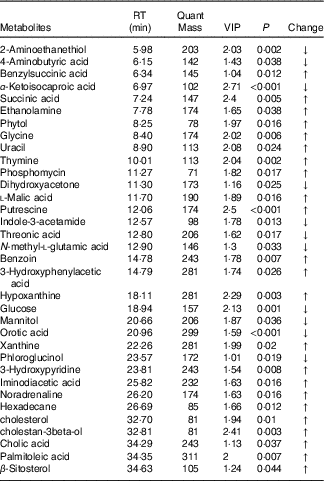
RT, retention time; VIP, variable importance in the projection; Change, ratio of mean peak area of the HS group to the mean peak area of the PF group; ↑, metabolites with higher concentrations in the HS group than in the PF group with values >1; ↓, metabolites with lower concentrations in the HS group than in the PF group with values <1.
Metabolite set enrichment analysis
Fig. 5 shows the twelve most-representative metabolic pathways related to the discriminating metabolites identified by the two individual OPLS-DA models (Tables 3 and 4). The most-impacted pathways that were identified by the discriminating metabolites between the HS and NC groups were the glycine, serine and threonine metabolism, glyoxylate and dicarboxylate metabolism, taurine and hypotaurine metabolism, biosynthesis of unsaturated fatty acids, thiamine metabolism, aminoacyl-tRNA biosynthesis, butanoate metabolism, arginine and proline metabolism, phenylalanine metabolism, fatty acid biosynthesis, cysteine and methionine metabolism and citrate (TCA) cycling pathways. The most-responsible pathways identified by the discriminating metabolites between the HS and PF groups were the citrate (TCA) cycling, tyrosine metabolism, alanine, aspartate and glutamate metabolism, methane metabolism, butanoate metabolism, glyoxylate and dicarboxylate metabolism, neuroactive ligand–receptor interaction, phenylalanine metabolism, primary bile acid biosynthesis, insulin signalling pathway, gap junction and ATP-binding cassette (ABC) transporter pathways. Many of the pathways were related to amino acid metabolism (including glycine, serine and threonine metabolism, arginine and proline metabolism, phenylalanine metabolism, cysteine and methionine metabolism, tyrosine metabolism, alanine, aspartate and glutamate metabolism) and energy substance metabolism (including biosynthesis of unsaturated fatty acids, fatty acid biosynthesis and TCA cycle).

Fig. 5 Metabolite set enrichment analysis was performed using all of the discriminating metabolites identified by the two individual orthogonal projections to latent structures discriminant analyses models. The most representative twelve metabolic pathways were obtained from the heat stress group v. the normal control group (a) or the heat stress group v. the pair-fed group (b). The ordinate represents −log(P). Bars that exceed the blue and red dotted lines indicate pathways with P values of <0·05 and <0·01, respectively. ABC, ATP-binding cassette.
Correlation analysis
Fig. 6 reveals a range of correlation coefficients for the metabolites and parameters, ranging from 1·0 (maximum positive correlation) to −1·0 (maximum anticorrelation), with 0 indicating no correlation. The F:G ratio was significantly and positively correlated with leg, abdominal fat, subcutaneous fat, intramuscular fat proportions and was negatively correlated with breast proportion. Both ADG and ADFI were inversely correlated with the parameters of carcass characteristics to F:G ratio. There were positive correlations between F:G ratio and leg, abdominal fat and intramuscular fat proportions and the levels of proline, l-cysteine, ornithine, methionine, citrulline, threonine, uric acid and pyruvic acid, whereas ADG, ADFI and breast proportion were negatively correlated with those metabolites. However, ADG, ADFI and breast proportion were positively correlated with stearic acid, arachidonic acid, palmitic acid, oleic acid, glutamic acid, α-ketoglutaric acid, glucose and glycine, whereas the F:G ratio and the leg, abdominal fat and intramuscular fat proportions were negatively correlated with those metabolites, except for leg proportion, which was positively correlated with glycine. Meanwhile, the subcutaneous fat proportion was positively correlated with proline, threonine and uric acid and negatively correlated with stearic acid, arachidonic acid, palmitic acid, oleic acid, glutamic acid and glycine.
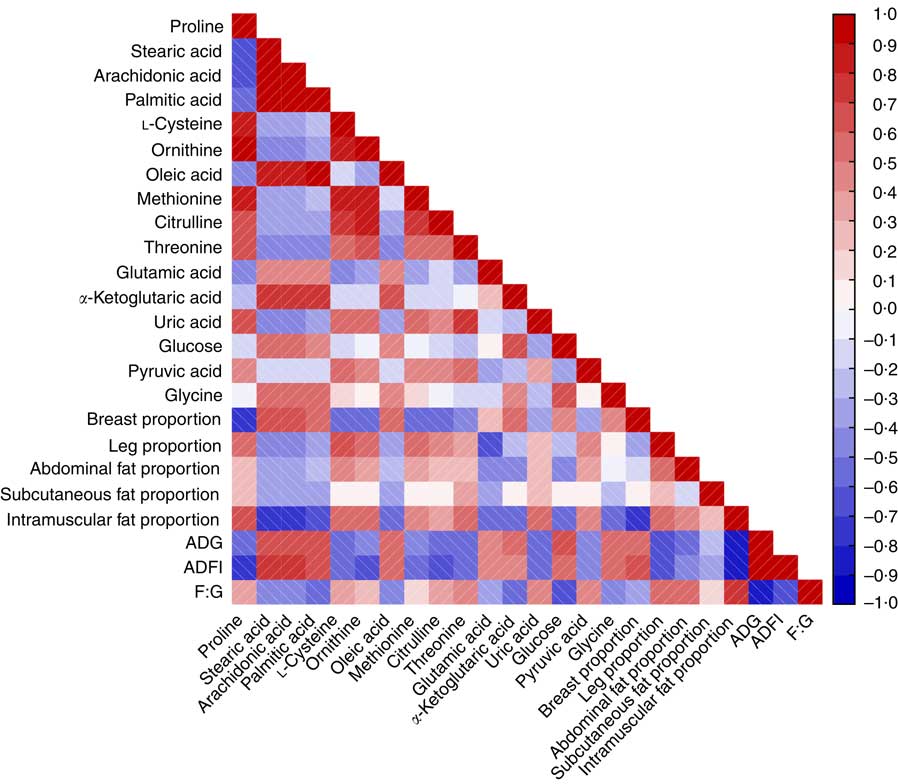
Fig. 6 Heat map based on Pearson’s correlations of growth performance, carcass composition and some important perturbed metabolites related to amino acid and energy metabolism in heat stress and normal control broilers. The colour scale represents Pearson’s correlation coefficients, with red and blue representing positive and negative correlations, respectively. ADG, average daily gain; ADFI, average daily feed intake; F:G, feed:gain ratio.
Serum biochemistry
The serum concentration of uric acid was significantly higher in the HS group than in the NC group (P<0·001) or PF group (P=0·003), and the concentration of uric acid in the PF group was significantly higher than that in the NC group (P<0·001; Fig. 7(A)). The serum concentration of NEFA in the PF group was significantly higher than that in other two groups (P<0·001), and the concentration of NEFA in the NC group was significantly higher than that in the HS group (P=0·041; Fig. 7(B)).
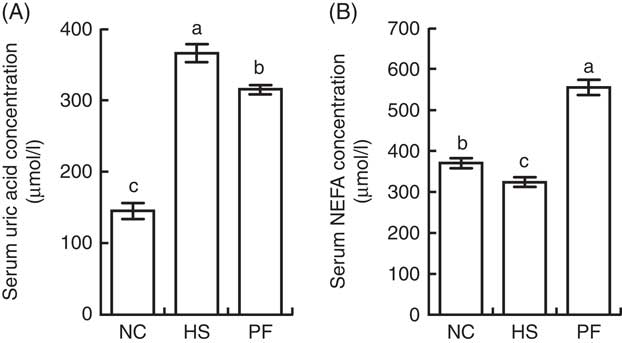
Fig. 7 Effects of heat stress on the serum concentrations of uric acid and NEFA in broilers. (A) Comparison of uric acid levels (P<0·001). (B) Comparison of NEFA levels (P<0·001). Values are means (n 6), and standard deviations represented by error bars. NC, normal control group; HS, heat stress group; PF, pair-fed group. a,b,c Mean values with unlike letters were significantly different (P<0·05).
Discussion
In the present study, finishing period (from 28 to 42 d of age) broiler chickens, which are more sensitive to heat stress than younger birds( Reference Geraert, Padilha and Guillaumin 15 ), were used to establish a chronic heat stress model. Chronic heat exposure significantly increased the cloacal temperatures of the broilers, regardless of the duration of heat exposure, which reflected their inability to sufficiently dissipate heat, thereby demonstrating the plausibility of the chronic heat stress model( Reference Edgar, Nicol and Pugh 16 ). In general, chronic heat exposure impairs the feed intake, growth rate and feed efficiency of broilers and causes huge economic losses for the poultry industry( Reference Slimen, Najar and Ghram 17 , Reference Lara and Rostagno 18 ). Indeed, the present study demonstrated that chronic heat stress reduces broiler feed intake, as reported by Rosa et al. ( Reference Rosa, Faria Filho and Dahlke 19 ), even though some studies have suggested that broilers reduce feed consumption to avoid heat production( Reference Koh and Macleod 20 , Reference Song, Liu and Sheikhahmadi 21 ), and the ADG of the HS group was significantly lower than that of the PF group based on the same feed intake, which clearly demonstrates that the body weight gain of the chronic heat-stressed broiler was reduced by reductions in both feed consumption and efficiency. These results are consistent with those of Lu et al. ( Reference Lu, Wen and Zhang 22 ). The present study also demonstrated that chronic heat stress significantly changed the carcass composition of the broilers. Compared with the NC group, chronic heat exposure decreased the proportion of breast muscle and increased the proportion of leg, which was also reported by Zhang et al. ( Reference Zhang, Jia and Zuo 23 ) and Temim et al. ( Reference Temim, Chagneau and Peresson 24 ). The HS broilers also had higher abdominal fat, subcutaneous fat and intramuscular fat deposition than the other two groups, a finding that is consistent with the results of Geraert et al. ( Reference Geraert, Padilha and Guillaumin 3 ), Ain Baziz et al. ( Reference Ain Baziz, Geraert and Padilha 9 ) and Lu et al. ( Reference Lu, He and Ma 25 ). Broilers exposed to high-temperature environments often exhibit excessive fat deposition, which is not desired by most consumers( Reference Han, Li and Wang 26 ) and is generally experienced as a problem when producing broilers in tropical and subtropical regions( Reference Wu, Deng and Li 27 ).
To gain better insight into the post-absorptive metabolic changes caused by heat stress, we developed a GC-MS method to analyse the endogenous metabolites in broiler serum. To our knowledge, this is the first study to systematically identify metabolites that are expressed differently in the serum of broilers that have been chronically heat stressed. The results of PCA and OPLS-DA indicated that there were significant differences in the serum metabolites of the HS and NC groups, as well as between the HS and PF groups. More specifically, comparing the metabolites of the HS and NC groups indicated that heat stress altered the levels of seventy-eight metabolites (Table 3), many of which are involved in pathways for metabolising amino acids, including glycine, serine and threonine metabolism, arginine and proline metabolism, phenylalanine metabolism, cysteine and methionine metabolism. The glucose levels in the serum of heat-stressed broilers were reduced, which suggests that the broilers were in a negative energy balance( Reference Baumgard and Rhoads 28 ), whereas the uric acid levels in the serum of the heat-stressed broilers were significantly increased, which is consistent with our biochemical validation. These results combined with the decreased proportion of breast suggest that protein may be involved in decomposition for energy, which is similar to the work of Zuo et al. ( Reference Zuo, Xu and Abdullahi 29 ). This could explain why the serum levels of some protein amino acids (e.g. proline, l-cysteine, methionine and threonine) were higher in the heat-stressed broilers, even though feed intake had been significantly reduced. The serum levels of glycine, however, declined in the HS group, possibly owing to intensive uric acid metabolism, as the synthesis of one mole of uric acid requires one mole of glycine( Reference Baker 30 ). In addition, the levels of two non-protein amino acids (ornithine and citrulline) were elevated in the HS group, possibly owing to their special functions in stress relief and thermoregulation( Reference Monti and Jantos 31 , Reference Suenaga, Yamane and Tomonaga 32 ). Serum levels of four fatty acids (stearic acid, arachidonic acid, palmitic acid and oleic acid) were lower in the serum of broilers in the HS group, which is in line with the findings of Wang et al. ( Reference Wang, Lin and Song 33 ). Similarly, the results of serum biochemistry also showed that the serum concentration of NEFA in the HS group were significantly lower than that of other two groups. Under normal conditions, when an animal is in a negative energy balance, the export of NEFA from adipose tissue is promoted by increasing lipolysis. However, heat stress models have demonstrated that heat-stressed animals do not typically exhibit increased serum levels of NEFA, despite reduced feed intake and loss of body weight( Reference Pearce, Gabler and Ross 34 , Reference Rhoads, Baumgard and Suagee 35 ). In rodents, heat stress has been reported to reduce lipolytic rates in vivo and lipolytic enzyme activity in vitro ( Reference Torlinska, Banach and Paluszak 36 ), which may explain the lack of elevated NEFA in heat-stressed animals. Moreover, two metabolites (pyruvic acid and α-ketoglutaric acid) are involved in the citrate cycle (TCA cycle) pathway and have opposite trends. Pyruvic acid is generated through glycolysis in the cytoplasm, whereas α-ketoglutaric acid is an intermediate product of citrate cycle reactions in the mitochondria. Previous studies have shown that chronic heat stress reduces metabolic oxidation capacity and increases glycolysis to generate energy( Reference Azad, Kikusato and Maekawa 37 ), which may be related to mitochondrial dysfunction caused by heat stress( Reference Akbarian, Michiels and Degroote 38 ). Comparing the metabolites of the HS and PF groups indicated that heat stress altered the levels of thirty-four metabolites (Table 4), many of which are involved in energy metabolism and regulation pathways, such as the citrate cycle (TCA cycle), neuroactive ligand-receptor interaction and insulin signalling pathways. Chronic heat exposure could motivate the sympathetic–adrenal medullar axle( Reference Horowitz and Meiri 39 ) and elevate the level of noradrenaline, which enhances animal energy metabolism, in order to cope with dramatic changes in environmental conditions( Reference Yunianto, Higuchi and Ohtsuka 40 ), which is consistent with our results. In the present study, heat exposure enhanced the serum levels of noradrenaline and two citrate cycle intermediates (succinic acid and l-malic acid), which suggests that the heat-stressed broilers reinforced their energy metabolism via nervous-humoral regulation, in order to mitigate heat stress. Simultaneously, the glucose levels in the serum of the HS group were reduced, which suggests that the broilers consumed too much energy to break blood glucose homoeostasis. Due to the reduction of fatty acid oxidation under chronic heat stress, heat-stressed animals become increasingly dependent on glucose for their energy needs( Reference Lin, Du and Gu 41 ). It is interesting that the variation in the serum levels of glycine and palmitoleic acid were exactly the opposite between the HS group v. the PF group and the HS group v. the NC group, and the mechanism that underlies this phenomenon requires further investigation. A schematic diagram of some perturbed metabolic pathways is shown in Fig. 8.
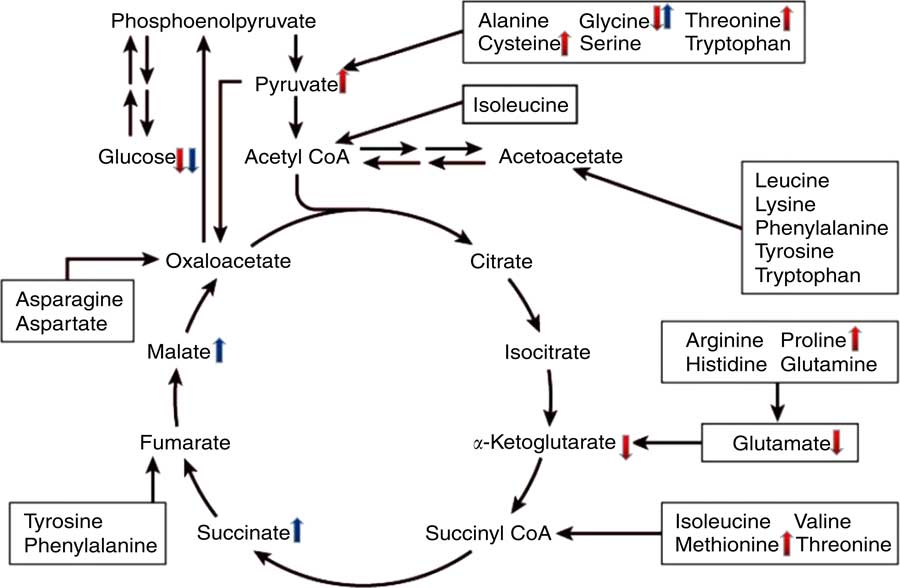
Fig. 8 Schematic overview of some important metabolites and major metabolic pathways related to amino acid and energy metabolism in heat-stressed broilers. ![]() , heat stress (HS) group v. normal control (NC) group up-regulation;
, heat stress (HS) group v. normal control (NC) group up-regulation; ![]() , HS group v. NC group down-regulation;
, HS group v. NC group down-regulation; ![]() , HS group v. pair-fed (PF) group up-regulation;
, HS group v. pair-fed (PF) group up-regulation; ![]() , HS group v. PF group down-regulation.
, HS group v. PF group down-regulation.
Correlation analysis indicated that, when the HS group was compared with the NC group, the F:G ratio was positively correlated with abdominal fat proportion, subcutaneous fat proportion and intramuscular fat proportion and was negatively correlated with breast proportion, which suggests that the reduction in feed efficiency in the HS group is related to the excessive fat deposition and protein degradation, which is in line with the findings of Zeferino et al. ( Reference Zeferino, Komiyama and Pelicia 42 ). The finding that uric acid content was positively correlated with the F:G ratio and negatively correlated with breast proportion supports this idea. However, the leg proportion was also positively correlated with the F:G ratio, which suggests that the decomposition of protein for energy production mainly occurred in the breast muscles. Consistent with the findings of He et al.( Reference He, Zhao and Dai 43 ), present study found that NEFAs (stearic acid, arachidonic acid, palmitic acid and oleic acid) were negatively correlated with abdominal fat proportion, subcutaneous fat proportion, intramuscular fat proportion and F:G ratio, which suggests that the reduced feed efficiency was also related to the suppression of lipolysis throughout the body.
In summary, the chronic heat-stressed broilers were in negative energy balance and unable to effectively mobilise fat for energy production, instead resorting to protein decomposition, which might be the main mechanism that negatively influenced the broilers’ growth performance and carcass characteristics. Furthermore, the present study also found that the observed protein decomposition mainly occurred in the breast muscles. To investigate this mechanism, we detected the cloacal temperature, growth performance, carcass characteristics and serum metabolites and performed a number of statistical tests using the LSD method with a threshold of α=0·05 for each test, which might enhance the probability of false positive in statistics meaning, and further validation at the biochemical and genetic levels may still be needed in the following study.
Acknowledgements
This study was financially supported by the National Key Research and Development Program of China (2016YFD0500501) and Three Agricultural Projects of Jiangsu Province (SXGC 2017281).
We are grateful to Sifa Dai and Hong Hu for their assistance during the animal experiment.
The authors responsibilities were as follows: Z. L., G. Z. and F. G. designed the research; Z. L., X. H., B. M., L. Z., J. L. and Y. J. performed the research; Z. L. analysed data and wrote the paper; all authors read, edited and approved the final manuscript.
The authors declare that there are no conflicts of interest.


