


Although inflammatory responses are orchestrated by a wide spectrum of cells, CD4+ T cells have been implicated as one of major players in the induction and maintenance of chronic inflammation in many human inflammatory diseases( Reference Calle and Kaaks 1 , Reference Calviello, Di Nicuolo and Serini 2 ). The fatty acid composition of T cell membrane lipids has been widely reported to influence immune and inflammatory responses( Reference Calder 3 – Reference Wu, Shi and Xu 8 ). Specifically, dietary n-3 PUFA have been shown in many clinical studies to attenuate inflammatory responses( Reference Kiecolt-Glaser, Belury and Andridge 9 – Reference Wood 11 ), despite some clinical studies where a lack of effect was reported( Reference Kirsch, Payan and Wong 12 – Reference Anandan, Nurmatov and Sheikh 14 ). Mechanisms underlying the anti-inflammatory actions of n-3 PUFA include altered cell membrane phospholipid fatty acid composition, disruption of lipid rafts, inhibition of pro-inflammatory transcription factors, reduction of inflammatory gene expression, and others( Reference Calder 3 , Reference Chapkin, McMurray and Lupton 15 – Reference Chapkin, DeClercq and Kim 17 ). However, the membrane altering, anti-proliferative properties of n-3 PUFA have not been reported in primary human CD4+ T cells.
The plasma membrane is a dynamic cellular structure composed of a myriad of lipids and proteins( Reference Barrera, Zhou and Robinson 18 ). These membrane components are exquisitely organised via various forms of lipid, protein and cytoskeletal interactions( Reference Garcia-Parajo, Cambi and Torreno-Pina 19 , Reference Nussinov, Jang and Tsai 20 ). There is a growing body of evidence indicating that n-3 PUFA impart unique biophysical properties to the phospholipids they are esterified to( Reference Shaikh, Dumaual and Castillo 21 , Reference Shaikh, Locascio and Soni 22 ) which results in alterations in the spatiotemporal organisation of the plasma membrane( Reference Hou, McMurray and Chapkin 5 , Reference Kim, Fan and Barhoumi 23 – Reference Levental, Lorent and Lin 25 ). For example, n-3 PUFA are rapidly incorporated primarily into membrane phospholipids at the sn-2 position( Reference Chapkin, Akoh and Miller 26 , Reference Williams, Batten and Harris 27 ). DHA (22 : 6n-3) and EPA (20 : 5n-3) are known to influence membrane fluidity, ion permeability, fatty acid exchange and resident protein function in a number of cell types including CD4+ T cells( Reference Chapkin, Kim and Lupton 28 , Reference Stillwell and Wassall 29 ).
It has been reported that CD4+ T cells sustain a gradient of plasma membrane lipid order that influences their function in terms of proliferation and cytokine production. Specifically, T cells with high membrane order formed stable immune synapses and proliferated robustly, whereas T cells with low membrane order were profoundly unresponsive to activation( Reference Miguel, Owen and Lim 30 ). In addition, patients with the autoimmune rheumatic disease, systemic lupus erythematosus, had expanded T cell populations with intermediate membrane order( Reference Miguel, Owen and Lim 30 ) and multiple defects in T cell signalling and function that are believed to contribute to disease pathogenesis( Reference McDonald, Deepak and Miguel 31 ). Furthermore, the modulation of membrane order by the naturally occurring fatty acyl species, for example, glycerol monolaurate, suppresses primary T cell function( Reference Zhang, Sandouk and Houtman 32 ). These findings raise the possibility that the targeting of T cell membrane lipid order could have therapeutic potential in T cell-mediated inflammatory diseases. Although several studies have shown n-3 PUFA incorporation results in the increase of membrane order in mouse CD4+ T cells and splenic B-cells lipid raft( Reference Kim, Fan and Barhoumi 23 , Reference Rockett, Franklin and Harris 33 ), contradictory effects have been reported in malignant transformed human Jurkat T cells( Reference Zech, Ejsing and Gaus 34 , Reference Kim, Khan and McMurray 35 ). This suggest that it is difficult to directly compare data from in vitro and in vivo studies across different cell types( Reference Shaikh, Jolly and Chapkin 36 ). Therefore, it is important to determine whether n-3 PUFA supplementation can favourably modulate membrane lipid order and lymphoproliferation in primary human CD4+ T cells.
Plasma membrane order is not only maintained by lipid–lipid interactions but also through the protein–lipid interactions of the cytoskeleton( Reference Chichili and Rodgers 37 , Reference Gaus, Chklovskaia and Fazekas de St Groth 38 ). Therefore, it is important to determine if changes that occur to plasma membrane order are direct (lipid–lipid) or indirect (protein–lipid). To address this, our live cells experiments are complemented with studies using a plasma membrane model system consisting of cytoskeletal free membrane blebs termed, giant plasma membrane vesicles (GPMV)( Reference Sezgin, Kaiser and Baumgart 39 ). GPMV are microscopic (approximately 10 µm) spheres of plasma membranes harvested from live cells following chemical treatment( Reference Scott 40 ). This model has been used to uncover the principles underlying biological processes by minimising the number of cellular variables (e.g. cytoskeleton), thus decreasing experimental complexity, whereas retaining the functionality of the plasma membrane( Reference Sezgin, Levental and Grzybek 41 ).
In addition to membrane order, changes in mitochondrial function may also regulate T cell activation in inflammatory diseases like type II diabetes( Reference Nicholas, Proctor and Raval 42 ). Numerous studies show that mitochondrial energy generation determines the effectiveness of immune responses( Reference Pearce, Poffenberger and Chang 43 – Reference Mills, Kelly and O’Neill 47 ). Over the past decade, our understanding of the metabolic requirements for the generation of ATP in immune cells has increased dramatically( Reference Raval and Nikolajczyk 48 ). Fuel sources and fuel utilisation are now recognised as key regulators of immunological functions in CD4+ T cells. Using the Seahorse extracellular flux analysis system, the real time mitochondrial bioenergetic profiles in primary T cells have been quantified( Reference Nicholas, Proctor and Raval 42 , Reference Faris, Fan and De Angulo 49 ). This method is capable of simultaneously measuring the two major energy yielding pathways, aerobic mitochondrial respiration (indicated by the VO2 rate (OCR)) and glycolysis (indicated by the extracellular acidification rate (ECAR)). The sensitive measurement of cellular energetics is label free, enabling time-resolved analysis and reuse of cells. As the immune system is tightly regulated by nutrient availability and metabolism( Reference MacIver, Michalek and Rathmell 50 , Reference Choi, Lee and Longo 51 ), and we have previously shown that n-3 PUFA suppress mitochondrial translocation and Ca2+ uptake by mitochondria in mouse CD4+ T cells( Reference Yog, Barhoumi and McMurray 52 ), in this study we investigated whether n-3 PUFA can alter primary human CD4+ T cell membrane order and mitochondrial bioenergetics, resulting in suppression of lymphoproliferation.
Methods
Materials
RPMI 1640 medium, Leibovitz medium, FBS, Glutamax, penicillin, streptomycin and Dynabeads Human T-Activator CD3/CD28 were purchased from Gibco. Leucosep tubes were obtained from Greiner Bio-One. Ficoll-Paque medium was purchased from GE. Erythrocytes lysis buffer was obtained from BioLegend. EasySep human CD4+ T cell isolation kits were purchased from StemCell Technologies. Poly-l-lysine was purchased from Sigma. Di-4-ANEPPDHQ was obtained from Invitrogen. Glass bottom 35-mm dishes were purchased from MatTek Corporation. CellTiter-Blue cell viability assay was obtained from Promega. Silica gel 60 G plates and all organic solvents were purchased from EM Science. Free fatty acids and fatty acid methyl ester standards were purchased from Nu-Chek-Prep.
CD4+ T cell isolation and culture
Buffy-coat leucocytes from the Gulf Coast Regional Blood Center or freshly collected whole blood was layered onto Leucosep tubes containing Ficoll-Paque medium followed by centrifugation at 800 g for 15 min. Peripheral blood mononuclear cells (PBMC) were collected from the interphase and washed once with PBS( Reference Rees, Miles and Banerjee 53 ). Erythrocyte contamination was removed by incubating cell pellets in 1X erythrocyte Lysis buffer on ice for 5 min, followed by washing with PBS. CD4+ T cells from PBMC were purified by negative selection using an EasySep human CD4+ T cell isolation kit following the manufacturer’s protocol. Cell viability was assessed by trypan blue exclusion and always exceeded 99 %. The purity of viable CD4+ T cell population as analysed by flow cytometry( Reference Misiak, Tarte and Ame-Thomas 54 ) was 96·5 (se 1·2) % (n 3).
CD4+ T cells isolated from buffy-coat leucocytes were incubated with various doses (0–50 µm) of linoleic acid (LA, 18 : 2n-6), EPA, or DHA conjugated with bovine serum albumin for 2 d (basal state), and, basal T cell bioenergetic profiles were measured. LA was chosen because it is the most abundant n-6 PUFA in the Western diet( Reference Trumbo, Schlicker and Yates 55 ), whereas EPA and DHA are the major (n-3) PUFA in dietary fish oil (FO). In addition, some cultures were activated for an additional 3 d period with Dynabeads Human T-Activator CD3/CD28 at a bead-to-cell ratio of 1:1 in the continuous presence of exogenous FA (activated state). FA incorporation, membrane order, cell proliferation and bioenergetic profiles were subsequently determined.
In a pilot clinical study, CD4+ T cells isolated from volunteers were aliquoted for the purpose of assessing basal state membrane FA incorporation, membrane order and bioenergetic profiles. Some cells were activated for 3 d by culture with Human T-Activator CD3/CD28 Dynabeads at the bead-to-cell ratio of 1:1, without exogenous FA in the medium, for membrane order and cell proliferation assays. All cultures were incubated in RPMI 1640 medium supplemented with 10 % FBS, 2 mM Glutamax, 1×10⁵ U/l penicillin and 100 mg/l streptomycin.
Pilot clinical study design
The study protocol was approved by the Texas A&M University Institutional Review Board and informed consent was obtained from the human subjects or their representatives. Healthy senior (60–87 years old) men and women were recruited to participate in the study. Seniors were recruited for this study because it has been previously shown that following a 12-week of FO supplementation, the incorporation of DHA and EPA into blood plasma TAG were significantly higher with increasing age( Reference Walker, Browning and Mander 56 ). This finding was corroborated in a 4 week n-3 PUFA supplementation study in which participants age>50 exhibited a significant increase in the incorporation of n-3 PUFA in whole blood( Reference Hinriksdottir, Jonsdottir and Sveinsdottir 57 ). In addition, the beneficial effects of n-3 PUFA in the elderly have been recently reported( Reference Smith, Julliand and Reeds 58 , Reference Zhao, Shao and Teng 59 ).
All subjects were extensively screened by research nurses and a physician. Exclusion criteria included n-3 PUFA supplementation and any medications inconsistent with the definition ‘healthy’ according to the study physician’s judgement based on medical history. Subjects were randomly allocated to receive either FO or placebo (olive oil (OO)) capsules in a double-blind manner (n 6/group). All subjects consumed eight 1 g capsules resulting in the administration of 4 g n-3 PUFA (approximately 2·4 g EPA+1·6 g DHA) per d for 6 weeks. The placebo group consumed eight 1 g OO capsules containing 5·6 g olive acid (18 : 1n-9) daily. Capsules were provided by Swanson Health Products. Subjects were requested to record a daily accountability log for capsule intake, and received periodic phone calls to assess compliance and tolerance of the assigned supplement. There were no dropouts or lack of compliance in this study. Details on body fat mass change and major nutrient intake during the 6-week intervention is reported in the online Supplementary Table S1.
Blood was collected into heparinized evacuated tubes immediately before the intervention began and at 3 and 6 weeks. Blood samples were collected in the morning after subjects had fasted overnight. CD4+ T cells were isolated within 2 h of blood collection.
Giant plasma membrane vesicle generation and membrane order measurement
GPMV generation was performed as described previously( Reference Sezgin, Kaiser and Baumgart 39 ). In brief, basal or activated CD4+ T cells were pelleted and re-suspended in GPMV vesiculation buffer (10 mm HEPES, 150 mm NaCl, 2 mm CaCl2, pH 7·4, 25 mm PFA, 2 mm dithiothreitol) for at least 1 h at 37°C. T cells with attached GPMV were then centrifuged at 2000 g for 3·5 min and pellets were re-suspended in serum-free Leibovitz medium containing Di-4-ANEPPDHQ (5 μm), transferred to a 35-mm glass bottom dish, and immediately imaged.
Basal or activated whole CD4+ T cells were stained with Di-4-ANEPPDHQ for membrane order determination as previously described( Reference Chapkin, DeClercq and Kim 17 , Reference Owen, Rentero and Magenau 60 ). In brief, CD4+ T cells were gently pelleted by centrifugation at 200 g for 5 min, re-suspended in serum-free Leibovitz medium containing Di-4-ANEPPDHQ (5 μm), transferred to a 35-mm glass bottom dish, and immediately imaged to avoid dye internalisation.
Imaging experiments were conducted on a Zeiss 510 or a Zeiss 780 confocal microscope equipped with a 32-channel GaAsP line-array spectral detector. Cells and GPMV were imaged at 63× magnification at room temperature. Laser light at 488 was used to excite Di-4-ANEPPDHQ and emission wavelengths were collected in two channels representing order (O: 508-544) and disordered (D: 651-695). Generalised polarisation (GP) was calculated using the equation below: GP=(I (O)−I (D))/(I (O)+I (D)). The same laser power and settings were used for every experiment. Image processing was conducted using Fiji/ImageJ (NIH) software, with a GP-plugin and a custom-built macro. Briefly, images were converted to 8-bit tiffs, combined into RBG images. A threshold was applied to exclude background pixels, and converted into GP images. Average GP was determined from region of interest of cells or GPMV.
Cellular bioenergetic profile measurement
Seahorse XF 24-well cell culture plates were pre-coated with 0·01 % poly-l-lysine (50 µl/well) for 30 min at room temperature, followed by UV sterilisation for at least 1 h. Pre-coated plates were warmed to 37°C, 30 min before cell plating. Basal or activated cells were immediately seeded into plates at a concentration of 0·5–1×10⁶ cells/50 µl medium. Plates were incubated in a CO2-free incubator at 37°C for 30 min to allow cells to adhere to the pre-coated wells. XF 24-well cell culture plates were then transferred to the XF24 Extracellular Flux Analyzer (Seahorse Bioscience). Hydrated cartridges containing optimal concentrations of mitochondrial mediators, oligomycin (5 μm), FCCP (carbonylcyanide p-trifluoromethoxyphenylhydrazone; 1 µm), and rotenone (5 µm) were injected at timed intervals into sample wells and the OCR and ECAR were monitored continuously as previously described( Reference Blagih, Coulombe and Vincent 61 , Reference Fan, Vaz and Chapkin 62 ).
Membrane lipid extraction and quantification
Total cellular lipids were extracted by the method of Folch( Reference Folch, Lees and Sloane Stanley 63 ). Total phospholipids and neutral lipids were separated by one-dimensional TLC on silica gel 60G plates using chloroform–methanol–acetic acid–water (90:8:1:0·8, by vol.) as the developing solvent. Isolated lipid fractions were transesterified in 6 % methanolic HCl overnight( Reference Fan, Monk and Hou 64 ). Fatty acid methyl esters were separated on a Durabond DB-225 column (Agilent) using a Trace 1310 GC (Thermo Scientific) coupled to a TSQ 8000 Evo mass spectrometer (Thermo Scientific). The injection volume was 1 μl and the injector was used in the split mode at 1:53. The inlet injector temperature was 250°C and the oven temperature was held constant at 200°C for 45 min. Quantification was performed using selected reaction monitoring mode of the most intense fragments. Data acquisition and processing were performed with TraceFinder software (Thermo Fisher).
Cell proliferation measurement
T cell proliferation was measured by the CellTiter-Blue cell viability assay( Reference Prahallad, Sun and Huang 65 ). Cells were seeded in flat bottom 96-well culture plates (50 000 cells/100 µl medium) for 3 d with or without Dynabeads Human T-Activator CD3/CD28 at a bead-to-cell ratio of 1:1. CellTiter-Blue reagent was added to each culture 4 h before the end of the incubation period. Fluorescent intensity was measured at 560/590 nm and the value from the culture medium background was subtracted from the experimental wells. Proliferation index was then calculated as the average fluorescence intensity of activated wells/average of basal wells.
Statistical analysis
Data were analysed using a two-way ANOVA and results from treatments with significant overall changes were subjected to the post hoc Tukey’s test with significance at P<0·05. We have detected significant differences with similar sample sizes of n 3–4 when measuring the effect of n-3 PUFA on T cells lipid rafts( Reference Fan, McMurray and Ly 66 , Reference Fan, Ly and Barhoumi 67 ). In addition, clinical studies have detected significant differences in human blood cell phospholipid fatty acid composition, cell proliferation and DNA methylation of fatty acid desaturase and elongase enzymes in FO v. placebo supplementation with sample sizes of six to eight subjects( Reference Thies, Nebe-von-Caron and Powell 68 , Reference Hoile, Clarke-Harris and Huang 69 ). These data indicate that we have sufficient sample size and power of at least 0·80 to observe differences at significance level α<0·05. Data were tested for normality by the D’Agostino-Pearson omnibus normality test, and are presented as means with their standard errors. Analyses were conducted with the Prism 6 program (GraphPad Software, Inc.). For phase separation data, the χ 2 test was used to compare all treatments. To compare individual treatments with each other, a two-tailed Fisher’s exact test was performed for each treatment pair.
Results
Exogenous PUFA differentially alter CD4+ T cell membrane phospholipid fatty acid profiles in vitro
Following a 5-d incubation period, albumin bound LA, EPA and DHA were dose-dependently incorporated into human CD4+ T cell membrane phospholipids, as shown in Table 1. Compared with the control untreated (UT) group, exogenous LA (n-6 PUFA control) significantly (P<0·05) elevated membrane bound LA levels 4·5–12·6-fold, whereas exogenous EPA and DHA significantly (P<0·05) elevated membrane n-3 PUFA from an undetectable level to 2·8–10·1 mol% for EPA, and 6·9–12·7 mol% for DHA. In addition, upon incorporation into the membrane, exogenous EPA was further elongated to docosapentaenoic acid (DPA, 22 : 5n-3). Interestingly, exogenous LA did not alter arachidonic acid (AA, 20 : 4n-6) levels, whereas only the highest dose of exogenous n-3 PUFA produced a compensatory reduction in AA. Overall, the combined phospholipid levels of EPA and DPA (6·4–17·6 mol%) were comparable to DHA levels. In addition, incubation with high doses of exogenous PUFA (25 and 50 µm) resulted in the incorporation of EPA, DPA and DHA into neutral lipid fractions as shown in the online Supplementary Table S2. To assess effects on ∆9 desaturase activity, the stearoyl-CoA desaturase (SCD) index was examined. No significant difference among treatment groups was detected with regard to the ratio of 16 : 1/16 : 0 (SCD1i1) and 18 : 1/18 : 0 (SCD1i2), suggesting no change in enzyme activity (Table 1).
Table 1 In vitro incorporation of exogenous fatty acids (FA) into activated human CD4+ T cell membrane phospholipidsFootnote * (Mean values with their standard errors)
L, linoleic acid; E, EPA; D, DHA; SCD, stearoyl-CoA desaturase; UT, untreated – no exogenous FA; ND, not detectable; number following each letter denotes concentration in μm.
a,b,c,d,e,f Mean values with unlike superscript letters were significantly different (P<0.05, n 3–7).
* Only selected FA (>1 mol%) are reported.
High-dose exogenous n-3 PUFA modulate CD4+ T cell membrane order and induce phase separation in giant plasma membrane vesicles
Following a 5-d fatty acid incubation period in the presence of CD3/CD28 stimulation (for 3 d), all three PUFA treatments resulted in a decrease in whole cell membrane order, relative to UT cells. However, n-3 PUFA (EPA and DHA) exhibited significantly (P<0·05) lower GP values compared with n-6 PUFA (LA) at the highest dose (50 µM) only (Fig. 1(A)). In order to determine if PUFA can directly modulate plasma membrane biophysical properties without the contribution of a cytoskeleton, membrane order was assessed in GPMV derived from activated T cells. Interestingly, n-3 PUFA treated cells exhibited a significant (P<0·05) elevation in membrane order compared with n-6 PUFA (LA) at 25 and 50 µm doses (Fig. 1(B)). The striking inversion in EPA and DHA-induced membrane order was associated with a phase separation of the GPMV bilayer (Fig. 1(C)). Representative images and histograms (Fig. 1(D) and (E)) highlight how phase separation was uniquely imposed by n-3 PUFA in disordered domains that are more disordered, and ordered domains that are more ordered. This is apparent as the histogram generated from the pixels of the LA treated GPMV display a Gaussian distribution centred about −0·2, whereas the EPA treated GPMV display a two Gaussian distribution with the most fluid centred about −0·4 and the most ridged centred about 0·4 (Fig. 1(E)). Interestingly, GPMV phase separation was only correlated with the membrane level of n-3 PUFA, not the ratio of n-3:n-6 PUFA, as shown in Table 1.
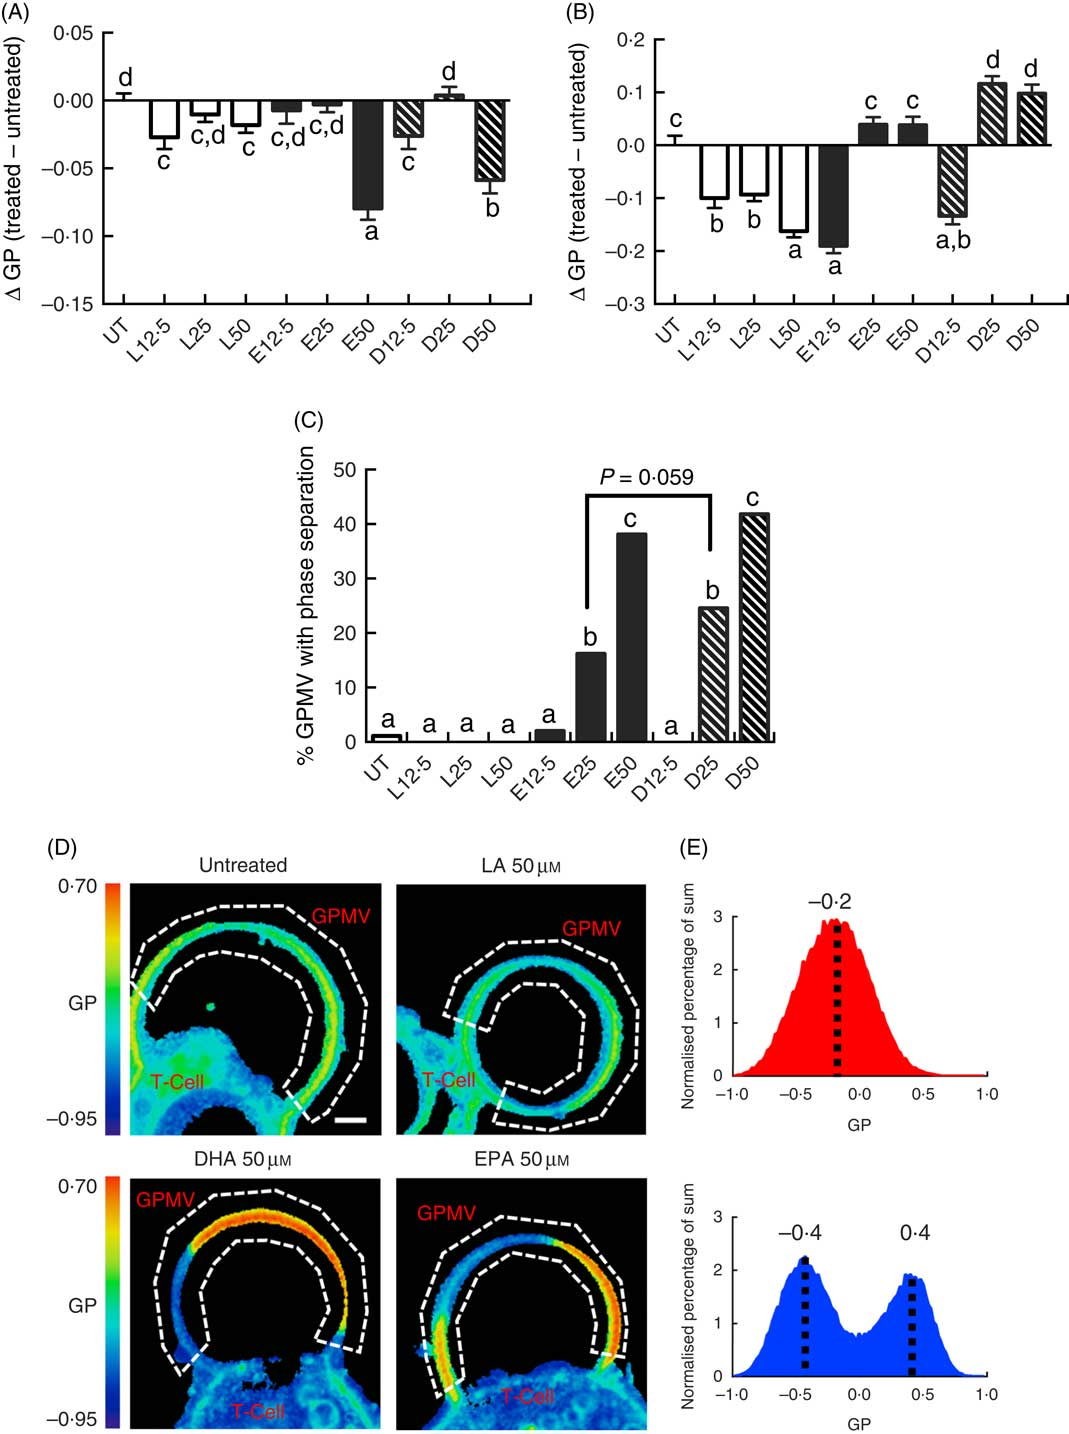
Fig. 1 Exogenous fatty acids dose-dependently alter human CD4+ T cell membrane order and giant plasma membrane vesicle (GPMV) phase separation. Human pan CD4+ T cells isolated from buffy-coat leucocytes were incubated with various doses (0–50 µm) of linoleic acid (LA), EPA and DHA conjugated with bovine serum albumin for 2 d. Cultures were further stimulated for 3 d with Dynabeads Human T-Activator CD3/CD28 at the bead-to-cell ratio of 1:1, in the presence of their respective FA. Membrane order was measured following 5 d of total incubation. Data are expressed as the change in generalised polarisation (ΔGP) compared with the untreated (UT) group in (A) whole cells and (B) GPMV. (C) n-3 PUFA significantly increased numbers of GPMV with phase separation. (D) Representative images of GPMV showing no phase separation (UT and LA 50 µm) and phase separation (DHA 50 µm and EPA 50 µm). White dashed line represents region of interest identifying GPMV and used to determine membrane order. Note that GPMV rarely detach fully from the cell. Scale bar equals 2 µm. (E) Average histogram of normalised GP values obtained from non-phase separated (![]() ) and phase separated (
) and phase separated (![]() ) GPMV from LA 50 µm and EPA 50 µm treated cells, respectively. Values are as means (n 50–183, pooled from three separate experiments), with their standard errors. a,b,c,d Mean values with unlike letters are significantly different (P<0·05).
) GPMV from LA 50 µm and EPA 50 µm treated cells, respectively. Values are as means (n 50–183, pooled from three separate experiments), with their standard errors. a,b,c,d Mean values with unlike letters are significantly different (P<0·05).
Altered CD4+ T cell bioenergetic and proliferation profiles following high-dose PUFA treatment
Following a 2 d PUFA incubation period, CD4+ T cell mitochondrial OCR and ECAR were assessed. The OCR:ECAR ratio under basal conditions was moderately modified compared with the control (UT) group. LA (50 µm), EPA (12·5 µm) and DHA (12·5 and 25 µm) treated cells exhibited significantly (P<0·05) higher OCR:ECAR ratios relative to UT (Fig. 2(A)). In some cultures, cells were stimulated for an additional 3 d with CD3/C28 beads in the presence of fatty acid. Overall, OCR:ECAR ratios were decreased across fatty acid treatments in basal v. activated cells. Compared with LA, EPA and DHA exhibited a bi-phasic response in activated cells, with the 25 µm dose increasing the ratio, relative to the 12·5 and 50 µm doses which decreased or had no effect (Fig. 2(B)). At high doses (50 µm), EPA and DHA promoted mitochondrial respiration-associated protein leak compared with UT or LA groups (P<0·05) (Fig. 2(C)). EPA and DHA dose-dependently decreased lymphoproliferation compared with the UT and LA treatment groups (P<0·05) (Fig. 2(D)), with DHA exhibiting the strongest anti-proliferative effect across all doses.
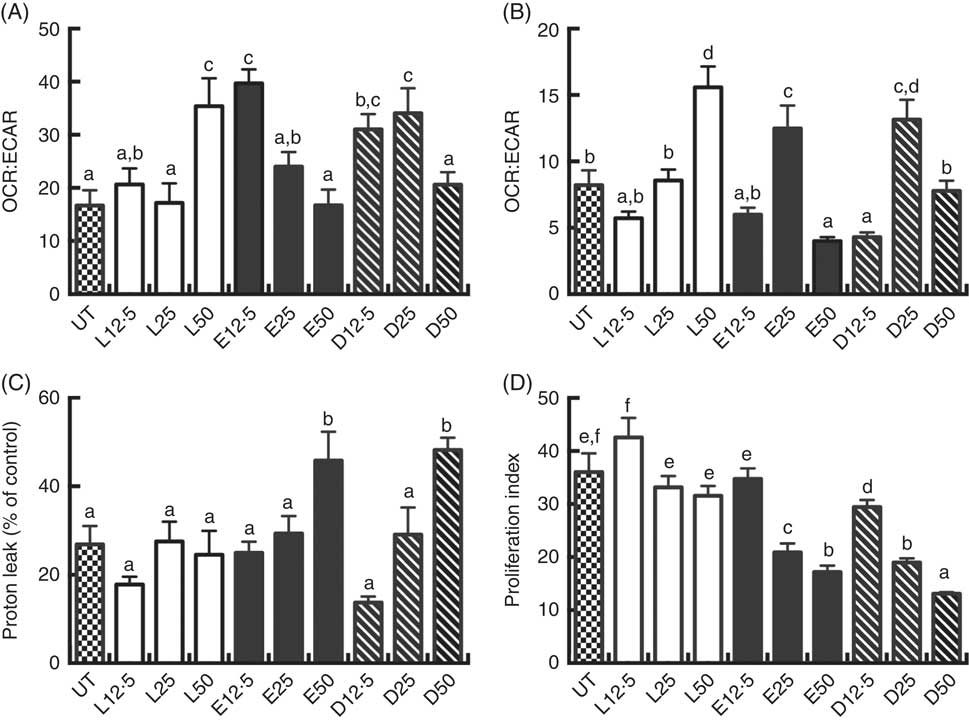
Fig. 2 Exogenous fatty acids alter human CD4+ T cell bioenergetic profiles and proliferation. See Fig. 1 legend for in vitro culture details. Cellular bioenergetic profiles in basal and activated states were measured. (A) VO2 rate (OCR):extracellular acidification rate (ECAR) ratio under basal conditions (following 2 d FA incubation). (B) OCR:ECAR ratio after additional 3 d activation (5 d FA incubation). (C) Mitochondrial respiration-associated proton leak after activation. (D) Cell proliferation 3 d after activation. Values are means (n 7–21, pooled from two separate experiments for bioenergetic assays; n 14–24, pooled from four separate experiments for cell proliferation assays), with their standard errors. The proliferation index was calculated as the ratio of live cell fluorescense in activated:basal states. a,b,c,d,e,f Mean values with unlike letters are significantly different (P<0·05).
Dietary fish oil supplementation promotes human CD4+ T cell EPA membrane incorporation
Daily supplementation with 4 g n-3 PUFA (about 2·4 g EPA+1·6 g DHA) resulted in the significant (P<0·05) enrichment of EPA in CD4+ T cell membrane phospholipids after 3 and 6 weeks (Fig. 3). Interestingly, no significant enrichment in other n-3 PUFA, DPA and DHA, was observed in either total phospholipid and neutral lipid fractions (online Supplementary Figs S1 and S2). From a quantitative perspective, the wt% of n-3 PUFA incorporated into membrane phospholipids at the completion of the 6-week intervention was 1·8 (se 0·5), 3·2 (se 1·2), 3·3 (se 1·2) % for EPA, DPA, DHA, respectively (Fig. 3). These levels of enrichment were roughly equivalent to those observed following in vitro incubation with 12·5 µm n-3 PUFA (2·8, 3·6, 6·9 mol% for EPA, DPA, DHA, respectively) (Table 1). No significant changes were observed in the levels of 18 : 1n-9 and n-6 PUFA (18 : 2n-6 and 20 : 4n-6) after 6 weeks of supplementation.
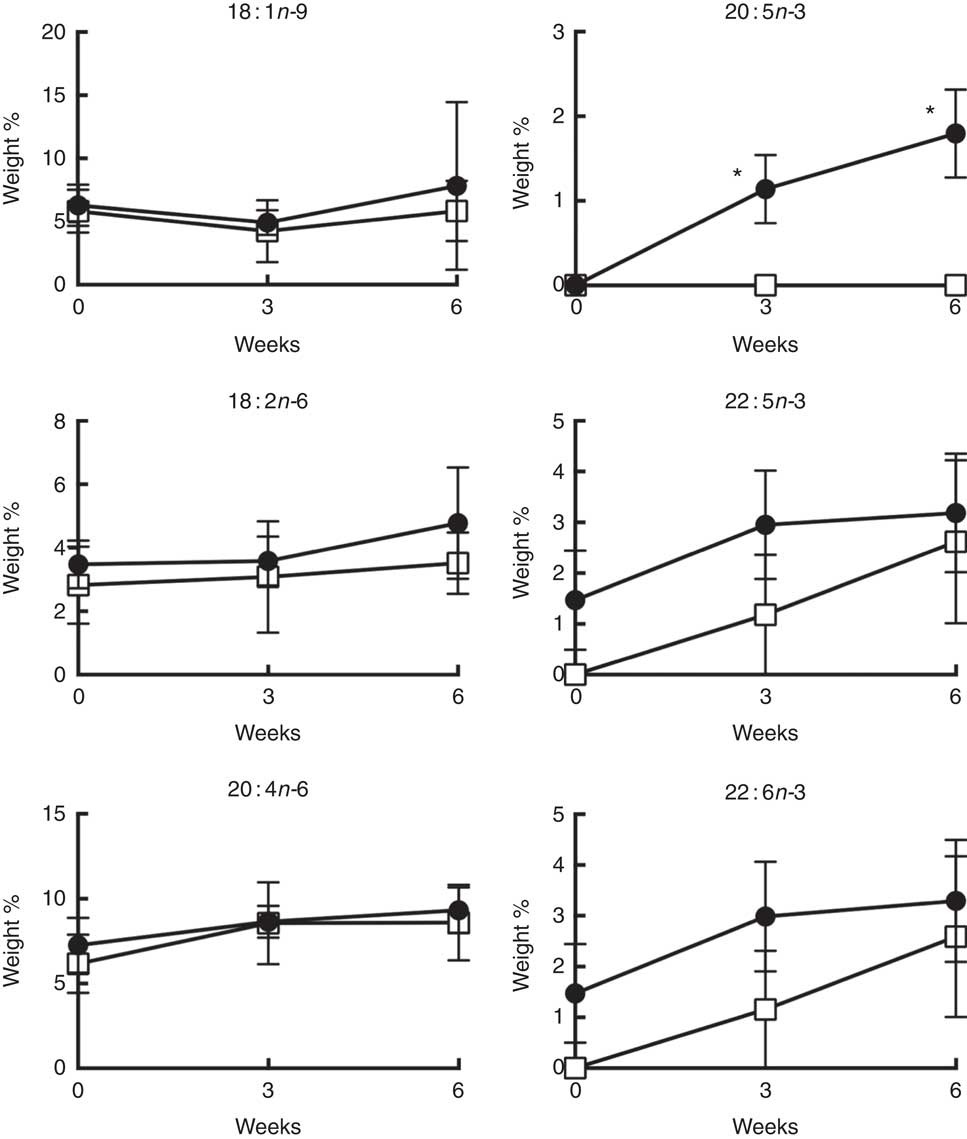
Fig. 3 Weight percentage of the major n-9, n-6 and n-3 PUFA in CD4+ T cell membrane total phospholipids over 6 weeks of oral fish oil supplementation in elderly humans. Senior (age 60–87 years) volunteers were provided fish oil (FO, ![]() ) capsules (4 g n-3 PUFA daily) or placebo olive oil (OO,
) capsules (4 g n-3 PUFA daily) or placebo olive oil (OO, ![]() ) capsules for 6 weeks. Fresh whole blood was collected at time 0, 3 and 6 weeks. CD4+ T cells were isolated and membrane total phospholipids were extracted, separated by TLC, and the FA mass determined. Values are means (n 5–7), with their standard errors. * Significantly different from time 0 (P<0·05).
) capsules for 6 weeks. Fresh whole blood was collected at time 0, 3 and 6 weeks. CD4+ T cells were isolated and membrane total phospholipids were extracted, separated by TLC, and the FA mass determined. Values are means (n 5–7), with their standard errors. * Significantly different from time 0 (P<0·05).
Dietary n-3 PUFA supplementation reduces plasma membrane order in human whole CD4+ T cells and giant plasma membrane vesicles
Although differences between FO v. OO (placebo) treatments at either interval with respect to plasma membrane order were NS, supplementation with FO did alter T cell membrane order at 3 and 6 weeks. Compared with control time 0, membrane order (ΔGP values) in both basal cells at 3 and 6 weeks FO supplementation (Fig. 4(A)) and CD3/CD28 activated cells at 3 and 6 weeks FO supplementation (Fig. 4(B)) were significantly (P<0·05) decreased. These observations are consistent with our low-dose in vitro findings (Fig. 1(A)). Consistent with whole cell data, compared with control time 0, n-3 PUFA feeding significantly (P<0·05) decreased delta GP values in GPMV after 3 and 6 weeks intervention in activated cells compared with baseline values (Fig. 4(D)). These findings mimic the in vitro low-dose (12·5 µm) observations (Fig. 1(B)). No differences in GPMV membrane order were observed under basal conditions (Fig. 4(C)). No evidence of phase separation was detected in the GPMV of study subjects at any time point (data not shown).
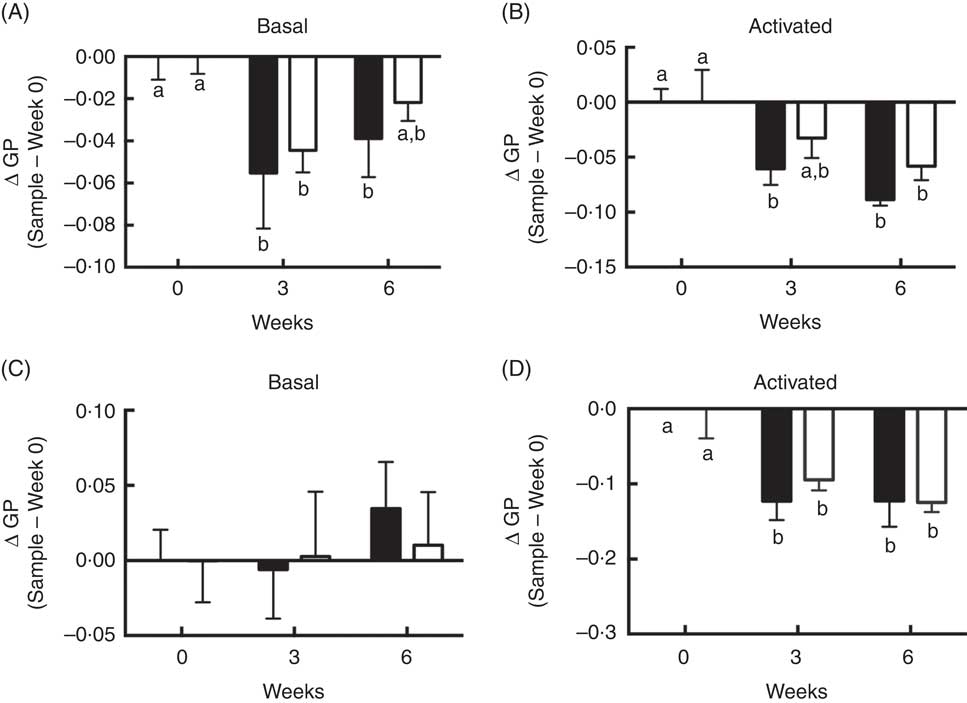
Fig. 4 Activated CD4+ T cell membrane order was decreased by dietary fish oil and olive oil supplementation in elderly humans. See Fig. 3 legend for dietary intervention details. CD4+ T cells isolated from volunteers were activated using Human T-Activator CD3/CD28 Dynabeads at a bead-to-cell ratio of 1:1 for 3 d. (A, B) Whole cell and (C, D) giant plasma membrane vesicle membrane order under both basal and activated conditions were measured. Data are expressed as change in generalised polarization (ΔGP) compared with time 0, and reported as means (n 5–7), with their standard errors. ![]() , Fish oil;
, Fish oil; ![]() , olive oil. a,b Mean values with unlike letters are significantly different (P<0·05).
, olive oil. a,b Mean values with unlike letters are significantly different (P<0·05).
Dietary n-3 PUFA supplementation does not alter human CD4+ T cell metabolic and proliferation phenotypes
Under basal conditions, FO feeding had no significant effect on the OCR:ECAR ratio and mitochondrial respiration related proton leak after 3 or 6 weeks of supplementation (online Supplementary Fig. S3(A) and (B)). Similarly, there was no significant effect of n-3 PUFA supplementation on cell proliferation over the 6 weeks intervention period (online Supplementary Fig. S3(C)).
Discussion
The plasma membrane is an essential cellular structure composed of a phospholipid bilayer and a myriad of proteins, which constitute the outer boundary of the cell. Not only does the cell membrane control molecular transport, but it also regulates communication between the cell and its environment by transducing signals. Recent studies have documented important functions for plasma membrane lipids in regulating T cell signalling( Reference Wu, Shi and Xu 8 ). For example, the fatty acid composition of T cells has been linked to immune( Reference Kim, Fan and Barhoumi 23 , Reference Yog, Barhoumi and McMurray 52 , Reference Hou, Monk and Fan 70 , Reference Hou, Barhoumi and Fan 71 ) and inflammatory homoeostatic responses( Reference Calder 3 , Reference Monk, Turk and Fan 72 ). Several clinical studies have examined the effects of dietary fatty acid incorporation in circulating red blood cells and peripheral mononuclear cells( Reference Rees, Miles and Banerjee 53 , Reference Thies, Nebe-von-Caron and Powell 68 , Reference Walker, West and Browning 73 , Reference Browning, Walker and Mander 74 ). However, the effects of these fatty acids on the membrane biophysical properties of human primary CD4+ cells have not be assessed.
We isolated highly purified, viable, primary human CD4+ T cells (>96 % viability) from buffy-coat leucocytes and demonstrated the dose-dependent in vitro incorporation and elongation of exogenous PUFA into CD4+ T cell membrane phospholipids (Table 1). We observed that exogenous EPA was extensively elongated to DPA (22:5n-3), a process that is common to other cell types( Reference Chapkin, Akoh and Miller 26 , Reference Chapkin and Miller 75 ). In contrast, in vivo supplementation of healthy older adult subjects with 2·4 g EPA and 1·6 g DHA daily for 6 weeks resulted in only a modest incorporation of EPA into CD4+ T cell membrane phospholipids, with no evidence of elongation to DPA or incorporation of DHA (Fig. 3). The dose of EPA and DHA used in the present human study is the maximal dose advised by the Food and Drug Administration( Reference Zargar and Ito 76 ) and that is able to slow muscle mass decline and function in older adults( Reference Smith, Julliand and Reeds 58 ). The apparent selective incorporation of EPA may be related, in part, to the higher amount of EPA relative to DHA in the capsules (3:2 mass ratio). Although no significant incorporation was detected for DPA and DHA (P values 0·134 and 0·144 for DPA and DHA, respectively), after 3 weeks of supplementation a broader ‘trend’ of n-3 PUFA enrichment was detected. As the overall enrichment of n-3 PUFA was minimal, no alterations in counterpart n-6 PUFA (18 : 2n-6 and 20 : 4n-6) levels were expected. In spite of OO supplementation in the placebo (OO) group, similar levels of 18 : 1n-9 were observed in both groups as a result of homoeostatic regulation as mammals can synthesise 18 : 1n-9 de novo ( Reference Ameer, Scandiuzzi and Hasnain 77 ). The 2 wt% in vivo incorporation of EPA into CD4+ T cell membrane phospholipids after 6 weeks of n-3 PUFA consumption (Fig. 3) was comparable to the addition of 12·5 µm EPA in vitro (2·8 and 3·6 mol% for EPA and DPA, respectively) (Table 1).
As changes in membrane lipid order have been associated with immune cell function and inflammatory disease status( Reference Hou, McMurray and Chapkin 5 , Reference Miguel, Owen and Lim 30 – Reference Zhang, Sandouk and Houtman 32 ), it is noteworthy that the in vitro doses of EPA or DHA differentially modulated membrane lipid order in whole CD4+ T cells v. GPMV prepared from those cells as compared with UT or n-6 PUFA control treatments (Fig. 1(A) and (B)). Although we have previously demonstrated that n-3 PUFA increase membrane order in specific mouse splenic CD4+ membrane domains (e.g. lipid rafts at the immunological synapse)( Reference Kim, Fan and Barhoumi 23 , Reference Kim, Barhoumi and McMurray 78 ), this is the first time that membrane order has been assessed in human primary CD4+ T cells and their GPMV. These data represent ‘overall’ membrane order status, and cannot be directly compared with immunological synapse specific microdomains. With respect to other cell types, it has been reported that n-3 PUFA increase lipid raft size in mouse B-cells. These experiments were initiated following the cross-linking of lipid raft microdomains, which were labelled with cholera toxin B, and enriched in ganglioside GM1( Reference Rockett, Teaque and Harris 79 ). Importantly, the process of cholera toxin B cross-linking itself is known to influence membrane organisation( Reference Hammond, Heberle and Baumgart 80 ) which makes the results difficult to compare. Furthermore, in the absence of cross-linking, FO reduced whole cell membrane order of B-cells( Reference Rockett, Teaque and Harris 79 ), and only upon cross-linking did membrane order increase to an equivalent level relative to control, resulting in the observed increase of membrane order relative to no cross-linking.
Interestingly, at higher doses of n-3 PUFA in vitro, a profound induction of phase transition was induced which contributed to an increase in GPMV membrane rigidity (Fig. 1(B) and (C)). This may have contributed to the reduction of proliferation (Fig. 2(D)) as disruption of membrane lipid order has been linked to suppression of CD4+ T cell clonal expansion( Reference Schieffer, Naware and Bakun 81 ). Membrane phase separation was specific to n-3 PUFA, and was likely not simply due to the fatty acid unsaturation or the n-3:n-6 PUFA ratio level. For example, at 25 µm, although EPA and DHA treated cells exhibited comparable levels of total n-3 PUFA (Table 1), the number of GPMV with phase separation was 52 % higher in the DHA group (P=0·059). Consistent with these observations, in vivo n-3 PUFA administration modestly decreased delta GP values in both basal and activated whole CD4+ T cells (Fig. 4(A) and (B)) and GPMV prepared from activated T cells (Fig. 4(D)) compared with time 0, indicating a more fluid membrane. The low incorporation of n-3 PUFA in vivo did not induce GPMV phase separation, which is consistent with the results of low-dose (12·5 µM) EPA and DHA experiments in vitro (Fig. 1(C)). Treatment with OO (placebo) decreased delta GP values at 3 weeks in activated whole CD4+ T cells and GPMV (Fig. 4(B) and (D)) compared with time 0. This effect may be attributed to the fact that lower concentrations of 18 : 1n-9 preferentially mix with and disorder ceramide-enriched domains in model stratum corneum( Reference Mao, VanWyck and Xiao 82 ). No significant effect of n-3 PUFA on mitochondrial bioenergetics, respiration-related proton leak or cell proliferation was observed in CD4+ T cells from supplemented human subjects (online Supplementary Fig. S3) which is consistent with the response of CD4+ T cells in vitro following treatment with a low dose of n-3 PUFA (Fig. 2).
Recently, GPMV have attracted great attention in studies focusing on cell membrane biophysical properties, due to the fact that they are comprised of the membrane bilayer without the contribution of the cytoskeleton( Reference Sezgin, Kaiser and Baumgart 39 , Reference Levental and Levental 83 ). Thus, the contrasting in vitro effects of n-3 PUFA on membrane order in whole CD4+ T cells and GPMV observed at the high dose (Fig. 1(A) and (B)) suggest the involvement of the cytoskeleton in the modulation of membrane lipid order. This is consistent with our findings that n-3 PUFA alter membrane phosphatidylinositol 4,5-bisphosphate level, suppress the recruitment of Wiskott–Aldrich syndrome protein to the immunological synapse and impair actin remodelling in mouse CD4+ T cells( Reference Hou, Monk and Fan 70 ). Although GPMV phase separation into microscopically resolvable domains is a process that does not generally occur in live cell membranes( Reference Lee, Saha and Polley 84 ), it serves as a valuable tool for understanding lipid raft properties( Reference Sezgin, Kaiser and Baumgart 39 ). For example, formation of phase separated GPMV at room temperature upon 25 and 50 µm n-3 PUFA treatment (Fig. 1(C)) indicates increased domain stability. Importantly, domain stability determined by phase separation in GPMV is altered by polyunsaturated lipids( Reference Levental, Lorent and Lin 25 ), cholesterol( Reference Levental, Byfield and Chowdhury 85 ), bile acids( Reference Zhou, Maxwell and Sezgin 86 ), anaesthesia( Reference Gray, Karslake and Machta 87 , Reference Machta, Gray and Nouri 88 ), chemotherapeutics( Reference Raghunathan, Ahsan and Ray 89 ), cell cycle( Reference Gray, Diaz-Vazquez and Veatch 90 ), epithelial-mesenchymal transition( Reference Tisza, Zhao and Fuentes 91 ) and protein–lipid interaction( Reference Podkalicka, Biernatowska and Majkowski 92 ). Furthermore, the ability of n-3 PUFA to increase phase separation in GPMV has been linked to suppression of Snail function and the inhibition of lung metastasis( Reference Tisza, Zhao and Fuentes 91 ). Therefore, the unique phase separation in human CD4+ T cell GPMV by high-dose n-3 PUFA may be a biomarker for predicting the potential of n-3 PUFA to suppress chronic disease progression.
Immunometabolism is emerging as a key regulator of both T cell fate and function. Canonically, it is thought that T cell activation primarily engages glycolytic pathways for energy production( Reference Pearce, Poffenberger and Chang 43 ). The switch to glycolytic metabolism increases the availability of carbon sources which can be converted to biosynthetic precursors that are required for cellular proliferation( Reference Pearce 93 ). Our data are consistent this cell activation phenotype as the OCR:ECAR (oxidative phosphorylation:glycolysis) ratio decreased following activation (Fig. 1(A) and (B)), indicating that mitochondrial bioenergetics is a good indicator of human primary CD4+ T cell fate. The significantly lower OCR:ECAR ratio and proliferation index associated with high-dose n-3 PUFA in vitro (Fig. 2(A), (B) and (D)) are consistent with prior reports linking a reduction in the OCR:ECAR ratio with a suppressed cell proliferation phenotype in human glioblastoma cell lines( Reference Pike Winer and Wu 94 ) and CD4+ T cells( Reference Angela, Endo and Asou 95 ). In addition, the increased mitochondrial respiration-associated proton leak by high-dose n-3 PUFA (Fig. 2(C)) is consistent with a pro-apoptotic phenotype( Reference Fan, Ran and Toyokuni 96 ).
Our in vitro data strongly support the anti-proliferative potential of exogenous n-3 PUFA in human primary CD4+ T cells. At the 50 µm dose level, both exogenous EPA and DHA were incorporated into membrane phospholipids and altered membrane lipid order likely inducing phase separation. Furthermore, high-dose n-3 PUFA altered mitochondrial bioenergetics toward a less proliferative (lower OCR:ECAR) phenotype. This is important in view of the central role of CD4+ T cells in inflammatory disease modulation. In order to further validate the anti-proliferative effect of n-3 PUFA on CD4+ T cells in vivo, we conducted a pilot clinical study. n-3 PUFA supplementation for 6 weeks was not associated with a shift in mitochondrial bioenergetics or a decrease in cell proliferation. This may be attributed to the relatively low dose (2·4 g EPA and 1·6 g DHA), modest duration (6 weeks), and/or sample size of the study. In addition, it has been reported that healthy subjects are relatively insensitive to immunomodulation with n-3 PUFA, compared with patients with inflammatory conditions( Reference Sijben and Calder 97 ). Although there are examples of clinical studies using high doses of n-3 PUFA (17-20 g n-3 PUFA daily)( Reference Skarke, Alamuddin and Lawson 98 , Reference Phillipson, Rothrock and Connor 99 ), our 4 g daily dose regimen is already at the high limit approved by the Food and Drug Administration( Reference Zargar and Ito 76 ). Recently, Levental et al.( Reference Levental, Lorent and Lin 25 ) have proposed that 20 µm DHA reasonably approximates physiological DHA supplementation. However, our in vitro data suggest that this dose is still above the level obtained following FO supplementation (4 g/d for 6 weeks).
The beneficial effects of n-3 PUFA on inflammation and chronic diseases have been reported extensively( Reference Hou, McMurray and Chapkin 5 , Reference Calder 100 , Reference Eltweri, Thomas and Metcalfe 101 ). Although our in vivo data did not affirm an n-3 PUFA-induced anti-proliferative effect in freshly isolated human CD4+ cells from healthy elderly subjects, the alteration of membrane lipid order in those same cells may signal a subclinical modulatory response, as cell membrane order is a primary and fundamental mediator of many cellular processes( Reference Poggi, Mirabella and Neri 102 ). The fact that membrane phospholipids were enriched in EPA (Fig. 3) and membrane lipid order was significantly reduced (Fig. 4) by short-term intervention is encouraging, and implies that the immune-modulatory potential of n-3 PUFA cannot be dismissed. A recent meta-analysis( Reference Song, Nishihara and Cao 103 ), including >150 000 men and women over 20 years, demonstrated that an intake of >0·35 g n-3 PUFA daily was associated with a lower incidence of colorectal cancer with high-level CD4+ FOXP3+ T cell density. These findings suggest the role of n-3 PUFA in the immune-prevention of colorectal cancer via modulation of regulatory T cells.
In conclusion, we have demonstrated that a high in vitro dose of n-3 PUFA can alter human CD4+ T cell membrane FA composition, increase membrane fluidity by reducing lipid order, promote phase separation in GPMV, shift energy utilisation toward glycolysis, and reduce cell proliferation. We propose that the unique n-3 PUFA-mediated ‘phase separation’ of GPMV represents a novel phenotype/biomarker for probing the effect of dietary supplementation on cell membrane biophysics. Collectively, these findings provide evidence that both the T cell plasma membrane phospholipids and metabolic machinery are targets of n-3 PUFA. Our complementary pilot clinical trial only revealed modest effects of low-dose n-3 PUFA supplementation on T cell membrane order. This may be attributed to limited sample size (n 6), healthy condition of elderly subjects, and short-term (6 weeks) supplementation. In contrast, higher dosages are given in intensive care unit patients( Reference Martin and Stapleton 104 ) or after surgery( Reference de Miranda Torrinhas, Santana and Garcia 105 , Reference Berger, Delodder and Liaudet 106 ) to reduce inflammation( Reference Glenn and Wischmeyer 107 ) and exhibit an effect within 1 d of exposure( Reference Delodder, Tappy and Liaudet 108 ). We suggest that only at higher dosages do n-3 PUFA have meaningful effects on membrane order and resultant immunomodulation. Future clinical studies with larger sample size, longer intervention periods, and higher doses of FO supplementation are needed to better elucidate the rational use of dietary n-3 PUFA as an adjunct to conventional immunotherapies.
Acknowledgements
The authors would like to thank Dr Xiang Xiao at the Houston Methodist Hospital for assisting with the optimisation of the human CD4+ T cell isolation procedure, Dr Ilya Levental at the University of Texas – Houston, McGovern School of Medicine for assisting with optimisation of T cell GPMV isolation, Dr Cory Klemashevich for fatty acid methyl ester Mass Spec quantification, Ms Jennifer Goldsby for assistance with statistical analyses and Ms Rachel Wright for table formatting.
This work was supported in part by a Texas A&M University Health Science Center Clinical Science and Translational Research Institute Pilot Grant and NIH R35CA197707 to R. S. C. Both funders had no role in the design, analysis or writing of this article.
Conceived and designed the experiments: Y.-Y. F., T. Y. H. and R. S. C. Performed the experiments: Y.-Y. F., N. R. F., R. B., T. Y. H., N. E. P. D. and M. P. K. J. E. Analysed the data: Y.-Y. F. and N. R. F. Wrote the manuscript: Y.-Y. F., N. R. F., R. S. C. and D. N. M. Reviewed and critically revised the manuscript for important intellectual content: R. S. C., D. N., M., N. E. P. D. and X. C. L. All authors approved the final version of the manuscript.
None of the authors has any conflicts of interest to declare.
Supplementary material
For supplementary material/s referred to in this article, please visit https://doi.org/10.1017/S0007114517003385


