


Caffeine is the most widely consumed psychostimulant in the world and this is largely attributed to the widespread consumption and availability of caffeine in the diet(Reference Reyes and Cornelis1). After ingestion, caffeine is quickly absorbed and reaches maximum blood concentrations within 30 to 60 min(Reference Arnaud2,Reference Fredholm, Battig and Holmen3) . The half-life of caffeine averages 4–6 h but is highly variable between individuals as a result of genetic and environmental factors(Reference Arnaud2,Reference Gunes and Dahl4,Reference Thorn, Aklillu and Klein5) . Many of these factors impact the activity of cytochrome P450 (CYP)1A2, an enzyme responsible for over 95 % of caffeine metabolism(Reference Gunes and Dahl4,Reference Thorn, Aklillu and Klein5) .
In the clinical setting, fasting glucose levels have consistently been shown to increase when caffeine or regular (but not decaffeinated) coffee is consumed within 1 h of blood draw(Reference Emami, Khorshidi and Zarezadeh6). Few clinical studies have examined the acute effects of caffeine on cholesterol, TAG or other cardiometabolic biomarkers(Reference Shechter, Shalmon and Scheinowitz7–Reference Cheung, Gupta and Ito9). Most populations consume the majority of their caffeine in the form of coffee or tea; beverages containing dozens of other compounds that might attenuate or augment the acute biological effects of caffeine. With habitual consumption, coffee and tea may also protect against type 2 diabetes and CVD(Reference Yang, Wang and Fan10–Reference Poole, Kennedy and Roderick12). Separating the acute and chronic biological effects of each beverage compound, however, is a challenge in population studies and experimental approaches may not directly generalise to humans(Reference Cornelis13). Moreover, an acute effect of caffeine on glucose, cholesterol or other cardiometabolic indices may have clinical implications since these biomarkers are often used for screening, diagnostic or monitoring purposes(14,Reference Genest, McPherson and Frohlich15) .
The present study leverages unique information collected from a large free-living sample to investigate the impact of recent caffeine intake on biomarkers of ‘cardiometabolic’ function while also accounting for lifestyle and genetic variation related to caffeine metabolism and drinking behaviour.
Methods
Participants and assessment overview
In 2006–2010, the UK Biobank recruited over 502 633 participants aged 37–73 years at twenty-two centres across England, Wales and Scotland(16). Participants completed touchscreen questionnaires, an in-person questionnaire, a physical assessment and a biospecimen collection period (see online Supplementary Methods). The assessment order of operations are presented in online Supplementary Table S1 and took about 90 min to complete. This study was covered by the generic ethical approval for UK Biobank studies from the National Research Ethics Service Committee North West – Haydock (approval letter dated 17 June 2011, Ref 11/NW/0382), and all study procedures were performed in accordance with the World Medical Association Declaration of Helsinki ethical principles for medical research.
Recent caffeine drinking
Participants were not asked to fast prior to the assessment visit. Upon arrival to the centre, participants were advised that water would be available at all times during the visit and that tea/coffee would be available at the end of the visit after blood sampling. During the physical assessment period, participants were asked whether they had drunk caffeine within the hour prior to doing the spirometry test. Participants replied Yes or No. A blood sample was collected about 15 min after spirometry testing and at that time participants were asked to provide ‘Time since last meal or drink (except plain water)’ (i.e. fasting time).
Serum cardiometabolic biomarkers
Non-fasting venous blood sampling was conducted by validated collection procedures as detailed elsewhere(17). Blood samples were transferred to a dedicated central laboratory between 2014 and 2017 and stored at −80 °C until analysis(18). Biomarker measures were performed using enzymatic (glucose, total cholesterol (tChol) and TAG), immuno-turbidimetric (apoB, apoA1, high-sensitivity C-reactive protein (CRP), lipoprotein(a)), enzyme immuno-inhibition (HDL) or enzymatic selective protection (LDL) methodology on the Beckman Coulter AU5800 platform. Three levels of internal quality control were used for each assay: low, medium and high concentration. CV across these three levels ranged from 6·1 % (lipoprotein(a)) to 1·4 % (tChol) with most in the 1–2 % range. Erythrocyte glycated Hb (HbA1c) was measured by HPLC on a Bio-Rad Variant II Turbo. Two levels of internal quality control, low and high concentration, were used for this assay and CV were 2·1 and 1·5 %, respectively. All biomarker values determined invalid by the UK Biobank Biomarker Working Groups were set missing. Further details of these measurements and assay performances can be found in the UK Biobank online showcase and protocol(19). We additionally excluded biomarker values ± 4 sd of mean which applied to <1·4 % of the data. Non-HDL was calculated as tChol minus HDL
Potential confounders and effect modifiers
The touchscreen questionnaire included a FFQ that captured, among other diet items, coffee and tea intake(Reference Bradbury, Young and Guo20). For coffee intake, participants were asked ‘How many cups of coffee do you drink each day (include decaffeinated coffee)’. Participants either selected the number of cups, ‘less than one’, ‘do not know’ or ‘prefer not to answer’. Coffee drinkers were additionally asked about the type of coffee they usually consume and selected one of: decaffeinated (any type), instant coffee, ground coffee or other. A similar question was asked about tea (‘include black and green tea’). Other dietary sources of caffeine were not captured by the FFQ. We estimated total caffeine (mg/d) from (regular) coffee and tea by assigning each cup 75 and 40 mg of caffeine, respectively. Estimated caffeine consumption on a per body weight basis (i.e. mg/kg) was also derived. In a subset of 126 776 participants who completed multiple online 24-h dietary recalls in 2009–2012(Reference Bradbury, Young and Guo20,Reference Liu, Young and Crowe21) , the correlation (r) between their FFQ and mean dietary recall of coffee and tea intake was 0·82 and 0·81, respectively. Self-reported information on several covariates functioning as potential confounders were also collected during the UK Biobank assessment as described in detail previously(16). For the present analysis, we considered baseline smoking status, Townsend deprivation index (a composite socio-economic status metric based on employment status, car/home ownership and household crowding(Reference Townsend, Phillimore and Beattie22)), education, income, home ownership, physical activity, ethnicity, employment status, BMI, waist-to-hip ratio (WHR), self-rated health, alcohol intake, fish intake, red meat intake, fruit intake, vegetable intake, diabetes (disease or insulin use), CVD (myocardial infarction, angina or stroke), aspirin use and cholesterol-lowering or antihypertensive medication use.
Genetic data
All UK Biobank participants were genotyped using genome-wide arrays as detailed online(23). Quality control and imputation to the HRC v1.1 and UK10K reference panels were performed centrally by the Wellcome Trust Centre for Human Genetics(23). We excluded sample outliers based on heterozygosity and missingness, participants with sex discrepancies between the self-reported and X-chromosome heterozygosity, and those potentially related to other participants, based on estimated kinship coefficients for all pairs of samples. Moreover, we limited the genetic analysis to unrelated individuals who self-report as ‘British’ and who have very similar ancestral backgrounds based on results of principal component analysis(23). From the imputed/genotyped SNP, we selected genome-wide association confirmed SNP for circulating caffeine metabolites and coffee/tea/caffeine drinking behaviour with plausible links to caffeine metabolism/response and that have minor allele frequencies ≥0·01 (Table 1 and online Supplementary Table S2)(Reference Cornelis and Byrne24–Reference Zhong, Kuang and Danning28). We supplemented this list with commonly studied candidates: rs762551 (CYP1A2) and rs5751876 (ADORA2A)(Reference Cornelis29). We further included SNP near GCKR and MLXIPL because they associate with both coffee drinking behaviour and cardiometabolites of interest.
Table 1. SNP for coffee- and caffeine-related traits based on genome-wide association studies (GWAS)(Reference Cornelis and Byrne24–Reference Zhong, Kuang and Danning28) *

EA, effect allele; OA, other allele; EAF, effect allele frequency (based on HapMap data); EU, European ancestry.
* Listed are SNP examined in the present study (see online Supplementary Table S2 for more details). rs5751876 (ADORA2A) is a candidate SNP selected from the literature(Reference Cornelis29).
Statistical analysis
Information on recent caffeine intake, habitual coffee and tea intake and data for at least one biomarker at baseline was available for 447 794 participants; 370 193 were included for genetic analysis. The number of participants varied across biomarkers (online Supplementary Table S1). CRP, lipoprotein(a) and TAG values were log-transformed before analysis because they were not distributed normally. All analyses proceeded separately for men and women. Student’s t tests, analysis of variance and χ 2 tests were used as appropriate for comparisons of means and proportions between recent and non-recent caffeine consumers and across genotypes.
We examined the association between recent caffeine intake (yes v. no) and each biomarker using linear regression adjusting for age, ethnicity, assessment centre, date of blood draw (deciles) and fasting time (model 1). In a second multivariable regression model, we further adjusted for baseline smoking (never, past, current: <10, 10 to 19, 20+ cigarettes/d), Townsend deprivation index (quartiles, higher scores/quartiles~higher deprivation), education (college or university degree, Advanced (A) levels/AS levels or equivalent, O levels/General Certificate of Secondary Education (GCSE) or equivalent, Certificate of Secondary Education (CSE) or equivalent, National Vocational Qualification (NVQ) or Higher National Diploma (HND) or Higher National Certificate (HNC) equivalent, or other professional qualifications), income (four levels), home ownership (yes and no), physical activity (quartiles of moderate/vigorous activity minutes/week), employment status (employed, retired and other), WHR (quartiles), BMI (<23, 23 <25, 25 <30, 30+ kg/m2), oral contraceptive use (women only), postmenopausal hormone use (women only), self-rated health (excellent, good, fair and poor), aspirin use (yes and no), cholesterol-lowering medication use (yes and no), antihypertension medication use (yes and no), diabetes (yes and no), CVD (yes and no), and habitual intakes of water, alcohol, fish, red meat, fruits and vegetables (quartiles of servings/d) as well as coffee and tea (each modelled: none, <1, 1, 2–3, 4–5, 6–7 and ≥8 cups/d) (model 2). Results were similar for a model without adjustment for coffee and tea intake. Missing indicator variables were constructed to maximise sample size but were required for <5 % of the sample (see online Supplementary Table S1). To determine the clinical relevance of significant linear associations, we examined the risk of subnormal biomarker levels with recent caffeine intake by applying clinical cut points to each biomarker and performing logistic regression adjusting for model 2 covariates listed above.
In sensitivity analysis, we excluded individuals reporting diabetes, CVD or the use of cholesterol-lowering or antihypertension medication. Statistical significance was defined as P < 0·005, after applying a correction for the number of biomarkers (P = 0·05/(10 biomarkers)). We screened interactions with age (<55 or ≥55 years of age, median), habitual coffee/tea drinking (cups/d, heavy or light), caffeine (mg/d, high or low), smoking (non-smoker and current smoker), fasting status (<6 or 6+ h, cut-point chosen for power and clinical relevance), BMI (≤25, 25+ kg/m2) and WHR (≤0·85/0·9 and >0·85/0·9 for women and men, respectively) by including in multivariate regression models the cross-product term of recent caffeine intake with the interacting variable. Table 1 SNP main effects and SNP × recent caffeine interactions on biomarkers were also tested using the same models described above and assuming an additive allele model. We did not combine SNP for a ‘genetic score’ since each locus captures a unique potential mechanism linking recent caffeine exposure to biomarker. Significant interactions were also defined as P < 0·005, and the nature of these interactions was described by stratified analysis.
Results
Participant characteristics
Descriptive characteristics of participants who reported recent caffeine drinking and those who did not are presented in Table 2. Among both men and women, recent caffeine drinkers were slightly younger and more likely to be current smokers, employed, have a higher Townsend deprivation index (more deprivation), a university or college degree and to consume more coffee (particularly of the regular ground type) compared with non-recent caffeine drinkers but were less likely to report a history of heart disease and the use of blood pressure or heart medication. As anticipated, recent caffeine drinkers also reported shorter fasting times; however, a proportion of these also reported fasting longer than an hour. For example, 27·0 % reported fasting for 3+ h and 4·6 % for 8+ h. Corresponding values for non-recent caffeine drinkers were 45·5 % and 3·5 %. SNP rs6968554 was nominally associated with recent caffeine intake in both men and women (P < 0·02, online Supplementary Table S3), but differences were minimal: 47 % of recent caffeine drinkers were G carriers (linked to increased habitual caffeine/coffee intake) compared with 46 % of non-recent drinkers. All SNP were associated with habitual coffee intake in both men (P < 0·002) and women (P < 0·0006) and in the direction expected based on previous publications (Table 1). Similar patterns were observed for regular, instant, ground/filtered and decaffeinated coffee as well as tea. SNP rs1260326, rs2472297, rs6968554, rs762551 and rs7800944 were associated with other lifestyle factors and were consistent for men and women (all P < 0·001, online Supplementary Table S3).
Table 2. Characteristics of UK Biobank participants according to recent caffeine drinking*
(Numbers and percentages; mean values and standard deviations)
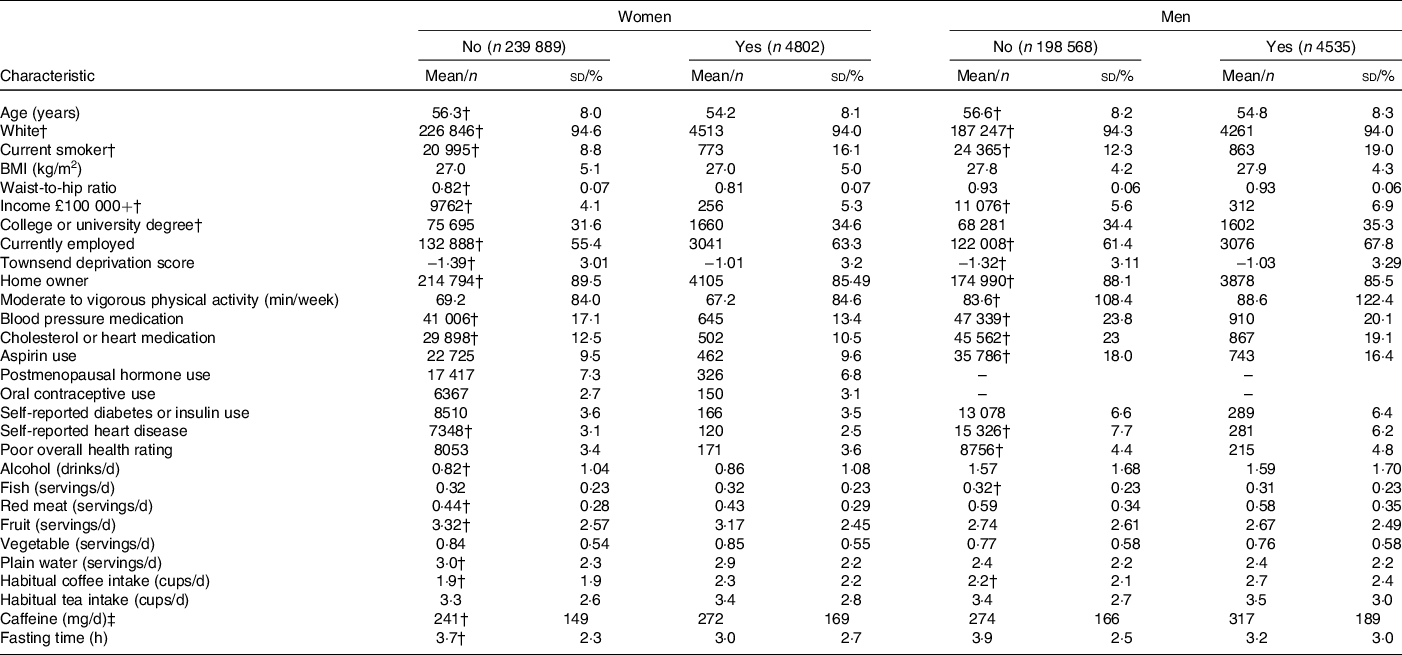
* Data drawn from 2006 to 2010 for participants with information on recent caffeine drinking, habitual coffee and tea intake and who had data on at least one biomarker.
† Significantly different between women (or men) reporting recent and no recent caffeine drinking (P < 0·05).
‡ Derived from regular coffee and tea only.
Recent caffeine drinking and cardiometabolic biomarkers
In minimally adjusted regression models, recent caffeine drinking was associated with higher apoB/apoA1, CRP and glucose levels compared with non-recent caffeine drinking (Table 3). In fully adjusted models, the association between recent caffeine drinking and glucose levels remained statistically significant (P < 0·0001). Unadjusted and multivariable adjusted (geometric) mean biomarker concentrations are presented in online Supplementary Table S4. Men and women reporting recent caffeine intake had an OR (95 % CI) of 1·65 (95 % CI 1·36, 2·01) and 2·15 (95 % CI 1·69, 2·73) (P < 0·0001), respectively, for having glucose levels above the clinical threshold: 5·6 mmol/l for fasting (≥8 h) and 7·8 mmol/l for non-fasting measures. Similar results were observed when excluding participants reporting diabetes, CVD and use of related medication (P < 0·0001) although OR were slightly higher (1·97 (95 % CI 1·47, 2·64) for healthy men and 2·25 (95 % CI 1·63, 3·13) for healthy women).
Table 3. Associations between recent caffeine drinking and cardiometabolic biomarkers*
(β-Coefficients and 95 % confidence intervals)
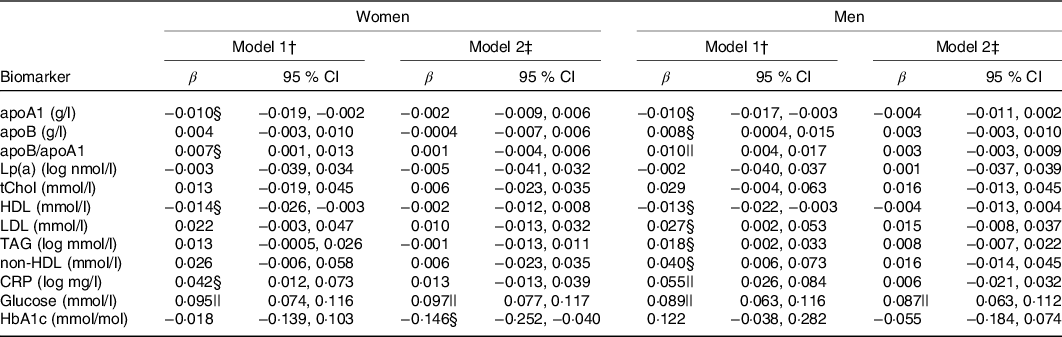
Lp(a), lipoprotein(a); tChol, total cholesterol; CRP, high-sensitivity C-reactive protein; HbA1c, glycated Hb A1c.
* Results from multivariable linear regressions. β-Coefficients represent change in biomarker concentration with recent caffeine drinking relative to non-recent caffeine drinking. CRP, Lp(a) and TAG concentrations were log-transformed prior to analysis and thus β-coefficients represent percentage change.
† Model 1: adjusted for age, race, date of blood draw, fasting time and assessment centre.
‡ Model 2: adjusted for age, race, date of blood draw, fasting time, assessment centre, Townsend deprivation index, education, income, employment status, home ownership, smoking, physical activity, waist-to-hip ratio, BMI, oral contraceptive use (women only), postmenopausal hormone use (women only), self-rated health, aspirin use, cholesterol-lowering medication use, antihypertension medication use, history or diabetes, history of CVD and habitual intakes of water, alcohol, fish, red meat, fruits, vegetables, coffee and tea.
§ P < 0·05.
|| P < 0·002.
Age, WHR, BMI and fasting status significantly modified the relationship between recent caffeine drinking and glucose levels (Table 4). Larger effect sizes were observed in those fifty-five years or older, with a higher WHR, with a higher BMI or with longer fasting times. Race, smoking status and habitual coffee, tea and caffeine intake did not significantly modify the association between recent caffeine drinking and cardiometabolic biomarker levels (P ≥ 0·02).
Table 4. Age-, waist-to-hip ratio (WHR)-, BMI- and fasting-stratified associations between recent caffeine drinking and serum glucose levels (β, mmol/l) and risk (OR) of subnormal* glucose levels
(β-Coefficients and 95 % confidence intervals; odds ratios)
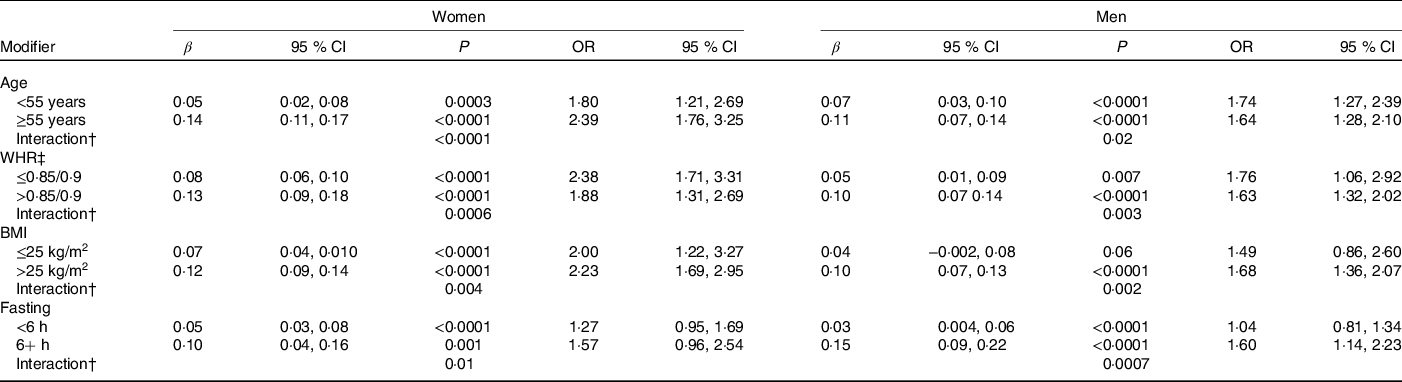
* Results from linear (β) or logistic (OR) regression models adjusting for age, race, date of blood draw, fasting time, assessment centre, Townsend deprivation index, education, income, employment status, home ownership, smoking, physical activity, waist-to-hip ratio, BMI, oral contraceptive use (women only), postmenopausal hormone use (women only), self-rated health, aspirin use, cholesterol-lowering medication use, antihypertension medication use, history or diabetes, history of CVD and habitual intakes of coffee, tea, water, alcohol, fish, red meat, fruits and vegetables. Defined as glucose levels above the clinical threshold: 5·6 mmol/l for fasting (≥8 h) and 7·8 mmol/l for non-fasting measures.
† WHR cut-points are sex-specific: 0·85 for women and 0·9 for men.
‡ Interaction, P value for interaction between recent caffeine intake and (i) age (ii) WHR or (iii) BMI on serum glucose levels.
SNP main effects and SNP × caffeine interactions on cardiometabolic biomarkers
The associations between SNP and biomarkers are presented in online Supplementary Table S5. Most significant associations were expected based on previous genome-wide association studies (i.e. online Supplementary Table S2). For example, at least nominally significant associations were observed between GCKR rs1260326 and ten biomarkers, ABCG2 rs1481012 and seven biomarkers, and MLXIPL rs7800944 and six biomarkers. POR rs17685 was associated with apoB, tChol, LDL, TAG, non-HDL and CRP in both men and women (P < 0·05). CYP1A2 rs2472297 was associated with CRP (P < 0·005) and AHR rs6968554 with TAG, CRP and glycated Hb (HbA1c) (P ≤ 0·008). Results from analysis adjusted for recent caffeine drinking or habitual coffee and tea intake were not markedly different from those of unadjusted analysis. Other significant SNP-biomarker associations were observed but were sex-specific.
Significant rs2472297 × caffeine and rs7800944 × caffeine interactions on glucose levels were observed among women (P = 0·004, Table 5). Women with CYP1A2 rs2472297 CC or CT genotypes had over 2-fold higher glucose levels with recent caffeine drinking when compared with those with the TT genotype. These differences by genotypes were also of clinical relevance. A similar but much weaker interaction pattern was observed among men. Women with MLXIPL rs7800944 CC genotype had higher glucose levels with recent caffeine intake when compared with those with TT or TC genotypes; differences which also translated into greater risk of subnormal glucose levels. A similar but much weaker interaction pattern was observed among men. Men with ABCG2 rs1481012 AA and AG genotypes (but not GG genotypes) had lower apoB with recent caffeine intake compared with no recent caffeine intake (P = 0·004 for rs1481012 × caffeine interaction). The same pattern was also observed for tChol, non-HDL and LDL, but interactions were only nominally significant (P ≤ 0·009). These rs1481012 × caffeine interactions were neither clinically relevant nor were they supported to any degree by analysis among women.
Table 5. SNP-stratified associations between recent caffeine drinking and serum glucose levels (β, mmol/l) and risk (OR) of subnormal* glucose levels
(β-Coefficients and 95 % confidence intervals; odds ratios)
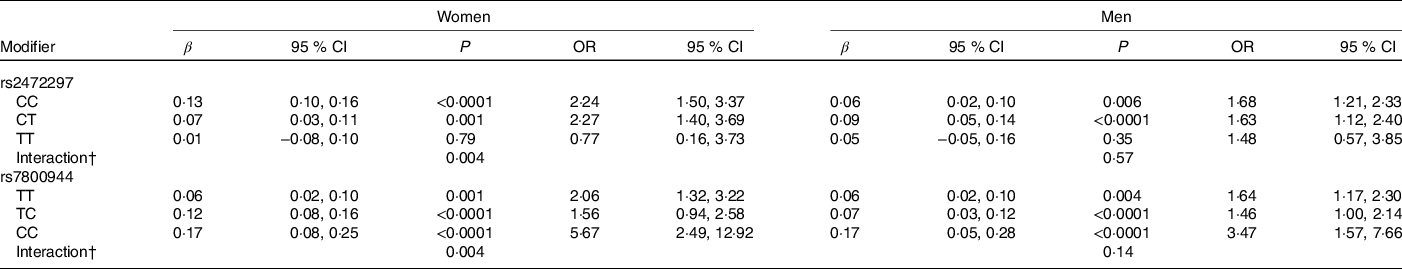
* Results from linear (β) or logistic (OR) regression models adjusting for age, race, date of blood draw, fasting time, assessment centre, Townsend deprivation index, education, income, employment status, home ownership, smoking, physical activity, waist-to-hip ratio, BMI, oral contraceptive use (women only), postmenopausal hormone use (women only), self-rated health, aspirin use, cholesterol-lowering medication use, antihypertension medication use, history or diabetes, history of CVD and habitual intakes of coffee, tea, water, alcohol, fish, red meat, fruits and vegetables. Defined as glucose levels above the clinical threshold: 5·6 mmol/l for fasting (≥8 h) and 7·8 mmol/l for non-fasting measures.
† Interaction, P value for SNP × caffeine interaction based on linear regression model.
Discussion
The present study is the first to examine the acute effects of caffeine on cardiometabolic biomarkers in a free-living environment, wherein no restrictions on caffeine intake or fasting were enforced. Men and women who reported drinking caffeine within about 1 h of blood draw had higher glucose levels than those not drinking caffeine within the hour. Recent caffeine drinking was not associated with HbA1c, a measure of long-term glucose control, or other serum cardiometabolic markers.
The cardiometabolic measures examined in the present study are commonly assayed in the clinic and often used for screening, diagnostic or monitoring purposes(14,Reference Genest, McPherson and Frohlich15) . The same measures also serve as traditional biomarkers of type 2 diabetes and CVD in epidemiological studies(Reference Kolberg, Jørgensen and Gerwien30,Reference Mahmood, Levy and Vasan31) . In these clinical and observational settings, individuals are often asked to fast prior to blood collection. Almost a third of UK Biobank participants who reported caffeine drinking within an hour of blood draw also reported fasting from food and beverage for at least 3 h and thus aligns with previous work highlighting discrepancies with what constitutes ‘fasting’(Reference Nybo, Grinsted and Jørgensen32). When accounting for fasting status, either adjustment or stratification, the association between recent caffeine drinking and glucose remained, but the strength of the association was greater among those ‘fasting’ 6+ h. Coffee and tea are major caffeine sources that are naturally devoid of energy. Guidelines for fasting including specifics concerning liquids vary by country(Reference Nybo, Grinsted and Jørgensen32,Reference Simundic, Cornes and Grankvist33) . Any impact of recent caffeine drinking on serum biomarkers, therefore, has implications for both clinical and epidemiological studies. Oral glucose tolerance tests are used to define pre-diabetes and type 2 diabetes and in epidemiological studies they are considered superior to self-report. Discrepant fasting definitions and the significant positive association between recent caffeine drinking and subnormal (pre-diabetic) glucose levels may potentially contribute to measurement error in case ascertainment defined by glucose levels. Similar concerns might not be warranted for other cardiometabolic markers investigated in the present study, since these were not impacted by recent caffeine intake.
The association between recent caffeine drinking and glucose levels, particularly when having ‘fasted’ for 6+ h, is consistent with acute clinical trials: fasting glucose levels have consistently been shown to increase when caffeine or regular (but not decaffeinated) coffee is consumed within 1 h of blood draw(Reference Emami, Khorshidi and Zarezadeh6). Known between-person variation in caffeine metabolism or sensitivity is rarely considered in acute clinical studies(Reference Gunes and Dahl4,Reference Thorn, Aklillu and Klein5) . The present study adjusted for a number of factors that can alter caffeine metabolism such as smoking, oral contraceptive use, and habitual alcohol and caffeine intake(Reference Gunes and Dahl4,Reference Thorn, Aklillu and Klein5) . The relatively higher glucose levels with recent caffeine drinking was similar for light and heavy caffeine consumers suggesting that habitual caffeine consumers do not develop tolerance to the acute effects of caffeine on glucose levels. Linear effect estimates were greater among older individuals and among those with greater measures of adiposity. CYP1A2 activity may decrease with adiposity(Reference Kamimori, Somani and Knowlton34) and older age(Reference Parkinson, Mudra and Johnson35,Reference Chung, Kang and Park36) , thus prolonging the exposure to the effects of caffeine when caffeine is consumed. Other differences correlating with age and adiposity might also underlie the statistical interaction we observed since we observed no interaction with smoking, a well-established and strong inducer of CYP1A2 activity(Reference Gunes and Dahl4,Reference Thorn, Aklillu and Klein5) .
Considering a genetic marker of caffeine metabolism may overcome issues of confounding in cross-sectional studies of caffeine(Reference Cornelis37), and thus the availability of genetic information for the present study is a major strength. The significant interaction observed with CYP1A2 rs2472297 supports the hypothesis that individuals with impaired caffeine metabolism are more susceptible to the acute adverse effects of caffeine on glucose levels. Individuals with the rs2472297 T allele habitually consume more caffeine than individuals with the CC genotype but have relatively lower circulating caffeine levels(Reference Cornelis, Monda and Yu26,Reference Cornelis, Kacprowski and Menni27) . Thus, when consuming the same amount of caffeine within an hour of blood draw circulating (‘effective’) caffeine levels of rs2472297 T carriers may be lower than those with the CC genotype by the time of blood draw. The dual impact of the SNP on metabolism and drinking behaviour and lack of information on amount of caffeine recently consumed is an important caveat to consider but one that is more likely to have created a type 1 error than a type 2 error. SNP, including rs17685, rs6968554 and rs2472297, while robust loci for caffeine/coffee-related traits, were also associated with biomarkers of interest and lifestyle factors; some expected and others not. Whether these observations are evidence for SNP pleiotropy or causal associations between caffeine intake and these lifestyle factors or biomarkers is an open question(Reference Cornelis and Munafo38). Nevertheless, they do dispute our earlier claims that individual’s with ‘slow metabolizer’ genotypes differ from those with ‘fast metabolizer’ genotypes only with respect to caffeine exposure(Reference Cornelis29).
We also observed an interaction between recent caffeine intake and rs7800944 for glucose levels, whereby the association between recent caffeine intake and glucose levels was strongest among those with a rs7800944 C allele than among those with the TT genotype. rs7800944 maps to MLXIPL (Max-like protein X interacting protein-like), encoding the carbohydrate response element binding protein (ChREBP) and the C allele has been associated with decreased cholesterol levels, increased fasting glucose and increased coffee and alcohol drinking behaviour relative to the T allele (online Supplementary Table S2). The associations with lipid and glucose levels align with the established role of ChREBP in lipogenesis and glycolysis(Reference Abdul-Wahed, Guilmeau and Postic39). ChREBP activity also promotes the release of hepatokines, among which is FGF21 that has a role in sweet taste and alcohol preference(Reference Abdul-Wahed, Guilmeau and Postic39). This latter function of ChREBP might contribute to coffee and alcohol drinking behaviour since there is little support for its role in caffeine or alcohol metabolism(Reference Cornelis, Kacprowski and Menni27). C carriers who have a pre-disposition for high glucose levels might also prefer sweetened coffee which, if consumed close to blood draw, may explain the interaction we observed. However, lack of evidence linking MLXIPL variation to other sweet preference behavior(Reference Zhong, Kuang and Danning28) or an interaction with sugar-sweetened beverages on glucose levels(Reference McKeown, Dashti and Ma40) suggests an alternative mechanism is likely.
The precise mechanism by which acute intake of caffeine-containing beverages increases glucose levels is unclear but likely involves adenosine receptor antagonism and some degree of adrenergic stimulation(Reference Fredholm, Battig and Holmen3,Reference Koupenova and Ravid41,Reference Battram, Arthur and Weekes42) . Caffeine antagonises adenosine receptors which have roles in regulating insulin secretion, glucose release and clearance, glycogenolysis, and glycogenesis(Reference Koupenova and Ravid41). While epinephrine elevations are similar after intakes of supplemental caffeine and regular coffee, resulting elevations in glucose, free fatty acids and glycerol, are attenuated following coffee intake(Reference Battram, Arthur and Weekes42). Indeed, we cannot discount the possibility that other constituents of caffeine-containing beverages might independently increase glucose levels or augment the effects of caffeine on glucose. A more comprehensive follow-up study on interactions between acute caffeine intake and genetic variation in these two pathways will be worth pursuing in the future.
Few controlled studies have examined the acute effects of caffeine intake on other cardiometabolic biomarkers. Shechter et al.(Reference Shechter, Shalmon and Scheinowitz7) reported a significant decrease in CRP levels, but no changes in fasting tChol, LDL, HDL or TAG an hour after administering 200-mg caffeine capsule compared with a placebo. A fasting lipid profile obtained before and 30–60 min after a single serving of regular coffee yielded lower TAG levels, when coffee contained creamer/sugar, higher tChol and HDL, when coffee was consumed black, and no impact on LDL(Reference Zargar, Auttapibarn and Hong8,Reference Cheung, Gupta and Ito9) . In the present study, we observed no association between recent caffeine drinking and cholesterol or CRP levels. However, data pertaining to the type and preparation of the caffeine beverage will be needed to discount any impact recent caffeine drinking has on cholesterol or other cardiometabolic biomarkers under non-clinical conditions.
Strengths of the present study include the novel exposure for a very large sample size and comprehensive list of lifestyle and genetic factors that potentially confound or modify the association between recent caffeine drinking and cardiometabolic markers. Lack of details on the time, beverage source and amount of caffeine consumed prior to blood draw are key weaknesses of the present study. The associations observed, for example, do not account for how beverages were prepared and whether they contained sugar or other additives. The UK Biobank is also not representative of the sampling population, with evidence of a ‘healthy volunteer’ selection bias(Reference Fry, Littlejohns and Sudlow43), and thus extrapolation of our findings to a more general population is limited.
Caffeine-containing beverages are routinely consumed by many individuals around the world. Our findings suggest caffeine drinking within an hour of blood draw presents with relatively higher serum glucose levels particularly among older and overweight or obese individuals. SNP × caffeine interactions support a specific role of caffeine underlying the association but also point to other potential mechanisms warranting further study. Findings from the present study of recent caffeine drinking may not necessarily extend to habitual caffeine intake but may rather explain, in part, discrepancies between clinical studies and epidemiological studies of caffeine-containing beverages and cardiometabolic health. Nevertheless, future investigations of recent caffeine intake in free-living individuals should take into consideration the type and preparation of the caffeine-containing beverage.
Acknowledgements
This research has been conducted using the UK Biobank Resource (application no. 21394). Computations in this paper were run on the Quest cluster supported in part through the computational resources and staff contributions provided for the Quest high performance computing facility at Northwestern University, which is jointly supported by the Office of the Provost, the Office for Research and Northwestern University Information Technology.
This work was supported by the National Institute on Aging (NIA, K01AG053477).
M. C. C. designed and conducted the research, analysed the data, wrote the paper and had primary responsibility for final content.
The author declares that there are no conflicts of interest.
Supplementary material
For supplementary material referred to in this article, please visit https://doi.org/10.1017/S0007114520004377


