


Increasing consumption of fat-rich diets and reduced physical activity are the major contributors to the observed increase in body weight, diabetes and fatty liver diseases in many developed and developing countries, and have become a major public health concern(Reference Bullo, Casas-Agustench and Amigo-Correig1–Reference Gentile and Pagliassotti4). Lipids play varied and critical roles in cellular metabolism, with functions dramatically modulated by the individual fatty acid (FA) moieties in complex lipid entities. Moreover, biological membranes are composed of more than 50 % of lipids, and the quantity and quality of dietary lipids are known to have an impact on the composition, characteristics and functions of the biological membrane(Reference Lee5–Reference Aoun, Michel and Fouret7). FA as components of biological membranes strongly influence membrane fluidity, which, in turn, may influence many physiological processes involved in cell death and survival such as signal transduction, protein import, membrane receptor function and metabolite transport(Reference Simkiss8). Moreover, the quality of administered lipid seems to play a crucial role in the occurrence (or not) of these alterations and their severity(Reference Ghafoorunissa9). Therefore, both the quantity and quality of lipids should be taken into account in nutritional and metabolic studies.
The most important role of mitochondria is the production and cell's supply of ATP, which is used as a source of energy, and their dysfunction may play an important role in the pathogenesis of several chronic diseases(Reference Johannsen and Ravussin10). The quantity and quality of dietary lipids may modulate cellular metabolism and energy store and expenditure, particularly by modulating lipid metabolism and mitochondrial functions(Reference Barzanti, Battino and Baracca11–Reference Yamaoka, Urade and Kito13). The function of proteins that regulate membrane flux across the mitochondrial membrane depends on their position and conformation, which are influenced by membrane phospholipid (PL) composition. Moreover, the respiratory chain enzymes are membrane protein complexes whose function depends on mitochondrial membrane fluidity, in particular the complex V (ATP synthase)(Reference Croset and Kinsella14, Reference Robblee and Clandinin15).
Previous studies have examined the effect of nature or/and quantity of the lipid in many different physiological and pathological models. However, most of these studies were interested in individual FA(Reference Croset and Kinsella14, Reference Ide, Murata and Sugano16–Reference Oliveira, Coelho and Barbeiro18) or in individual plant or animal oils(Reference Barzanti, Battino and Baracca11, Reference Robblee and Clandinin15, Reference Buettner, Parhofer and Woenckhaus19–Reference Power, Yaqoob and Harvey22) but not in nutritional lipid patterns. In the present study, we have investigated the effects of different nutritional patterns of dietary lipids (quantity and quality) on the most important mitochondrial functions in the rat liver. We are interested in the liver mitochondria because the liver is a very sensitive organ for the accumulation and metabolism of dietary lipids. Moreover, mitochondria are energy-sensor organelles and are involved in many cellular functions and survival. The present results indicated that 30 % fat diets led to profound modifications in the liver mitochondrial functions: a large modification in the PL composition of the mitochondrial membrane, an increase in fluidity and potential of the membrane, an increase in respiratory control ratio (RCR) and in complex V activity, and a decrease in complex III and IV activities and in β-oxidation. On the contrary, lipid quality had a limited impact on the mitochondrial functions, where only β-oxidation and complex III and IV activities were altered by the dietary lipid quality.
Materials and methods
Reagents
All reagents and chemicals applied in the study were of analytical grade. Acetoacetyl-CoA, bovine serum albumin, carbonyl cyanide m-chlorophenylhydrazone (CCCP), cytochrome c, 2,6-dichloroindophenol, dimethyl sulfoxide, 5,5′-dithiobis-2-nitrobenzoic acid, ethylene glycol tetraacetic acid, glutamate, HEPES, k-lactobionate, malate, NADH, 5-nitroxide stearate (5-NS), 16-nitroxide stearate (16-NS), Rhodamine 123 (RH-123), succinate, taurine and Tris were purchased from Sigma (Saint Quentin Falavier, France). Sucrose was purchased from Aldrich(Saint Quentin Falavier, France); KH2PO4 and ethanol from Prolabo (Strasbourg, France); MgCl2 from Merck and ADP from Boehringer (Meylan, France).
Animals and diets
The main objective of the present study was to define the quality of lipids corresponding to three experimental diets(Reference Buettner, Parhofer and Woenckhaus19, Reference Buettner, Scholmerich and Bollheimer23). Therefore, the basal diet (BD) was set up to have an equilibrated blend of different plant oils (40 % lard+25 % sunflower oil+25 % olive oil+10 % Colza oil), the lard diet to have large percentage of animal saturated lipids (90 % lard+10 % sunflower oil) and the fish oil diet to have a high percentage of marine polyunsaturated lipids rich in n-3 FA (35 % lard+20 % sunflower oil+20 % olive oil+5 % Colza oil+20 % fish oils (12 % tuna oil+8 % sardine oil)). We had thus two diets with an equal n-6:n-3 ratio of about 14 (basal and lard diets), and two diets with an equal PUFA:SFA ratio of about 1·1 (basal and fish oil diets).
A total of forty-eight young male Wistar rats (Charles River, L'Arbresle, France) aged 6 weeks were used in the present study. The rats were housed, two per cage, under conditions of constant temperature (20–22°C), humidity (45–50 %) and a standard dark cycle (20.00–08.00 hours). Our institutional guidelines for the care and use of laboratory animals were followed, and all experimental procedures were approved by the local ethics committee in Montpellier, France (reference CEEA-LR-11 009). The rats were randomised into six groups of eight animals each according to their body weight. The rats were fed for 12 weeks with one of the following semi-purified diets: D1, 5 % fat diet; D2, 5 % fat lard diet; D3, 5 % fat fish oil diet; D4, 30 % fat-equilibrated diet; D5, 30 % fat lard diet; D6, 30 % fat fish oil diet. The 5 % fat diets contain 5 % of fat and the 30 % fat diets contain 30 % fat. The detailed composition of these six diets is given in Table 1. The detailed FA composition of these diets is given in supplementary Table S1 (the material can be found at http://www.journals.cambridge.org/bjn). The rats were given free access to demineralised water and food. Body growth and diet consumption were determined weekly, and energy intake was calculated.
Table 1 Macronutrient diet composition*

BD5 %, basal diet with 5 % fats; LD5 %, lard-rich diet with 5 % fats; FOD5 %, fish oil-rich diet with 5 % fats; BD30 %, basal diet with 30 % fats; LD30 %, lard-rich diet with 30 % fats; FOD30 %, fish oil-rich diet with 30 % fats; FA, fatty acids.
* Food was prepared daily by mixing powdered diet with the appropriate amount of deionised water to form a semi-liquid food prepared on site.
† The control diet was set up to have an equilibrated blend of different animal and plant oils (40 % lard+25 % sunflower oil+25 % olive oil+10 % Colza oil). The LD was set up to have large percentage of animal saturated lipids (90 % lard+10 % sunflower oil). The FOD was set up to have a high percentage of marine polyunsaturated lipids rich in n-3 FA (35 % lard+20 % sunflower oil+20 % olive oil+5 % Colza oil+20 % fish oils (12 % tuna oil+8 % sardine oil)). These ratios were calculated after individual FA determination in each fatty compound by GC and taken into account the incorporation percentage of each fatty compound in the diet.
‡ Tuna oil (OMEGAVIE® Tuna oil 25 % DHA, purchased from Polaris, France) is a pale yellow oil produced from fresh tuna. It is refined and deodourised. Tuna oil is a TAG oil rich in n-3 FA and contains a minimum of 5 % EPA and 25 % DHA.
§ Sardine oil (OMEGAVIE® 1812 TG purchased from Polaris, France) is a pale yellow oil, refined and deodourised. The oil is processed from fish species containing high amounts of n-3 FA, in particular sardine. This oil is a TAG oil rich in n-3 FA and contains a minimum of 18 % EPA and 12 % DHA. We have made a mixture of these two fish oils to ensure a DHA:EPA ratio of about 0·66 in this mixture.
∥ AIN mineral mixture, expressed in g/kg of mixture: calcium phosphate dibasic, 500; NaCl, 74; potassium citrate monohydrate, 220; potassium sulphate, 52; manganese carbonate (43–48 % Mn), 3·5; ferric sulphate (16–17 % Fe), 6; zinc carbonate (70 % ZnO), 1·6; copper carbonate (53–55 % Cu), 0·3; potassium iodate, 0·01; sodium selenite, 0·01; chromium potassium sulphate, 0·55; sucrose, finely powdered, 118 g.
¶ AIN vitamin mixture, expressed in mg/kg of mixture: thiamine hydrochloride, 600; riboflavin, 600; pyridoxine hydrochloride, 700; nicotinic acid, 3000; d-calcium pantothenate, 1600; folic acid, 200; d-biotin, 20; cyanocobalamin, 1; retinyl palmitate premix (250 IU/mg), 1600; dl-tocopherol acetate (0·25 IU/mg), 20 000; cholecalciferol (400 IU/mg), 250; menaquinone, 50; sucrose, finely powdered, 972·9 g.
Sampling and mitochondrial isolation
Blood was obtained from 16 h fasted rats anaesthetised with pentobarbital (Ceva Santé Animale, Libourne, France) by puncturing the abdominal vein with a heparinised syringe (Sodium heparinate, Panpharma SA Fougères, France). Blood was then distributed into a dry tube (3–4 ml) and a heparinised tube (5–6 ml), centrifuged at 1000 g for 10 min at 4°C, and serum and plasma were collected and stored at − 80°C until analysis. Both adipose perirenal and epididymal tissues were sampled and weighed. The liver was perfused with 10 ml of 0·9 % NaCl solution, quickly removed and weighed, and the liver mitochondria were isolated by differential centrifugation as described(Reference Frezza, Cipolat and Scorrano24). Briefly, a sample of about 2 g of the liver was homogenised on ice in a ratio of 1 g wet tissue for 10 volumes of sucrose buffer (0·25 m-sucrose, 10 mm-Tris base, 0·5 mm-EDTA, pH 7·5) using a Polytron homogeniser. The homogenate was centrifuged at 900 g for 10 min at 4°C. The pellet was discarded, and the supernatant was centrifuged at 10 000 g for 10 min at 4°C. The mitochondrial pellet thus obtained was suspended, washed with 4 ml of sucrose buffer and centrifuged at 10 000 g for 10 min at 4°C. The final mitochondrial pellet was suspended in a 2 ml sucrose buffer, and aliquoted and kept at − 80°C for biochemical analyses. Mitochondrial respiration and membrane fluidity measurements were performed on fresh mitochondria. The protein content was determined according to Bradford(Reference Bradford25) with bovine serum albumin as the standard.
Liver and mitochondrial lipid measurement
Liver homogenates and liver mitochondrial suspensions were mixed with Triton X-100 (0·1 %), and NEFA, TAG and total cholesterol (TC) were quantified spectrophotometrically by enzymatic colorimetric methods using commercially available kits: Wako-NEFA-C kit (Oxoid, Dardilly, France); Cholesterol RTU kit; TAG PAP kit (Biomerieux, Lyon, France). For the PL assay, liver lipids and mitochondrial lipids were first extracted with the Folch mixture(Reference Folch, Lees and Sloane Stanley26): chloroform–methanol (2:1, v/v) containing butylated hydroxytoluene as an antioxidant. After centrifugation, the chloroform layer was collected and washed with NaCl (0·9 %), and phosphorus was quantified in order to determine the total PL content(Reference Bartlett27). To determine the FA composition of the total PL, the mitochondrial PL fraction was separated from other neutral lipids by TLC. The total PL was transesterified with an alkali mixture of KOH–methanol for 10 min at room temperature. The FA methyl esters were then analysed by GC (Agilent Technologies, Milan, Italy) equipped with a DB-23 column and a flame ionisation detector. GC conditions have been described elsewhere(Reference Ferreri, Chatgilialoglu and Armstrong28, Reference Puca, Andrew and Novelli29). Chromatograms were collected, and peaks were integrated and identified by comparison with commercially available references. The lipid composition of the liver mitochondrial membranes derived from rats that were fed the different types of diets was compared in terms of the percentage content of various FA.
Mitochondrial membrane fluidity measurement
The effect of dietary lipids on the fluidity of the liver mitochondrial membrane was assessed by spin labelling electron paramagnetic resonance spectroscopy(Reference Debouzy, Crouzier and Gadelle30). We used two spin labels: 5-NS and 16-NS. These FA incorporate the membrane bilayer, and the nitroxide groups provide information on motional freedom of the label in the system. Therefore, the former probes the superficial part of the membrane layer; the latter probes its hydrophobic core. The mitochondrial suspensions were labelled with 5 μl of the spin label solution (5 mm-5-NS or 10 mm-16-NS). After a 15 min incubation at room temperature, the sample was transferred by capillarity in a 20 μl Pyrex capillary tube. This tube was placed in a 3 mm diameter quartz holder and inserted into the cavity of the ESR spectrometer. The ESR spectra were recorded at controlled temperature (310 K) with the following conditions: microwave power, 10·00 mW; modulation frequency, 100 kHz; modulation amplitude, 2·58 G; receiver gain, 8 × 10⁴; conversion time, 40·96 ms; time constant, 81·92 ms. The sweep range was 100G with a central field value of 3435G for the 5-NS probe, and in the same condition except for modulation amplitude, 1·03 G; receiver gain, 105; conversion time, 40·96 ms; and time constant, 81·92 ms for 16-NS probe. The complete membrane incorporation of the spin labels was ascertained by the absence on the spectra of the extremely resolved ESR lines corresponding to free rotating markers.
Mitochondrial membrane potential measurement
The potential of the mitochondrial membrane was monitored according to the method described by Baracca et al. (Reference Baracca, Sgarbi and Solaini31). RH-123 was dissolved in ethanol and its exact concentration was checked spectrophotometrically at 507 nm (ɛ507 = 101 m/M per cm). RH-123 fluorescence measurements were made at 25°C with 45S Perkin–Elmer spectrofluorometer using a thermostatic apparatus. RH-123 fluorescence was measured at 495 nm (excitation) and 525 nm (emission) under conditions of continuous stirring. Changes in the mitochondrial potential (Δψ) have been evaluated by measuring RH-123 fluorescence quenching at the following steps: with RH-123 label alone (2 μm) in a MIRO5 buffer (110 mm-sucrose, 20 mm-HEPES, 10 mm-KH2PO4, 20 mm-taurine, 60 mm-k-lactobionate, 3 mm-MgCl2, 0·5 mm-EGTA, 1 g/l bovine serum albumin, pH 7·1) plus liver mitochondria (0·25 mg proteins), plus glutamate–malate–succinate (2·5:5:5 mm), plus ADP (0·5 mm) and CCCP (2 μm).
Mitochondrial respiration and respiratory control ratio determination
Mitochondrial respiration was determined by measuring the mitochondrial oxygen consumption in two 2 ml air-tight thermostatted chambers of high resolution Oxygraph (Oroboros Oxygraph2k, Autriche). The chambers were equilibrated with the MIRO5 respiration buffer at 37°C, and fresh mitochondria were then added (0·4 mg protein) followed by substrates malate–glutamate–succinate (2·5:5:5 mm, state 4) and ADP (0·5 mm, state 3). Maximal mitochondrial respiration was also measured in the presence of CCCP (2 μm). RCR was calculated as state 3:state 4 ratio rates of respiration.
Measurement of mitochondrial respiratory complex activities
Citrate synthase activity was measured according to Srere(Reference Srere32): the activity of the enzyme is measured by following the colour of 5-thio-2-nitrobenzoic acid, which is generated from the 5,5′-dithiobis-2-nitrobenzoic acid present in the reaction of citrate synthesis, and caused by the deacetylation of acetyl-CoA. The different mitochondrial respiratory complex activities were determined as described previously(Reference Feillet-Coudray, Sutra and Fouret33). Complex I activity was measured spectrophotometrically at 600 nm during 45 s by following the reduction of 2,6-dichloroindophenol by the electrons accepted from decylubiquinone, which itself was reduced after the oxidation of NADH by complex I(Reference Janssen, Trijbels and Sengers34). Complex II activity was measured spectrophotometrically at 600 nm by following the reduction of 2,6-dichloroindophenol by succinate during 120 s. Complex II+III activities were measured spectrophotometrically by following the oxidation of cytochrome c at 550 nm during 90 s(Reference Rustin, Chretien and Bourgeron35). Cytochrome c oxidase activity was measured spectrophotometrically by following the oxidation of the reduced cytochrome c at 550 nm during 30 s(Reference Wharton and Tzagoloff36).
ATPase activity (complex V) was determined spectrophotometrically as described by Teodoro et al. (Reference Teodoro, Rolo and Duarte37) with minor modifications. Briefly, the reaction was carried out at 37°C in 0·5 ml reaction medium (125 mm-sucrose, 65 mm-KCl, 2·5 mm-MgCl2 and 5 mm-HEPES, pH 7·4). After the addition of freeze-thawed mitochondria (0·25 mg), the reaction was initiated by adding 2 mm-Mg2+-ATP, in the presence or absence of oligomycin (1 μg/mg protein). After 10 min, 0·25 ml of 40 % TCA were added to stop the reaction. The samples were centrifuged for 5 min at 3000 g, and 0·5 ml of ammonium molybdate plus 0·5 ml H2O were then added to 0·25 ml of the supernatant. Absorbance at 660 nm was measured to determine the released inorganic phosphate. ATPase activity was calculated as the difference in absorbance in the presence and absence of oligomycin.
Measurement of mitochondrial β-oxidation activity
Mitochondrial β-hydroxyacyl-CoA dehydrogenase (β-HAD), a marker of the last step of mitochondrial β-oxidation activity, was determined spectrophotometrically according to the procedure described by Clayton et al. (Reference Clayton, Eaton and Aynsley-Green38). Briefly, liver mitochondrial suspensions (25 μg protein) were mixed with NADH and acetoacetyl-CoA in 1 ml of a 50 mm-Tris–HCl buffer, pH 7·0, and absorbance was followed at 340 nm for 60 s at 30°C.
Statistical analysis
The results are expressed as means and standard deviations. The effect of quantity and quality of the lipid and quantity × quality interactions were assessed by two-way ANOVA. Fisher's post hoc test was used to identify the effect of quality of the lipid. The limit of statistical significance was set at P < 0·05. Statistical analyses were performed using the StatView program (SAS Institute, Cary, NC, USA).
Results
Animal characteristics
Final body weight and gain weight remained statistically unchanged among the six experimental groups, although the 30 % fat lard diet-fed rats showed a body weight increase of about 15 % compared with the other five groups (Table 2). Therefore, when the three 30 % fat groups were statistically analysed separately, the 30 % fat lard diet-fed group showed a significant increase in body weight and in gain weight v. 30 % fat BD-fed and 30 % fat fish oil diet-fed groups. Adipose tissue weight only tended to increase in the 30 % fat diet-fed rats compared with the 5 % fat diet-fed rats. But the weight of the adipose tissue was particularly affected by the quality of the lipid, in which we observed a significant increase in this tissue weight in the 30 % fat lard diet-fed group (+35 %) compared with the other groups. As expected, liver weight increased in the 30 % fat diet-fed rats compared with the 5 % fat diet-fed rats, but quality of the lipid had no effect on liver weight (Table 2). Dietary intake decreased and energy intake increased in the 30 % fat diet-fed rats compared with the 5 % fat diet-fed rats. Moreover, dietary and energy intakes increased in the lard diet-fed rats compared with the basal and fish oil diet-fed rats. Food efficiency but not energy efficiency was higher in the 30 % fat diet-fed rats than in the 5 % fat diet-fed rats but were not affected by the intake of lipid quality.
Table 2 Effect of dietary fat quality and quantity on dietary intake, body growth and organ weight*
(Means and standard deviations, n 7–8)

BD5 %, basal diet with 5 % fats; LD5 %, lard-rich diet with 5 % fats; FOD5 %, fish oil-rich diet with 5 % fats; BD30 %, basal diet with 30 % fats; LD30 %, lard-rich diet with 30 % fats; FOD30 %, fish oil-rich diet with 30 % fats.
* Animals were allowed for 1 week adaptation and then received ad libitum one of the six experimental diets for 12 weeks.
† Statistical analyses were based on two-way ANOVA (quantity and quality of lipids) followed by a Fisher's test. Statistical significance was set at P < 0·05. Dietary intake decreased, whereas energy intake, food efficiency and liver weights increased significantly in 30 % fat diet-fed rats. Final body weight, growth gain and adipose tissue increased non-significantly in 30 % fat diet-fed rats. Adipose tissue, dietary intake and energy intake increased significantly in LD compared with BD and FOD.
Liver lipid and liver mitochondrial lipid contents and phospholipid composition
The 30 % fat diet intake led to a significant increase in NEFA, TAG and cholesterol levels and in the cholesterol:PL ratio (Table 3). We have also observed that cholesterol increased significantly with the intake of fish oil-rich diets. With regard to the contents of the liver mitochondrial lipids, mitochondrial NEFA and TAG levels increased, whereas PL levels decreased in the 30 % fat diet-fed rats compared with the 5 % fat diet-fed rats (Table 3).
Table 3 Effect of dietary fat quality and quantity on liver lipid and liver mitochondrial lipid contents*
(Means and standard deviations, n 7–8)

BD5 %, basal diet with 5 % fats; LD5 %, lard-rich diet with 5 % fats; FOD5 %, fish oil-rich diet with 5 % fats; BD30 %, basal diet with 30 % fats; LD30 %, lard-rich diet with 30 % fats; FOD30 %, fish oil-rich diet with 30 % fats; PL, phospholipids.
* Animals were allowed for 1 week adaptation and then received ad libitum one of the six experimental diets for 12 weeks.
† Statistical analyses were based on two-way ANOVA (quantity and quality of lipids) followed by a Fisher's test. Statistical significance was set at P < 0·05. Liver levels of FFA, TAG and cholesterol and mitochondrial levels of NEFA, TAG increased, whereas mitochondrial levels of PL decreased significantly with 30 % fat diets compared with 5 % fat diets. Only liver cholesterol levels increased significantly with FOD compared with BD or LD.
Fatty acid composition of the phospholipids of the liver mitochondrial membrane
As shown in Table 4, the 30 % lipid intake profoundly modified the FA composition of the PL of the mitochondrial membrane. Globally, this has led to an increase in the SFA and PUFA proportions and in the unsaturation index (UI), and a decrease in proportions of MUFA and trans-FA. Moreover, the proportion of total n-6 FA increased significantly, whereas the proportion of total n-3 FA remained unchanged. Compared with the 5 % lipid diet, the 30 % lipid intake clearly increased the proportion of some FA (C18, C20 : 4n-6, C22 : 6n-3 = DHA) and decreased many other FA (C14, C16, C16 : 1, C18 : 1, C18 : 3n-6, C20 : 2n-6, C20 : 3n-6, C20 : 5n-3 = EPA), whereas the proportion of the other FA remained similar or fluctuated slightly.
Table 4 Effect of dietary fat quality and quantity on liver mitochondrial phospholipid (PL) fatty acid (FA) composition*
(Means and standard deviations, n 7–8)

BD5 %, basal diet with 5 % fats; LD5 %, lard-rich diet with 5 % fats; FOD5 %, fish oil-rich diet with 5 % fats; BD30 %, basal diet with 30 % fats; LD30 %, lard-rich diet with 30 % fats; FOD30 %, fish oil-rich diet with 30 % fats; UI, unsaturation index.
* Animals were allowed for 1 week adaptation and then received ad libitum one of the six experimental diets for 12 weeks.
† Statistical analyses were based on two-way ANOVA (quantity and quality of lipids) followed by a Fisher's test. Statistical significance was set at P < 0·05. PL, SFA, PUFA, total n-6 FA and unsaturation index increased, while MUFA and PL trans FA decreased significantly with 30 % fat diets compared with the 5 % fat diets. Moreover, total n-6 FA decreased, whereas total n-3 FA and PL unsaturation index increased significantly with FOD compared with BD and LD, and PL trans-FA increased significantly with LD compared with BD and FOD. Many alterations in individual FA are also observed (see Results section).
‡ UI = (%monoenoic × 1)+(%dienoic × 2)+(%trienoic × 3)+(%tetraenoic × 4)+(%pentaenoic × 5)+(%hexaenoic × 6).
§ trans-FA = 9t 18 : 1, 11t 18 : 1, 9t,12t 18 : 2, 14t 20 : 4, 8t 20 : 4, 5t 20 : 4(Reference Romestaing, Piquet and Bedu46).
With regard to the effect of quality of the lipid on mitochondrial PL and FA composition, we observed only minor modifications with the lard-rich diet compared with the BD (Table 4). This includes an increase in C20 : 2n-6 and a decrease in C18 : 2 and C18 : 3n-3. However, we have observed major modifications with the fish oil-rich diet compared with the BD. This includes an increase in C16 : 0, C17 : 0, C18 : 2n-9, n-12 and a decrease in C18 : 0, C18 : 3n-6, C20 : 2n-6, C20 : 4n-6. These latter modifications reflect, in part, the dietary FA composition of the lard-rich diet and the fish oil-rich diet.
Mitochondrial membrane fluidity
Feeding the 30 % fat diets led to a moderate but significant increase in mitochondrial membrane fluidity, measured by both labels (Table 5). This indicates that the fluidity increase occurs in both the hydrophobic core and the region near the membrane surface. However, mitochondrial membrane fluidity was not affected by the lipid quality of the diet.
Table 5 Effect of dietary fat quality and quantity on mitochondrial membrane fluidity (arbitrary units)*
(Means and standard deviations, n 7–8)

BD5 %, basal diet with 5 % fats; LD5 %, lard-rich diet with 5 % fats; FOD5 %, fish oil-rich diet with 5 % fats; BD30 %, basal diet with 30 % fats; LD30 %, lard-rich diet with 30 % fats; FOD30 %, fish oil-rich diet with 30 % fats; 5-NS, 5-nitroxide stearate; 16-NS, 16-nitroxide stearate.
* Animals were allowed for 1 week adaptation and then received ad libitum one of the six experimental diets for 12 weeks.
† Statistical analyses were based on two-way ANOVA (quantity and quality of lipids) followed by a Fisher's test. Statistical significance was set at P < 0·05. Mitochondrial membrane fluidity increased moderately but significantly in the 30 % fat diet-fed rats (P = 0·030 and P = 0·012 with 5-NS and 16-NS spin labels, respectively). Fat quality had no effect on mitochondrial membrane fluidity.
Mitochondrial membrane potential
The present results show that the mitochondrial membrane potential in all the six groups responded very well to different treatments; membrane potential increased with substrate addition, decreased with ADP addition and decreased further with CCCP addition. Feeding the 30 % fat diet led to a significant increase in mitochondrial membrane potential compared with the 5 % fat diet feeding, both at the basal level, after mitochondrial energising with glutamate/malate/succinate substrates and after CCCP addition (Table 6). However, mitochondrial membrane potential was not affected by the lipid quality of the diet at any studied treatments.
Table 6 Effect of dietary fat quality and quantity on mitochondrial membrane potential (arbitrary units)*, †
(Means and standard deviations, n 7–8)
BD5 %, basal diet with 5 % fats; LD5 %, lard-rich diet with 5 % fats; FOD5 %, fish oil-rich diet with 5 % fats; BD30 %, basal diet with 30 % fats; LD30 %, lard-rich diet with 30 % fats; FOD30 %, fish oil-rich diet with 30 % fats; CCCP, carbonyl cyanide m-chlorophenylhydrazone.
* Calculation: (100 x (fluorescence with label alone-fluorescence with mitochondria/fluorescence with label alone)).
† Animals were allowed for 1 week adaptation and then received ad libitum one of the six experimental diets for 12 weeks.
‡ Statistical analyses were based on two-way ANOVA (quantity and quality of lipids) followed by a Fisher's test. Statistical significance was set at P < 0·05. When arbitrary units increase, membrane potential increases and vice versa. Membrane potential increased significantly with 30 % fat diets at basal level, after energising with substrates and after CCCP addition. Fat quality had no effect on mitochondrial membrane potential.
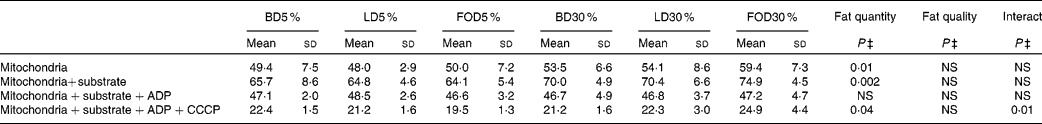
Mitochondrial respiration and oxygen consumption
Mitochondrial respiration (oxygen consumption) was not affected by lipid quantity in the diets at any studied points (mitochondria alone, +substrate, +ADP and +CCCP), although certain trends appeared (Table 7). However, RCR (state 3:state 4) was higher in the 30 % fat diet-fed rats compared with the 5 % fat diet-fed rats (P = 0·048). Moreover, both mitochondrial respiration and RCR were not affected by the quality of the diet lipid at any of the studied points.
Table 7 Effect of dietary lipid quality and quantity on mitochondrial respiration parameters (nmol O2/min per mg protein)*
(Means and standard deviations, n 7–8)

BD5 %, basal diet with 5 % fats; LD5 %, lard-rich diet with 5 % fats; FOD5 %, fish oil-rich diet with 5 % fats; BD30 %, basal diet with 30 % fats; LD30 %, lard-rich diet with 30 % fats; FOD30 %, fish oil-rich diet with 30 % fats; M, malate; G, glutamate; S, succinate; CCCP, carbonyl cyanide m-chlorophenylhydrazone; RCR, respiratory control ratio.
* Animals were allowed for 1 week adaptation and then received ad libitum one of the six experimental diets for 12 weeks.
† Statistical analyses were based on two-way ANOVA (quantity and quality of lipids) followed by a Fisher's test. Statistical significance was set at P < 0·05. Only respiratory control ratio increased moderately but significantly in the 30 % fat diet-fed rats (P = 0·048).
Mitochondrial respiratory complex activities
The quantity of the lipids in the diet largely modified the mitochondrial respiratory chain complex activities (Table 8). Indeed, liver mitochondrial complex II+III and complex IV activities decreased, and complex V activity increased (+20 %) in the 30 % fat diet-fed rats compared with the 5 % fat diet-fed rats. Moreover, 30 % lipid intake led to a nearly significant decrease (P = 0·06) in complex IV activity. However, complex I and II activities remained unchanged in the six experimental groups. The quality of lipids in the diets also influenced the mitochondrial complex activities. While the complex I, complex II and complex V activities remained unchanged, the complex II+III activity decreased significantly and the decrease in the complex IV activity was nearly significant (P = 0·07) in the fish oil diet-fed rats compared with the basal and lard diet-fed rats.
Table 8 Effect of dietary lipid quality and quantity on respiratory chain complex activities (mIU/mg mitochondrial protein)*
(Means and standard deviations, n 7–8)

BD5 %, basal diet with 5 % fats; LD5 %, lard-rich diet with 5 % fats; FOD5 %, fish oil-rich diet with 5 % fats; BD30 %, basal diet with 30 % fats; LD30 %, lard-rich diet with 30 % fats; FOD30 %, fish oil-rich diet with 30 % fats.
* Animals were allowed for 1 week adaptation and then received ad libitum one of the six experimental diets for 12 weeks.
† Statistical analyses were based on two-way ANOVA (quantity and quality of lipids) followed by a Fisher's test. Statistical significance was set at P < 0·05. Complex II+III and complex V activities decreased significantly and complex IV increased non-significantly with 30 % fat diets. Complex II+III activities decreased significantly with FOD compared with BD and LD.
Mitochondrial β-oxidation activities
Mitochondrial FA β-oxidation is essential for energy production, in particular, during periods of fasting and other metabolic stress conditions. In the present study, both mitochondrial β-HAD activity and β-HAD:citrate synthase ratio decreased in the 30 % fat diet-fed rats compared with the 5 % fat diet-fed rats (Table 9). The quality of lipids in the diets also influenced the mitochondrial β-oxidation, particularly in the 30 % BD-fed rats, where β-HAD activity was decreased in the basal and fish oil diet-fed rats (23 %) compared with the lard diet-fed rats.
Table 9 Effect of dietary lipid quality and quantity on rat liver mitochondrial β-oxidation activity (IU/mg protein)*
(Means and standard deviations, n 7–8)

BD5 %, basal diet with 5 % fats; LD5 %, lard-rich diet with 5 % fats; FOD5 %, fish oil-rich diet with 5 % fats; BD30 %, basal diet with 30 % fats; LD30 %, lard-rich diet with 30 % fats; FOD30 %, fish oil-rich diet with 30 % fats; β-HAD, β-hydroxacyl-CoA dehydrogenase.
* Animals were allowed for 1 week adaptation and then received ad libitum one of the six experimental diets for 12 weeks.
† Statistical analyses were based on two-way ANOVA (quantity and quality of lipids) followed by a Fisher's test. Statistical significance was set at P < 0·05. Both β-HAD activity and β-HAD:citrate synthase ratio decreased significantly in the 30 % fat diet-fed rats (P < 0·0001) compared with the 5 % fat diet-fed rats. Fat quality had also a significant effect on β-HAD activity (P = 0·0007). Indeed, β-HAD activity decreased in the basal diet-fed rats (P = 0·0153) and in the fish oil diet-fed rats (P = 0·0081) compared with the lard diet-fed rats, and this was particularly marked in the 30 % fat diet-fed rats (P = 0·0028 and P = 0·0022, respectively) when separately statistically analysed.
Discussion
A critical complication of the obesity epidemic experienced by children and adults in Westernised societies is non-alcoholic fatty liver disease. The liver is a very sensitive organ for the accumulation and metabolism of dietary lipids, and the mitochondria are energy-sensor organelles involved in many cellular functions and survival, and thus in liver pathogenesis. In the present study, we have investigated the impact of both quantity and quality of lipids on several mitochondrial functions in the rat liver. The scientific relevance of the present study lies in the fact that we have studied nutritional lipid patterns rather than individual FA or individual vegetable oils. These nutritional lipid patterns are relevant to usual fat intake (lard-rich diet), to an ‘equilibrated’ recommended fat diet (BD) and to a healthy diet rich in n-3 FA (fish oil-rich diet). This experimental design was completed with three other groups receiving the same lipid patterns but at a high level of lipid in the diet (300 v. 50 g/kg diet).
Effects of lipid quantity
Liver weight and liver lipid contents increased significantly with the 30 % lipid diets compared with the 5 % lipid diets. Moreover, liver mitochondrial NEFA and TAG levels increased and PL contents decreased with the 30 % fat diets compared with the 5 % fat diets, whereas mitochondrial total cholesterol contents remained unchanged among the six experimental groups. These results indicate that the model used in the present study led to a substantial lipid accumulation in the liver, which may affect the mitochondrial functions of the liver. Moreover, the mitochondrial PL composition was much affected by the different diets. Therefore, SFA, PUFA and UI increased, whereas MUFA and trans-FA decreased with the 30 % lipid diets. These large modifications in PL composition affected different membrane characteristics and mitochondrial functions. Undoubtedly, the observed increase in membrane fluidity and potential with the 30 % lipid diets is due to the modifications in PL composition of the mitochondrial membrane, in particular, an increase in the UI and a decrease in the trans-FA levels in the mitochondrial membrane, which are known to increase membrane fluidity(Reference Roach, Feller and Ward39). The present study is the first nutritional intervention, in which both membrane fluidity and potential were simultaneously measured, ascertaining that the 30 % fat diet provoked an increase in both parameters.
ATP production during mitochondrial respiration is one of the most important functions of the mitochondria. The present results showed that mitochondrial respiration was not affected by dietary lipid quantity. However, RCR (state 3:state 4) increased in the mitochondria from the 30 % fat diet-fed rats compared with those from the 5 % fat diet-fed rats, which indicates much more coupled and efficient phosphorylation. Such results are compatible with the high membrane potential observed in the present study.
We have also determined the enzymatic activities of all the mitochondrial respiratory chain complexes. It is possible that the high availability of substrates to the mitochondria in the 30 % fat diet-fed rats, because the high lipid flux into the cell is responsible for the decrease in the complex II+III and IV activities, whereas the increase in the membrane fluidity and potential may be responsible for the increase in complex V activity(Reference Mujkosova, Ferko and Humenik40, Reference Ferko, Habodaszova and Waczulikova41). Mitochondrial β-oxidation plays a central role in lipid oxidation, in particular, in a high fat supply condition. The present results showed that the mitochondrial β-HAD activity decreased with the 30 % fat diets compared with the 5 % fat diets, particularly in the basal and fish oil diets. This decrease in β-HAD activity may indicate a possible mitochondrial adaptation to high fat supply for oxidation.
To resume, the high lipid supply increases the FA turnover in the PL, which favours the trans-FA wash-out and their replacement by cis-FA residues in the mitochondrial membrane, leading to increased membrane fluidity. Moreover, the low proportion in the trans-FA in the mitochondrial membrane PL favour the increase in membrane potential resulting from lower proton leakage across this membrane as reported by Raffaella et al. (Reference Raffaella, Francesca and Italia42). The intake of the 30 % fat diets also led to a higher supply with energy substrates and may be responsible for the decrease in the complex II+III and IV activities. However, the increase in the complex V activity may be attributed to the increase in both the mitochondrial membrane fluidity and potential. In line with this is the increase in RCR in the 30 % fat diets, which may be attributed to the observed decrease in complex II+III and IV and an increase in complex V. Finally, the observed decrease in β-HAD activity with the 30 % fat diets may be due to the high supply with FA, except with the lard diet, where the β-oxidation remained high to allow a high rate of oxidation of the saturated ‘toxic’ FA.
Effects of lipid quality
The present study has shown that dietary lipid quality had fewer effects on the mitochondrial membrane characteristics and mitochondrial functions than dietary lipid quantity. We have observed an increase in the UI with the fish oil diet compared with the basal and lard diets, and an increase in the total trans-FA proportion with the lard diets compared with the basal and fish oil diets. In the present study, both mitochondrial membrane fluidity and potential remained unchanged with the three different lipid diets. Indeed, we have expected lower fluidity in the lard diet-fed rats than in the two other groups because of the high level of SFA in the lard diet(Reference Schmitz and Ecker43). The lack of such an effect may be due to a large adaptation capacity of the membrane lipid composition following different dietary lipid patterns. Moreover, Hulbert et al. (Reference Hulbert44) have indicated that the saturation percentage of the liver membrane lipids was relatively constant with large and different content of SFA in different diets.
We have also measured mitochondrial respiration, and the present results showed that both mitochondrial respiration and RCR were not affected by the lipid quality of the diet at any studied point (after mitochondrial energising with substrates and ADP). In line with these results, Oliveira et al. (Reference Oliveira, Coelho and Barbeiro18) reported that a 4-week high fat intake (+20 % fish oil in the diet) did not modify the mitochondrial respiration in the livers of mice. However, Stillwell et al. (Reference Stillwell, Jenski and Crump45) reported that in vivo and in vitro mitochondrial DHA (n-3) incorporation decreased RCR. With regard to the mitochondrial respiratory chain complexes, the present results showed that the dietary intake of different lipid qualities induced only slight alterations in the enzymatic activity of these complexes: only mitochondrial complex II+III and IV activities decreased with fish oil diets compared with the basal and lard diets. Respiratory chain complex activities did not differ between lard diet-fed rats and BD-fed rats. Moreover, complex I, II and V activities remained unchanged in the different experimental groups. It is very difficult to compare these results with the literature data because the latter are often contradictory. Robbllee & Clandinin(Reference Robblee and Clandinin15) have shown that 2-week high saturated fat feeding (beef tallow or soyabean) increased heart mitochondrial ATPase activity in rats, but they did not measure the other respiratory complex activities. We have also observed that the mitochondrial β-HAD activity, a marker of mitochondrial β-oxidation, increased with the lard diets compared with the basal and fish oil diets in both 5 % fat ( − 10 %) and 30 % fat ( − 23 %) conditions. This may indicate that mitochondrial β-oxidation was increased as an adaptation for high supply with ‘toxic’ SFA that are targeted to the mitochondria to be oxidised. In line with these results, Romestaing et al. (Reference Romestaing, Piquet and Bedu46) reported that 16-week high-fat diet intake (coconut fat rich in SFA) resulted in an increase in β-HAD activity in rat liver mitochondria.
In conclusion, the present study shows that long-term administration of 30 % fat diets led to many alterations in mitochondrial membrane characteristics and alterations in mitochondrial functions. These include an increase in membrane fluidity, membrane potential, RCR and complex V activity. The long-term administration of a lard diet led to an increase in β-oxidation compared with the basal and fish oil 30 % fat diets. Moreover, the long-term administration of a fish oil diet led to a decrease in complex III and IV activities. These results are the consequence of a profound modification in the membrane lipid composition in the 30 % fat diet-fed rats. Such lipid modification could explain the impact of membrane fluidity on many physiological functions and activity of mitochondria. The present study extends the concept that dietary fat affects mitochondrial membrane structure and associated functions by demonstrating alterations in many mitochondrial functions.
Acknowledgements
The authors acknowledge the assistance of Dr Alain Grynberg and Dr Délphine Rousseau (INRA, Paris) whose advice was important for diet conception and preparation. The authors also thank Béatrice Bonafos for the use of the animalerie facilities. The support of COST Action CM0603 ‘Free Radicals in Chemical Biology’ for an STSM grant to Mlle Manar Aoun is gratefully acknowledged. M. A., C. F.-C., G. F. and B. C. conducted the study; D. C. measured the membrane fluidity; C. F. and C. C. supervised the PL FA analysis; C. W.-C., J. P. C., M.-A. C. and C. C. designed and supervised the study. All authors read and approved the final manuscript. There is no conflict of interest associated with the present study.


