


n-3 PUFA are crucial for health, normal development and organ functioning in vertebrates. Their effects as regulators of lipid and glucose metabolism are well documented. The action of n-3 PUFA on the transcription of key genes of lipid metabolism has been the most extensively studied aspect, particularly via their ligands, i.e. PPAR( Reference Mandard, Muller and Kersten 1 ). In contrast, little has been established regarding the mechanisms controlling protein metabolism in response to the provision of n-3 PUFA. Recent studies have indicated that the consumption of long-chain (LC) PUFA promotes protein anabolism( Reference Bergeron, Julien and Davis 2 – Reference Smith, Atherton and Reeds 5 ). In this case, n-3 PUFA may act by increasing insulin sensitivity rather than by regulating gene transcription. It should be noted that these studies had been carried out using LC-PUFA found in abundance in fish oils (e.g. EPA and DHA) and that the effects of the plant precursor α-linolenic acid (ALA, 18 : 3n-3) have never been explored.
Insulin is a major regulator of glucose metabolism and is also an anabolic hormone known to regulate protein metabolism (for a review, see Tesseraud et al. ( Reference Tesseraud, Métayer and Duchêne 6 )). Insulin acts via the activation of its receptor, the role of which is to recognise the hormone and to initiate a cascade of intracellular events. The insulin signal is mediated by the activation of intracellular kinases such as protein kinase B (also called AKT), affecting the phosphorylation (p) of some major effectors involved in the regulation of protein synthesis (e.g. p70S6 kinase, also called 70 kDa ribosomal protein S6 kinase (S6K1)). Cytoplasmic serine/threonine S6K1 is stimulated after a single insulin injection in chickens, as in other species, and phosphorylates several proteins, including the ribosomal protein S6 (S6), affecting the initiation stage of mRNA translation( Reference Bigot, Taouis and Tesseraud 7 – Reference Tesseraud, Abbas and Duchene 10 ). Muscle mass depends on the dynamic balance between the processes of protein synthesis and degradation. Studies on gene expression profiling have highlighted genes specifically induced during atrophy (atrophy-related genes, also called atrogenes) and involved in proteolysis, i.e. muscle atrophy F box (MAFbx or atrogin-1) and muscle ring finger-1 (MuRF1)( Reference Bodine, Latres and Baumhueter 11 , Reference Gomes, Lecker and Jagoe 12 ). These two important genes control the polyubiquitination and thus the degradation of certain proteins, including myofibrillar proteins( Reference Clarke, Drujan and Willis 13 – Reference Attaix and Baracos 15 ). They are regulated by hormones such as insulin via mechanisms involving the AKT signalling pathway( Reference Stitt, Drujan and Clarke 16 – Reference Tesseraud, Métayer-Coustard and Boussaid 18 ). The aim of the present study was, therefore, to investigate the role of n-3 PUFA (ALA or LC-PUFA) in growth and protein metabolism in chickens, by focusing on their potential function as co-regulators of the insulin signalling cascade.
Materials and methods
Broiler chickens and feed distribution
A total of 960 male broiler chicks (Gallus gallus; Ross 708 strain) were obtained at 1 d of age from a hatchery (Grolier), wing-banded and randomly distributed into forty-eight pens (1·6 × 1·75 m, twenty chicks per pen) in a conventional environmentally controlled poultry shed at the Poultry Research Centre in Nouzilly, France. The floor was covered with wood shavings. Lighting was reduced from 23L:1D to 18L:6D daily after the age of 3 d. Environmental temperature was progressively reduced from 31 to 22°C. Feed was provided in circular feeders. Chickens had ad libitum access to food and water.
To investigate the effects of LC-PUFA and their precursor, i.e. ALA, six diets were used (Table 1). The diets were isoproteic (22 % crude protein) and isoenergetic (12·54 MJ ME/kg) and contained the same lipid percentage (6 %) provided by different oils. The control diet contained oleic sunflower oil rich in 18 : 1n-9: Oleic diet, 6 % oleic sunflower oil. Among the experimental test diets used, three were differentially enriched with ALA from rapeseed oil and linseed oil: ALA(–) diet, 6 % rapeseed oil; ALA diet, 4 % rapeseed oil and 2 % linseed oil; ALA(+) diet, 2 % rapeseed oil and 4 % linseed oil. The remaining two diets were enriched with LC n-3 PUFA from fish oil: LC-PUFA diet, 4 % oleic sunflower oil and 2 % fish oil, and LC-PUFA(+) diet, 6 % fish oil.
Table 1 Composition (%) and characteristics of the experimental diets*
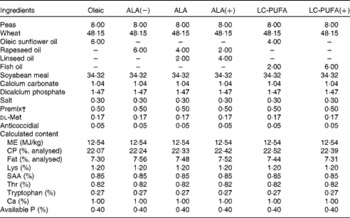
ALA, α-linolenic acid; LC, long-chain; CP, crude protein; SAA, sulphur amino acids
* Oleic, diet containing 6 % oleic sunflower oil rich in monounsaturated 18 : 1; ALA(–), ALA and ALA(+), diets enriched with ALA from rapeseed and/or linseed oils; LC-PUFA and LC-PUFA(+), diets enriched with LC n-3 PUFA from fish oil.
† Composition as described previously( Reference Tesseraud, Bouvarel and Collin 28 ).
Chickens were individually weighed at 1, 21 and 23 d of age. Feed intake was determined per pen, and feed conversion ratio was calculated for the whole experimental period. At 21 d of age, after 7 h of feed withdrawal, 120 birds (n 20 per diet) chosen at random were weighed and killed, and the carcasses were processed as described previously( Reference Marche 19 ). The legs (thighs+drumsticks) and livers were stored at − 20°C for chemical analysis. At 23 d of age, 16 h food-deprived chickens (n 6–7) were injected intravenously with either insulin (1 U/kg (6·9 mmol/kg); Umuline Rapide, Lilly France) or saline solution (0·9 % NaCl) to investigate the potential diet-related modulation of the insulin cascade. Chickens were killed 15 min after treatment by decapitation following blood sampling. The right pectoralis major and sartorius (i.e. a leg muscle) muscles and the livers were removed, weighed, sampled, quickly frozen in liquid N2 and stored at − 80°C. Plasma was stored at − 20°C until further analysis. All the experiments were carried out with due regard to legislation governing the ethical treatment of animals, and investigators were certified by the French government to carry out animal experiments.
Plasma parameters and tissue characteristics
Plasma α-amino-non-protein N concentrations (providing an estimate of total free amino acids) were measured after extraction with 10 % (v/v) sulphosalicylic acid, using 2 % ninhydrin reagent (Sigma Chemicals) and l-serine as the standard( Reference Dupont, Tesseraud and Derouet 20 ). Plasma TAG and uric acid concentrations were quantified by colorimetric enzymatic methods using kits obtained from bioMérieux according to the methods of Fossati & Prencipe( Reference Fossati and Prencipe 21 ) and Artiss & Entwistle( Reference Artiss and Entwistle 22 ). Plasma glucose concentration was quantified by the colorimetric enzymatic methods of Trinder( Reference Trinder 23 ) using a kit obtained from Sobioda.
Glycolytic potential represents an estimate of tissue glycogen concentration during killing( Reference Monin and Sellier 24 ). It takes into account the main intermediates of glycogen degradation in live and post-mortem tissue and therefore represents an estimate of the in vivo glycogen concentration. Glycogen, glucose-6-phosphate, free glucose and lactate concentrations were measured in liver samples by enzymatic procedures according to the method of Dalrymple & Hamm( Reference Dalrymple and Hamm 25 ). Glycolytic potential was calculated according to the following formula: glycolytic potential = 2(glycogen+glucose+glucose-6-phosphate)+lactate, and it is expressed as μmol of lactate equivalent per g of tissue.
Chemical analysis
Total lipids were extracted quantitatively from diets and from samples of minced livers and leg muscles comprising intramuscular fat (amounts of diet and tissue samples adjusted on the basis of expected lipid contents for accurate Folch lipid extraction) by homogenisation in chloroform–methanol (2:1, v/v), and then collected gravimetrically( Reference Folch, Lees and Sloane Stanley 26 ). Fatty acid (FA) composition was determined after transmethylation of lipids( Reference Morrisson and Smith 27 ) by GC (Perkin Elmer Autosystem). Injector and detector (flame ionisation detector) temperatures were set at 250°C; the carrier gas was N with a head column pressure of 16·5 psi. We used a capillary column (BPX70, SGE). Methyl esters were identified and quantified by comparison with standards (Sigma).
RNA isolation and RT-PCR
Total RNA was extracted using RNA Now (Biogentec) from 100 mg of tissue samples according to the manufacturer's recommendations. After RNase-free DNase treatment, RNA was reverse-transcribed using Super Script II RNase H Reverse transcriptase (Invitrogen) in the presence of random primers (Promega). Quantitative PCR were carried out in duplicate using the LightCycler® 480 II apparatus (Roche). The primers chosen to study the expression of MuRF1, atrogin-1, β-actin, hepatic carnitine palmitoyltransferase 1 (hCPT1), FA synthase (FAS), sterol regulatory element-binding protein 1 (SREBP1), PPARα, PPARδ and PPARγ had been used previously in our laboratory( Reference Dupont, Tesseraud and Derouet 20 , Reference Tesseraud, Bouvarel and Collin 28 , Reference Joubert, Métayer Coustard and Swennen 29 ). The sequences of primers used for studying the expression of carbohydrate-responsive element-binding protein (ChREBP) (MLXIPL), FA translocase (Cd36), diacylglycerol O-acyltransferase 2 (DGAT2), FA desaturase 1 or delta-5 desaturase (FADS1), glyceraldehyde 3-phosphate dehydrogenase (GAPDH), microsomal TAG transfer protein (MTTP) and stearoyl-CoA desaturase 1 or delta-9 desaturase (SCD1), specifically designed or reproduced from the literature( Reference Hérault, Saez and Robert 30 ), are given in Table S1 (available online). The cycling conditions consisted of a denaturation step (95°C for 10 min) and forty-five cycles of amplification, including both denaturation for 15 s at 95°C and annealing–extension for 30 s (1 min for MTTP) at 60°C. At the end of the PCR, dissociation was carried out by slowly heating the samples from 60 to 95°C and continuous recording of the decrease in SYBR Green fluorescence resulting from the dissociation of double-stranded DNA. Gene expression levels were estimated on the basis of PCR efficiency and threshold cycle (C t) deviation of an unknown sample v. a reference sample, as described previously( Reference Chabrolle, Tosca and Crochet 31 ). The genes β-actin (muscle) and GAPDH (liver) were chosen as references.
Western blotting
To analyse the insulin signalling cascade involved in the regulation of protein metabolism, muscle and liver lysates were prepared as described previously( Reference Duchene, Métayer and Audouin 9 ). Muscle lysates (60 μg of protein) were subjected to SDS–PAGE and Western blotting using the appropriate antibodies: p-S6K1 (T389), p-S6K1 (T421/S424), p-AKT (S473), p-AKT (T308) and p-S6 (S235/S236) (Cell Signaling Technology); S6K1 (Santa Cruz Biotechnology); vinculin (Sigma Chemical Company). These commercial antibodies directed against mammalian proteins have been previously shown to cross-react with chicken homologue protein to a good extent( Reference Duchene, Métayer and Audouin 9 ). After washing, membranes were incubated with Alexa Fluor secondary antibodies (Molecular Probes, Interchim). Bands were visualised by IR fluorescence using the Odyssey® Imaging System (LI-COR, Inc. Biotechnology) and quantified using the Odyssey Infrared Imaging System software (application software, version 1.2).
70 kDa ribosomal protein S6 kinase assay
The activity of S6K1 enzyme was measured by quantifying the incorporation of [33P]-ATP in eleven amino acids of the S6 sequence (229AKRRRLSSLRA239) according to the manufacturer's instructions (Upstate Cell Signaling), as described previously( Reference Bigot, Taouis and Tesseraud 7 ).
Statistical analysis
Values are presented as means with their standard errors. Data were processed using the StatView Software program, version 5 (SAS Institute). Data were subjected to ANOVA by considering diet and treatment (insulin v. control) as the main effects and their interactions in the model. The means were compared by Fisher's least significant difference test in the case of a significant effect. For gene expression, no effect of treatment or an interaction between diet and treatment was observed. For the sake of clarity, data were, therefore, pooled across the treatments (i.e. control and insulin groups were pooled) and analysed again by considering diet as the main effect. P(0·05 was considered statistically significant.
Results
Animal characteristics
There was a significant effect of diet on body weight (P< 0·001; Table 2), but not on the feed conversion ratio. Chickens fed the ALA, ALA(+) and LC-PUFA diets weighed significantly more than those fed the Oleic diet or the LC-PUFA(+) diet (P< 0·05). The weights of chickens fed the ALA(–) diet were not significantly different from those of chickens fed the Oleic diet, but were lower than those of chickens fed the ALA(+) diet containing rapeseed oil but enriched with linseed oil. With regard to body composition (Table 2), the abdominal fat percentage, an accurate indicator of carcass fatness, and leg yield were not affected by the experimental diets. Conversely, there was a clear effect of diet on the relative weights of the livers (P< 0·001), with the heaviest being found in the LC-PUFA(+) group. Based on these findings, all the other measurements were carried out for three of the six dietary treatments under study: the Oleic diet as the control diet; the ALA diet with intermediate enrichment with ALA; the LC-PUFA diet with moderate PUFA supply (FA composition given in Table 3). As expected, the Oleic, ALA and LC-PUFA diets were the richest in oleic acid, ALA and n-3 LC-PUFA, respectively. The FA composition of the leg muscles and liver is given in Table 4. The levels of saturated FA, particularly 18 : 0, and those of PUFA, particularly n-3 LC-PUFA, were much higher in the liver than in the leg muscles. The reverse was observed for the levels of MUFA. The FA composition of the liver and leg muscles tended to reflect that of the diets. Indeed, 18 : 1 content was 1·2- to 1·5-fold higher in the Oleic group than in the ALA and LC-PUFA groups. ALA content was dramatically increased by the provision of the ALA diet. Similarly, the LC-PUFA diet was the most effective in increasing n-3 LC-PUFA content in the leg muscles and even more so in the liver. However, the percentages of all n-3 LC-PUFA were also higher in the ALA group than in the Oleic group, as a result of the bioconversion of ALA into its LC derivatives. It should also be noted that chicken livers exhibited percentages of n-3 LC-PUFA that were higher than those found in the diets, which did not exceed 6·5 %. With regard to n-6 PUFA, linoleic acid content (18 : 2n-6) reflected that of the diets, with levels being highest in both the livers and leg muscles of the ALA group. The proportion of arachidonic acid (20 : 4n-6) was low in the leg muscles and did not vary with the diet. This percentage in the liver decreased as the percentage of n-3 LC-PUFA increased, being lowest in the LC-PUFA group. Lipid content was significantly lower in the livers of chickens fed the diets enriched with n-3 PUFA (P< 0·01); a similar trend, albeit not significant, was observed in the leg muscles.
Table 2 Growth performance and body composition of chickens fed diets containing different sources of lipids

ALA, α-linolenic acid; LC, long-chain; BW, body weight; FCR, feed conversion ratio.
a,b,cMean values within a row with unlike superscript letters were significantly different (P< 0·05).
* Oleic, diet containing 6 % oleic sunflower oil rich in monounsaturated 18 : 1; ALA(–), ALA and ALA(+), diets enriched with ALA from rapeseed and/or linseed oils; LC-PUFA and LC-PUFA(+), diets enriched with LC n-3 PUFA from fish oil.
† Calculated from feed intake determined per pen (n 8).
‡ Leg, thighs+drumsticks.
Table 3 Fatty acid composition of the Oleic, α-linolenic acid (ALA) and long-chain (LC)-PUFA experimental diets expressed as a percentage of total fatty acids
DPA, docosapentaenoic acid.
* Oleic, diet containing oleic sunflower oil rich in monounsaturated 18 : 1; ALA, diet enriched with ALA from rapeseed and linseed oils; LC-PUFA, diet enriched with LC n-3 PUFA from fish oil.
† n-6, total n-6 FA; n-3, total n-3 FA; n-6:n-3, ratio of total n-6 FA:total n-3 FA; n-3 LC, sum of 20 : 5n-3, 22 : 5n-3 and 22 : 6n-3.
Table 4 Fatty acid composition (as a percentage of total fatty acids) and lipid content (%) of the leg muscles and livers of 21-d-old chickens fed the Oleic, α-linolenic acid (ALA) and long-chain (LC)-PUFA experimental diets (Mean values with their standard errors, n 12)
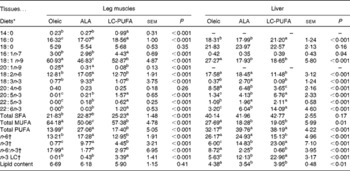
a,b,cMean values with unlike superscript letters were significantly different (P< 0·05).
* Oleic, diet containing oleic sunflower oil rich in monounsaturated 18 : 1; ALA, diet enriched with ALA from rapeseed and linseed oils; LC-PUFA, diet enriched with LC n-3 PUFA from fish oil.
† n-6, total n-6 FA; n-3, total n-3 FA; n-6:n-3, ratio of total n-6 FA:total n-3 FA; n-3 LC, sum of 20 : 5n-3, 22 : 5n-3 and 22 : 6n-3.
Insulin responses were investigated in chickens fed the Oleic, ALA and LC-PUFA diets. No significant effect of insulin treatment that would have affected the study was observed on body weight or tissue weight (well-matched groups; Table 5). Chickens fed the ALA and LC-PUFA diets were heavier than those fed the Oleic diet (i.e. selected chickens were representative of each dietary treatment tested). The effects of insulin treatment were significant for all the three diets with regard to glucose, TAG and uric acid concentrations, but not with regard to free amino acid concentrations. The diets had no effect on glucose, uric acid and amino acid concentrations. The only notable difference was the lower concentration of TAG in the LC-PUFA group compared with the concentration in the Oleic and ALA groups (P< 0·01). The weight of the sartorius muscle was not affected by any diet. The pectoralis major muscle was heaviest in chickens fed the ALA diet than in those fed the other two diets (P< 0·05), whereas liver weights of chickens fed the LC-PUFA diet were significantly higher than those of chickens fed the other two diets (P< 0·001). The glycolytic potential in the liver was not modified by either the treatment or the diet. Similarly, there was no change in liver glycogen or lactate content (data not shown).
Table 5 Body weight (BW), plasma parameters and tissue characteristics of 23-d-old chickens fed the Oleic, α-linolenic acid (ALA) and long-chain (LC)-PUFA experimental diets and injected intravenously with either insulin or saline (Mean values with their standard errors, n 6–7)
D, diet; T, treatment; C, control; I, insulin; FAA, α-NH2-non-protein nitrogen; GP, glycolytic potential.
* Oleic, diet containing oleic sunflower oil rich in monounsaturated 18 : 1; ALA, diet enriched with ALA from rapeseed and linseed oils; LC-PUFA, diet enriched with LC n-3 PUFA from fish oil.
† I v. saline (C).
‡ FAA, an estimate of free amino acids, expressed as mg l-serine equivalent/ml; GP, expressed as μmol of lactate equivalent per g of tissue. They were analysed using two-way ANOVA.
Insulin signalling and gene expression in chicken breast muscle
Since the ALA diet resulted in heavier pectoralis major muscles, we first studied the activity of S6K1 (a kinase controlling protein synthesis and growth) in the breast muscle of chickens given an injection of insulin or saline (Fig. 1(A)). As expected, 15 min of insulin stimulation dramatically increased the activity of the kinase S6K1 in the pectoralis major muscle (P< 0·001). Interestingly, there was an effect of diet, with higher S6K1 activity being found in chickens fed the ALA diet than in those fed the other diets (P< 0·05). Consistent with this was the fact that the phosphorylation levels of the S6 were also significantly higher in chickens fed the ALA diet (shown by Western blots, Fig. 1(B)), confirming that the activation of S6K1 varied according to the diet.
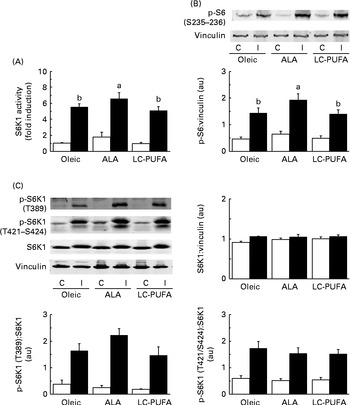
Fig. 1 Effects of insulin injection on 70 kDA ribosomal protein S6 kinase (S6K1) activity and ribosomal protein S6 (S6) and S6K1 phosphorylation (p) levels in the breast muscle of 23-d-old chickens fed the Oleic (diet containing oleic sunflower oil rich in monounsaturated 18 : 1), α-linolenic acid (ALA, diet enriched with ALA from rapeseed and linseed oils) and long-chain PUFA (LC-PUFA, diet enriched with LC n-3 PUFA from fish oil) experimental diets. The activity of (A) S6K1 in chickens food-deprived for 16 h and injected intravenously with either insulin (I, ■) or saline solution (control, C (□)). The activity of the enzyme was measured by quantifying the incorporation of γ-33p-ATP in eleven amino acids of the S6 sequence. Values are means (n 6–7), with their standard errors represented by vertical bars and are expressed as the level of stimulation above that in the control muscle in chickens fed the Oleic diet. They were analysed using two-way ANOVA. There was no diet × treatment interaction. a,bUnlike letters indicate significant differences between diets (P< 0·05). The phosphorylation of (B) S6 and (C) S6K1 in chickens food-deprived for 16 h and injected intravenously with either insulin or saline solution (C). Representative Western blots were obtained using the antibodies indicated. Blots were quantified and the p-S6(S235–236):vinculin, S6K1:vinculin, p-S6K1(T389):S6K1 and p-S6K1(T421/S424):S6K1 ratios were determined. Values are means (n 6–7), with their standard errors represented by vertical bars. They were analysed using two-way ANOVA. There was no diet × treatment interaction, and letters indicate significant differences between the experimental diets at P< 0·05. au, Arbitrary units.
We then analysed the phosphorylation of S6K1 at T389 and T421/S424, both sites believed to be required for the activation of S6K1 (Fig. 1(C)). Insulin increased the phosphorylation of the kinase in the pectoralis major muscle (P< 0·001). There was clearly no effect of diet on the phosphorylation at T421/S424. Although the slightly higher values of the ALA group did not reach statistical significance (P< 0·10), the S6K1 pattern of phosphorylation at T389 was similar to that observed for the activity of S6K1 and the phosphorylation of S6. Relatively similar patterns of phosphorylation were also found for AKT at S473 and T308 upstream in the insulin cascade, but with wide variability in the insulin-treated groups (Fig. 2). We next explored the potential regulation of atrogin-1 and MuRF1 in the pectoralis major muscle. Under the experimental conditions of the present study, the levels of mRNA expression of atrogin-1 and MuRF1 were not modified by either the treatment or the diet (Fig. S1, available online).
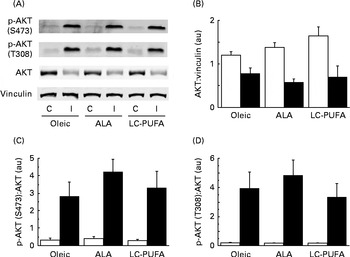
Fig. 2 Effects of insulin injection on protein kinase B (AKT) phosphorylation (p) levels in the breast muscle of 23-d-old chickens fed the Oleic (diet containing oleic sunflower oil rich in monounsaturated 18 : 1), α-linolenic acid (ALA, diet enriched with ALA from rapeseed and linseed oils) and long-chain PUFA (LC-PUFA, diet enriched with LC n-3 PUFA from fish oil) experimental diets. The phosphorylation of AKT in chickens food-deprived for 16 h and injected intravenously with either insulin (I, ■) or saline solution (control, C (□)). Representative (A) Western blots were obtained using the antibodies indicated. Blots were quantified and the (B) AKT:vinculin, (C) p-AKT(S473):AKT and (D) p-AKT(T308):AKT ratios were determined. Values are means (n 6–7), with their standard errors represented by vertical bars. They were analysed using two-way ANOVA. There was no diet × treatment interaction, and no significant differences between the experimental diets at P< 0·05. au, Arbitrary units.
Insulin signalling and gene expression in the liver
To assess whether dietary n-3 PUFA affected the insulin cascade in other tissues, we examined the activation of two key signalling proteins involved in insulin action (i.e. AKT and S6) in the liver. We did not focus on S6K1, since its phosphorylation at T389 and T421/S424 in chicken livers was very low and difficult to detect in spite of using a relatively high amount of protein( Reference Dupont, Tesseraud and Derouet 20 , Reference Duchene, Audouin and Berri 32 ). As in the breast muscle, insulin drastically increased the phosphorylation of AKT and S6 in the liver (P< 0·001) (Fig. 3). There was an effect of diet and an interaction between diet and treatment, irrespective of the effectors considered. Lower insulin-induced phosphorylation levels were found in groups fed the diets enriched with n-3 PUFA (ALA for p-AKT and ALA and LC-PUFA for p-S6) compared with the levels in chickens fed the Oleic diet (P< 0·05). We next investigated whether gene expression could be altered in the liver, with specific focus on genes involved in lipid metabolism. No effect of treatment (insulin v. control) or an interaction between diet and treatment was found, with measurements being carried out only 15 min after insulin injection. Data obtained from insulin-treated and control chickens were thus pooled and analysed together for the effect of diet (Fig. 4). The expression of FADS1 (involved in FA desaturation) and MTTP (involved in TAG transfer) was reduced in both the ALA and LC-PUFA groups compared with that in the Oleic group (P< 0·05). The expression of two lipogenesis-related genes (SREBP1 and SCD1) was also significantly lower in chickens fed the diets enriched with n-3 PUFA (v. the Oleic diet), but the differences were particularly marked for the LC-PUFA group, with the ALA group exhibiting intermediate values (P< 0·05). The mRNA levels of DGAT2 (involved in TAG synthesis), FAS (involved in lipogenesis), Cd36 (involved in LC-FA uptake), and PPARδ and PPARγ (involved in lipoprotein metabolism, lipogenesis and insulin sensitivity) were significantly lower in the LC-PUFA group than in the Oleic group, whereas they did not differ between the ALA and Oleic groups. A similar pattern of expression was found for the ChREBP (involved in lipogenesis), although differences did not reach statistical significance. On the other hand, mRNA abundance for two genes involved in the β-oxidation process tended to be higher (hCPT1) or was significantly higher (PPARα) in the ALA group than in both the Oleic and LC-PUFA groups, in which levels were similar.
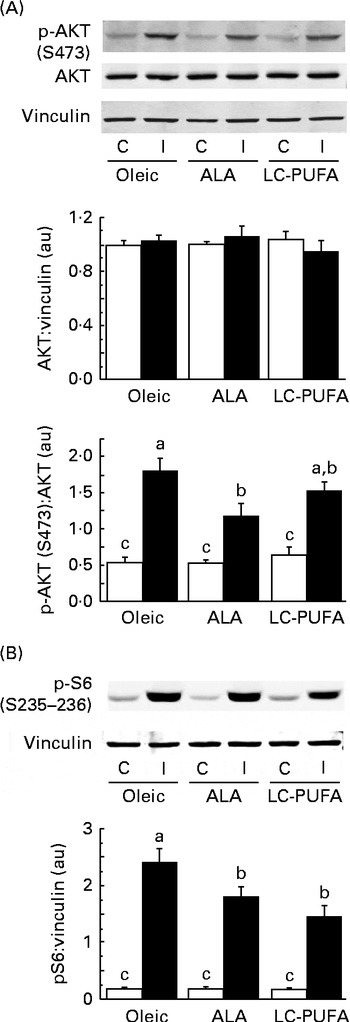
Fig. 3 Effects of insulin injection on protein kinase B (AKT) and ribosomal protein S6 (S6) phosphorylation (p) levels in the livers of 23-d-old chickens fed the Oleic (diet containing oleic sunflower oil rich in monounsaturated 18 : 1), α-linolenic acid (ALA, diet enriched with ALA from rapeseed and linseed oils) and long-chain PUFA (LC-PUFA, diet enriched with LC n-3 PUFA from fish oil) experimental diets. The phosphorylation of (A) AKT and (B) S6 in chickens food-deprived for 16 h and injected intravenously with either insulin (I, ■) or saline solution (control, C (□)). Representative Western blots were obtained using the antibodies indicated. Blots were quantified and the AKT:vinculin, p-AKT(S473):AKT and p-S6(S235–236):vinculin ratios were determined. Values are means (n 6–7), with their standard errors represented by vertical bars. They were analysed using two-way ANOVA. There was a diet × treatment interaction. a,b,cMean values were significantly different between the six groups (P< 0·05). au, Arbitrary units.
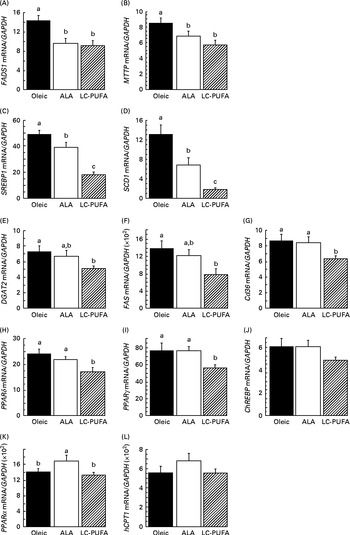
Fig. 4 Gene expression in the livers of 23-d-old chickens fed the Oleic (diet containing oleic sunflower oil rich in monounsaturated 18 : 1), α-linolenic acid (ALA, diet enriched with ALA from rapeseed and linseed oils) and long-chain PUFA (LC-PUFA, diet enriched with LC n-3 PUFA from fish oil) experimental diets. The relative expression of each gene (i.e. corrected for GAPDH mRNA, which did not differ significantly according to the group) was determined by real time RT-PCR. Values are means (n 13–14), with their standard errors represented by vertical bars. They were analysed using one-way ANOVA. a,b,cMean values were significantly different between the groups (P< 0·05). (A) FADS1, fatty acid desaturase 1 or delta-5 desaturase; (B) MTTP, microsomal TAG transfer protein; (C) SREBP1, sterol regulatory element-binding protein 1; (D) SCD1, stearoyl-CoA desaturase 1 or delta-9 desaturase; (E) DGAT2, diacylglycerol O-acyltransferase 2; (F) FAS, fatty acid synthase; (G) Cd36, fatty acid translocase; (H) PPARδ; (I) PPARγ; (J) ChREBP (MLXIPL), carbohydrate-responsive element-binding protein; (K) PPARα; (L) hCPT1, hepatic carnitine palmitoyltransferase 1. (A, B) Oleic ≥ ALA, LC-PUFA (fatty acid desaturation, TAG transfer). (C, D) Oleic>ALA>LC-PUFA (lipogenesis). (E–J) Oleic, ALA ≥ LC-PUFA (lipogenesis, insulin resistance, LC-fatty acid uptake). (K, L) ALA ≥ Oleic, LC-PUFA (β-oxidation).
Discussion
Under the experimental conditions of the present study, the provision of one of the two diets enriched with n-3 PUFA for 3 weeks improved the growth performance of chickens. In addition, both the ALA and LC-PUFA diets led to lower liver lipid content and consistently reduced the hepatic expression of genes involved in FA desaturation, TAG transfer and lipogenesis compared with the Oleic diet. It should be noted that the liver is the main site of lipid synthesis in birds( Reference Leveille, Romsos and Yeh 33 ). More specifically, enriching the diet with the plant precursor ALA led to particular effects as it may promote β-oxidation in the liver (e.g. increased PPARα expression), whereas the diet enriched with LC-PUFA did not lead to any effects. On the other hand, the LC-PUFA diet led to more pronounced changes in body composition and parameters related to lipid metabolism compared with the other two diets: increased liver weight; decreased plasma concentrations of TAG; drastically reduced expression of several genes involved in hepatic lipogenesis. However, the consumption of this diet did not change the percentage of abdominal fat, an indicator of fatness in chickens( Reference Cahaner, Nitsan and Nir 34 ). Interestingly, the diets enriched with ALA enhanced the development of the pectoralis major muscle. Although the issue of protein synthesis v. degradation was not addressed in the present study, such an anabolic response in this muscle (entirely fast-twitch glycolytic fibre type) is probably dependent on muscle type, since it is not found in the sartorius muscle (mixed fibre type). This is in good agreement with the fact that highly fast-twitch glycolytic muscles have been reported to respond the most to nutritional factors in terms of variation in protein turnover compared with slow-twitch oxidative muscles in growing rats and chickens( Reference Baillie and Garlick 35 , Reference Tesseraud, Maaa and Peresson 36 ).
Phenotypic differences according to dietary FA were accompanied by changes in FA composition of the liver and leg muscles. This result is interesting because most studies on the modulation of FA composition in chickens have been carried out during the finishing period in broilers (standard chickens aged 35–42 d) (for a review, see Kouba & Mourot( Reference Kouba and Mourot 37 )). In the present study, experimental diets were given throughout the rearing period (21 d) and they contained approximately 7·4 % total fat (standard value for diets in fast-growing chickens). Thus, early and short dietary manipulation would be effective in modifying FA composition in broilers, as has been reported for pigs by Kouba & Mourot( Reference Kouba and Mourot 37 ) or in a recent study in chickens( Reference Kartikasari, Hughes and Geier 38 ). Despite the relatively short experimental period and low dietary lipid content, the enrichment of diets with ALA and n-3 LC-PUFA was well reflected by the FA enrichment of the liver and muscles with ALA and LC n-3 PUFA. However, some particular features were found for specific FA. For example, there was a non-negligible proportion of EPA in the liver (20 : 5n-3) in the Oleic group, despite the low dietary n-3 FA provision. This might be consistent with the very high expression of FADS1 in chickens fed this diet compared with the expression in those fed the other two diets, with FADS1 being one of the desaturases required for the formation of EPA. The percentages of DHA (22 : 6n-3) were especially high in the liver compared with those provided in the diets, whereas the values remained relatively low in the leg muscles. The low percentage of n-3 LC-PUFA in the leg muscles compared with the percentage in the liver was still not explained, but it could result from a defect in the export of these FA or a lack of their uptake by muscles and/or preferential oxidation. We also confirmed that enriching a diet with n-3 FA decreased the synthesis of 20 : 4n-6, as there is competition for elongases and desaturases involved in LC-PUFA synthesis from 18 : 2n-6 and 18 : 3n-6( Reference Lessire 39 ).
The fact that n-3 PUFA enhance breast muscle development, at least in the case of provision of a diet enriched with the plant precursor ALA, suggests an action on muscle anabolism. The literature concerning the effect of PUFA on protein metabolism mainly refers to catabolic conditions occurring during sepsis, cancer or immobilisation( Reference Khal and Tisdale 40 – Reference You, Park and Song 43 ) and to insulin resistance( Reference Sohal, Baracos and Clandinin 44 ). However, more recent reports have shown that the consumption of n-3 LC-PUFA promotes muscle anabolism in both farm animals( Reference Gingras, White and Chouinard 3 ) and humans( Reference Smith, Atherton and Reeds 4 , Reference Smith, Atherton and Reeds 5 ). One of the mechanisms that have been proposed is associated with the enhanced activation of the insulin cascade, as this hormone controls the protein synthesis/proteolysis balance. Consistent with this is the fact that the ALA-enriched diet appeared to induce higher levels of activation of the insulin-dependent S6K1/S6 pathway in the breast muscle. This is in agreement with the results obtained by Gingras et al. ( Reference Gingras, White and Chouinard 3 ) and Smith et al. ( Reference Smith, Atherton and Reeds 4 , Reference Smith, Atherton and Reeds 5 ) using n-3 LC-PUFA diets. In contrast, we did not find any improvement in insulin sensitivity in muscles with the LC-PUFA diet. Under the experimental conditions of the present study (e.g. single collection 15 min after insulin treatment), the mRNA levels of genes involved in proteolysis (i.e. atrogenes) were not affected by insulin administration or by dietary n-3 enrichment. Whether both components of protein turnover (i.e. protein synthesis and proteolysis) are affected by n-3 PUFA is still unclear. Nevertheless, 15 min were probably too short to induce any insulin-related change in the expression of atrogenes( Reference Frost, Nystrom and Jefferson 45 ). On the other hand, our findings are in contrast with previous evidence that dietary fish oils could modulate the expression of MuRF1 and atrogin-1 in rats( Reference You, Park and Song 43 ). It is important to note that this mechanism may involve the AKT signalling pathway, but in the present study, the provision of n-3 PUFA diets did not lead to a significant activation of AKT. Moreover, the beneficial effect of fish oils has previously been reported in catabolic conditions, i.e. alleviating immobilisation-induced muscle atrophy( Reference You, Park and Song 43 ), and not in anabolic conditions characteristic of muscle growth, as in the present study.
We cannot exclude the possibility that the n-3 PUFA levels provided by the LC-PUFA diet were too low (half of the n-3 PUFA levels provided by the ALA diet leading to a twice lower n-3 FA content in muscles) to exert a significant effect on protein anabolism/catabolism in muscles. Alternatively, a specific effect of ALA on insulin signalling in muscles should be considered. Indeed, in contrast to that observed in the breast muscle, insulin-induced phosphorylation levels of AKT and S6 in the liver were lower in the ALA and/or LC-PUFA groups than in the Oleic group. Such tissue specificity of the effect of an n-3 FA diet has been reported previously, since n-3 LC-PUFA enrichment of a high-fat diet prevented defective insulin receptor signalling in muscles but not in the liver( Reference Taouis, Dagou and Ster 46 ). The basic mechanisms sustaining the tissue-specific effects of n-3 PUFA (ALA and/or LC-PUFA) on insulin signalling remain unclear. One hypothesis is that these differential effects may be due to certain differences in FA composition between the liver and muscles, as reflected in the present study by the tissue-specific FA profile. It has long been established that dietary n-3 PUFA composition influences the composition of stored and structural lipids, including membrane lipids, thereby modifying insulin action via changes in membrane fluidity and insulin receptor binding( Reference Liu, Baracos and Quinney 47 ). Moreover, membrane FA composition is, in particular, changed at the level of lipid rafts and caveolin microdomains modifying signal transduction, microlocalisation of different signalling proteins and trafficking( Reference Anderson and Ma 48 , Reference Le Foll, Corporeau and Le Guen 49 ). For example, there is evidence that the membrane adaptator caveolin-1 is involved in the regulation of AKT signalling( Reference Sedding, Hermsen and Seay 50 ). Nevertheless, the underlying mechanisms are certainly very complex. The n-3 LC-PUFA enrichment of membrane rafts affects various signalling pathways depending on the cell line involved( Reference Anderson and Ma 48 ). The effects observed may also depend on the individual PUFA, as has been suggested by a recent in vitro study( Reference Kamolrat and Gray 51 ), and may be different for ALA compared with its longer-chain counterparts, and this still requires investigation.
In conclusion, we report improved growth in chickens fed diets enriched with PUFA, i.e. rich in LC-PUFA as well as the precursor ALA, for a short period. Our findings also indicate that only the ALA-enriched diet providing the highest levels of n-3 FA (about 16 % of total FA) leads to increased pectoralis major muscle weight, related to a higher n-3 FA content and to a higher level of activation of the insulin-dependent S6K1/S6 pathway involved in the translation of mRNA into proteins. The mechanisms through which n-3 PUFA are able to modulate insulin sensitivity and their consequences on anabolic processes remain to be characterised. Our findings provide a basis on which to optimise dietary FA provision. Such nutritional strategies could be used to improve feed utilisation and optimise body composition and meat quality while ensuring the efficiency of production systems.
Supplementary material
To view supplementary material for this article, please visit http://dx.doi.org/10.1017/S0007114513003085
Acknowledgements
The authors thank P. Moritz and F. Mercerand (INRA, UE1295 PEAT, Nouzilly, France) for animal care and experimental design management; E. Cailleau-Audouin, S. Crochet, J. David, N. Flamion, J. M. Hallouis and T. Bordeau (INRA, UR83 Recherches Avicoles, Nouzilly, France) for their technical assistance; and C. Diot for his expertise on primers used in the quantification of the expression of genes involved in hepatic lipid metabolism. They are also grateful to D. Raine (Surrey, UK) for editing the article.
The present study was supported by Research Grants from ONIDOL and INRA; both contributed to the study design and manuscript preparation. The funder INRA also contributed to the conduct of the study, analysis of the samples and data, and interpretation of the findings.
The authors' contributions were as follows: D. H., N. S., C. P., M. L. and S. T. contributed to the conception and design of the study; P. C., S. M.-C. and E. B. were involved in the acquisition of the data; P. C., E. B. and S. T. analysed and interpreted the data. All authors were involved in the writing of the final draft of the manuscript and approved the final format.
None of the authors has any conflicts of interest.


