


A suboptimal diet is a major contributor to chronic disease risk worldwide(Reference Afshin, Sur and Fay1). The increasing appearance of these diseases earlier in life may, at least in part, be the result of more rapid biological ageing through the attrition of telomeres(Reference Sun, Shi and Prescott2,Reference Sanders and Newman3) . Dietary strategies that mediate the development of many chronic diseases have been linked to the biological mechanisms implicated in accelerated telomere attrition, namely oxidative stress and inflammation(Reference Freitas-Simoes, Ros and Sala-Vila4,Reference Houben, Moonen and van Schooten5) . Consequently, dietary intake may be related to chronic disease risk, indirectly through effects on telomeres.
Telomeres consist of tandem repeat sequences of DNA and associated proteins that function to cap and protect chromosomal ends, preserving viability and functioning of the chromosome(Reference Blackburn, Epel and Lin6,Reference Victorelli and Passos7) . Telomere repeats are lost during cellular replication as the enzyme responsible for DNA synthesis, DNA polymerase, is unable to fully replicate to the end of the 3’ strand(Reference Aubert and Lansdorp8). When telomeres reach a critical length, pathways to induce senescence are initiated, such that cells lose the ability to divide and replicate(Reference Liu, Wang and Wang9). Cellular replicative senescence is thus driven by proliferative exhaustion through telomere loss. Stress-induced senescence can also occur, and is triggered independently, at any telomere length (TL), through the synthesis of inflammatory cytokines(Reference Shivappa, Wirth and Hurley10), oxidative damage or DNA instability(Reference Fumagalli, Rossiello and Clerici11). Telomerase, a ribonucleoprotein capable of synthesising telomere repeats, may restore TL; however, its activity is either down-regulated or absent in most somatic cells(Reference Blackburn, Epel and Lin6,Reference Gomes, Ryder and Houck12) . Exceptions are stem cells and active lymphocytes that are capable of rapid division and expansion(Reference Forsyth, Wright and Shay13). For these reasons, telomere attrition is considered a primary hallmark of ageing(Reference Lopez-Otin, Blasco and Partridge14,Reference McHugh and Gil15) , and mechanisms that regulate TL are being investigated using lymphocytes as a model.
Support for telomeres as biomarkers for ageing and disease has derived from studies where longer telomeres have been associated with longevity(Reference Atzmon, Cho and Cawthon16), and shortened telomeres associated with increased risk of chronic disease(Reference Blackburn, Epel and Lin6), and some cancers(Reference Codd, Nelson and Albrecht17,Reference Ma, Liu and Song18) . Additionally, there is increasing epidemiological evidence that supports behavioural, psychosocial and environmental influences on TL, where the impact of inherited TL declines with age, as cell proliferation rates slow(Reference Sidorov, Kimura and Yashin19). Exposure to lifestyle influences, including dietary intake may then have a greater impact on telomere integrity, proposed to be through the interrelated occurrences of inflammation and increased oxidative stress(Reference Sun, Shi and Prescott2,Reference Dugdale and Richardson20–Reference Hjelmborg, Dalgard and Moller22) . Targeting molecular mechanisms involved in telomere lengthening or rates of attrition may therefore facilitate intervention strategies that ameliorate chronic disease risk, improving health span and longevity(Reference McHugh and Gil15,Reference Zhu, Liu and Ding23) .
In the last few years, evidence has accumulated that telomeres are susceptible to lifestyle modifications, specifically diet, and whether nutrients, foods and/or dietary patterns modulate TL is gathering pace(Reference Freitas-Simoes, Ros and Sala-Vila4,Reference Galiè, Canudas and Muralidharan24) . It has been shown that telomere attrition has largely been linked to the antioxidant or anti-inflammatory properties of nutrients and foods(Reference Freitas-Simoes, Ros and Sala-Vila4,Reference Galiè, Canudas and Muralidharan24–Reference Rafie, Golpour Hamedani and Barak28) . There is evidence that an anti-inflammatory diet can moderate the rate of attrition, where in shorter term dietary intervention studies of 8 weeks, and 4 months, telomere lengthening has been demonstrated(Reference Barden, O’Callaghan and Burke29,Reference Kiecolt-Glaser, Epel and Belury30) . In addition, the antioxidant capacity of the diet has been positively associated with longer telomeres(Reference Garcia-Calzon, Moleres and Martinez-Gonzalez26).
There is increasing interest in the analysis of whole diets as determinants of health or disease, with emerging evidence that it is the quality of the overall diet over time that influences chronic disease risk, not specific foods or nutrients(Reference Kirkpatrick, Reedy and Krebs-Smith31–Reference Schulze, Martinez-Gonzalez and Fung33). Indices of diet quality assess and score overall dietary intake in terms of adherence to evidence-based dietary guidelines or recommendations(Reference McNaughton, Ball and Crawford34). As with the mechanisms proposed for individual foods and nutrients, dietary patterns that reduce oxidative stress and inflammation may prevent telomere erosion(Reference Galiè, Canudas and Muralidharan24,Reference Paul35) . To date, inconsistent results have been found in longitudinal studies assessing associations between TL and adherence to dietary patterns assessing diet quality(Reference Garcia-Calzon, Martinez-Gonzalez and Razquin36–Reference Meinila, Perala and Kautiainen39). No studies have investigated changes in diet quality on TL in an Australian population.
The inclusion of nuts, and specifically almonds, in the diet has been associated with improved nutrient intakes and better diet quality(Reference O’Neil, Nicklas and Fulgoni40,Reference O’Neil, Nicklas and Fulgoni41) . Higher nut consumption 10 years previously was associated with longer telomeres in Korean adults(Reference Lee, Jun and Yoon38). More recently, habitual nut consumers in the USA were observed to have longer telomeres and thus lower rates of biological ageing compared with non-nut consumers(Reference Tucker42). Older participants (63–79 years) consuming a walnut supplemented diet (representing 15 % of estimated energy requirements), for 2 years, maintained leukocyte TL (+0·1 kilo bp; 95 % CI, –0·22, 0·24) compared with the control group (–0·29 kilo bp; 95 % CI, –0·56, –0·03). The time × intervention interaction did not gain significance; however, it suggested a trend for walnuts preserving TL(Reference Freitas-Simoes, Cofán and Blasco43). Additionally, forty-nine participants with prediabetes consuming pistachios for 4 months demonstrated increased expression of two telomere-associated genes related to telomerase maintenance and reduction in oxidative damage to telomeric DNA; however, no difference in TL was observed(Reference Canudas, Hernández-Alonso and Galié44). Therefore, given the richness of almonds in bioactive components (MUFA, fibre, vitamin E and flavonoids) that have the potential to impact telomere attrition through additive effects(Reference Davinelli, Trichopoulou and Corbi45), the present study aimed to investigate (a) the associations between diet quality and TL in overweight, mid-age to older men and women (50–80 years), (b) the impact of changing dietary exposure (i.e. diet quality by including almonds in a habitual diet for 12 weeks) on TL and (c) whether the TL change is more pronounced in neutrophil or lymphocytes.
Materials and methods
Participants, randomisation and study protocol
Data were sourced from 124 participants enrolled in a dietary intervention trial for which samples were available for telomere analysis. Study design, participant eligibility criteria and details of primary outcomes have previously been reported(Reference Coates, Morgillo and Yandell46). Briefly, adults aged 50–80 years, with overweight and obesity (BMI 25–39·9 kg/m2) were recruited between January 2016 and September 2017 for a 12-week randomised controlled parallel arm intervention study designed to investigate the effects of different snack foods on major cognitive domains and cardiometabolic function through the inclusion of raw unsalted almonds or isoenergetic carbohydrate-rich snack foods. Participants with overweight/obesity were selected for the main study as lower cognitive function has been associated with an elevated BMI(Reference Yang, Shields and Guo47). Eligible participants provided written informed consent at screening visits. Ethical approval for the study was granted by the University of South Australian Human Research Ethics Committee (Application ID: 0000034452), and the primary study was registered on the Australian New Zealand Clinical Trials Registry (ANZCTR) (Trial ID: ACTRN12615001294549).
Randomisation and dietary intervention
Participants were matched for age, sex and BMI by minimisation(Reference Saghaei48), and randomised to an almond-enriched diet (AED) or nut-free diet (NFD). Both intervention groups were instructed to replace usual snack foods with supplied raw unsalted almonds or an isoenergetic carbohydrate-rich snack food, on 6 d/week for 12 weeks(Reference Coates, Morgillo and Yandell46). The almonds and carbohydrate-rich snack provided ∼15 % of their total daily energy intake. Almonds provided a source of protein, monounsaturated fats, fibre, vitamin E and bioactive compounds such as flavonoids. The carbohydrate-rich snack foods (The Original Scotch Finger, Arnott’s Biscuits, or No Added Salt Potato Chips, Freedom Foods) were chosen as they provided equal energy within a manageable quantity of food, but were nut and seed free, and devoid of the key macro and micronutrients and bioactive compounds found in almonds (online Supplementary Table S1)(Reference Coates, Morgillo and Yandell46). In addition, sweet biscuits and potato chips are a common snack in Australia as well as other countries. The same sweet biscuit has previously been compared against almonds as a snack in people with type II diabetes(Reference Bowen, Luscombe-Marsh and Stonehouse49). Compliance with dietary intervention was assessed using daily test food checklists reviewed each 3 weeks, and with weighed food record (WFR) at baseline (week 0) and 12 weeks.
Data collection tools, measurements and procedures
Screening questionnaires captured age and sex of participants, medical history, medication and supplement use, plus smoking history and alcohol intake (standard drinks per week). Participants attended the Clinical Trials Facility at the University of South Australia at baseline (week 0) and week 12 for assessment. Prior to assessment, participants were required to fast for at least 10 h and abstained from alcohol for the previous 24 h(Reference Coates, Morgillo and Yandell46).
Demographic data collected at baseline included socio-economic status (Socio-Economic Indices for Areas)(50), parental and participant race/ethnicity, highest level of education attained, employment status and marital status. Parental and participants country of birth were categorised in accordance with the Australian Standard Classification of Cultural and Ethnic narrow groups(51).
At each clinic visit, anthropometric measurements were taken (height, body mass, waist circumference) along with systolic and diastolic blood pressure (HDI Cardiovascular Profiler CR2000, Hypertension Diagnostics), and blood samples, for fasting blood biochemistry (lipids and glucose), and TL analysis. Behaviours related to diet (3-d WFR capturing intake on two consecutive weekdays and one weekend day(Reference Fyfe, Stewart and Murison52)), physical activity (Bouchard’s 5-d physical activity diary(Reference Bouchard, Tremblay and Leblanc53)) and sleep quantity (7-d sleep diary synchronised to actogram data (Actiwatch 2, Philips Respironics Inc.)) were obtained in the week immediately preceding clinic visits. Self-reported sleep quality over the previous month was assessed at clinic visits using the Pittsburgh Sleep Quality Index to give a ‘global’ score ranging from 0 to 21(Reference Buysse, Reynolds and Monk54).
Blood sample collection and processing
For TL analyses, participants were separated into two cohorts based on how venous blood samples were processed after collection. For all participants, whole blood was obtained by venepuncture into EDTA vacutainers. Blood samples from cohort 1 (n 55) were processed in order to separate neutrophils and lymphocytes. Neutrophils and lymphocytes were separated from whole blood by density-gradient centrifugation (590 Relative Centrifugal Force, 23°C 40 min, no brake) and resuspended in 900 µl PBS and 100 µl dimethylsulfoxide. Blood samples from cohort 2 (n 69) were collected into EDTA vacutainers and aliquoted as per requirements. Neutrophils and lymphocytes could not be isolated for this cohort (limited by funding available); therefore, whole blood was used for DNA isolation. All samples were stored at −80°C until DNA isolation and TL analysis.
Metabolic syndrome
The metabolic syndrome (MetS) status was ascertained by the presence of three of five risk factors as per established criteria. A score (0–5) was derived from updated waist circumference thresholds based on parental/participant ethnicity(Reference Alberti, Eckel and Grundy55,Reference Harris56) , TAG (mmol/l), HDL (mmol/l), systolic and diastolic blood pressure (mmHg) and fasting blood glucose (mmol/l). Per the guidelines, participants on lipid lowering and/or anti-hypertensive medication were considered to be meeting criteria for dyslipidaemia and hypertension(Reference Alberti, Eckel and Grundy55). Data on individual MetS risk factors have previously been published(Reference Coates, Morgillo and Yandell46).
Telomere length analysis
Genomic DNA was purified and extracted from isolated neutrophils and lymphocytes (cohort 1) and whole blood samples (cohort 2) using a DNeasy Blood and Tissue mini kit (Qiagen) as per manufacturer guidelines, with slight modifications depending on the blood cell type. DNA was quantified using Nano-Drop 1000 spectrometer (Thermo Fisher Scientific) to determine quality and yield of DNA. Purified DNA samples were diluted as per experimental requirements (5 ng/µl) and stored at 4°C before setting up the TL assay.
TL was analysed from the quantified DNA using quantitative PCR assay as described previously(Reference Cawthon57,Reference Dhillon, Zabaras and Almond58) . The ratio of the telomere (T) repeat copy number to the single-copy gene (S) was determined for each sample, with the acidic ribosomal phosphoprotein PO (36B4 gene) selected as the reference single-copy gene (S). Reactions were performed in a 384 well-plate using a ViiA7 Fast Real-time PCR system (Applied Biosystems) using telomere and 36B4 specific primers. The concentrations of telomere-specific primers (F: 5′-GGTTTTTGAGGGTGAGGGTGAGGGTGAGGGTGAGGGT-3′; R:5′TCCCGACTATCCCTATCCCTATCCCTATCCCTATCCCTA-3′) used for the experiments were 270 and 900, respectively, for forward and reverse. The concentrations for 36B4-specific primers (F: 5′-CAGCAAGTGGGAAGGTGTAATCC-3′ and R: 5′-CCCATTCTATCATCAACGGGTACAA-3′) used were 300 nM for both primers. The final reaction mix contained 5 µl Fast SYBR Green Master Mix (2X) (Sigma Aldrich), 2 µl diluted DNA (10 ng total) and 3 µl forward and reverse primer diluted with molecular grade water to required concentration to a final well volume of 10 µl. The thermal cycling profile consisted of a 95°C (00.20) hold stage followed by 40 cycles of 95°C (00.01) and 60°C (00.20). A melt curve for each primer was also performed as an additional cycle: 95°C (00.15) and 60°C (01.00) cycle. Single-copy gene (36B4) and telomeres were assessed on separate plates. Assays were performed in a manner that all samples from an individual were run in triplicate on the same plate. Cohort 1 provided samples from neutrophils and lymphocytes at week 0 and 12 (n 12 per person) and cohort 2 provided a sample from whole blood at week 0 and 12 (n 6 per person). The triplicate cycle threshold values were used to calculate mean cycle threshold value. On each plate, a serial dilution of reference DNA from 1301 cell line (mean TL of 23 000 bp) ranging from 0·38 to 5·02 ng/μl generated a six-point standard curve for each qPCR run, these again were run in triplicate. A total of six plates were run. A standard curve with a high correlation factor (R 2 ≥ 0·97) was required to accept the results from the plate. The standard curve was then used to convert the T/S ratio into TL in bp using the following equation: absolute TL (bp) = 2433·23X + 3109·51 where X = T/S ratio, 2433·23 is the slope and 3109·51 is the intercept of the standard curve(Reference Wojcicki, Heyman and Elwan59). As part of our inter-laboratory quality control, Terminal Restriction Fragment method was used to check and confirm the TL in our cell lines as well as five DNA samples from seven different decades from male and female participants. Correlation between Terminal Restriction Fragment and qPCR assay in our laboratory was very strong (R 2 = 0·72) and it supports that our method of choice (qPCR) is reproducible in determining TL. The intra-assay CV between triplicates was 0·85 % for telomeres and 0·42 % for the single-copy gene, whereas the inter-assay CV between plates was 3·0 % for telomeres and 3·2 % for the single-copy gene.
Diet quality
WFR were analysed using FoodWorks Nutritional Analysis Software® Version 8 (Xyris Software). FoodWorks® Version 8 derives nutrient data from the Australian Food and Nutrient (AUSNUT) 2011–2013 food composition(60), to provide an estimate of daily energy, macro- and micronutrient intake. To exclude participants suspected of under or overestimating daily intake, established cut-offs of < 4000 kJ or > 17 000 kJ/d were applied to total energy intake(Reference Willett61).
Diet quality was assessed by the Dietary Guideline Index (DGI) developed for application to WFR(Reference Ward, Coates and Hill62). DGI scores range from 0 to 120 with higher scores reflecting greater compliance with the Australian Dietary Guidelines and a better quality diet(63). The core food components were scored 0–70 and included scores for intake and variety from the Australian Dietary Guidelines core food groups. Non-core food components were scored 0–50 and reflected foods to moderate or limit intake. A full description of the components and scoring criteria, including scores for core and non-core foods, has previously been described(Reference Ward, Coates and Hill62). As almonds are considered to be a source of protein, they were categorised and quantified in the lean meat and alternatives component, whereas the snacks (a combination of Original Scotch Finger and No Added Salt Potato Chips) provided as the NFD were flagged as a discretionary item and included in this component.
Sample size
Samples from baseline and week 12 visits from 124 participants were available for TL analysis. Blood samples were prepared based on when participants enrolled into the main study and availability of staff to process samples. In the first cohort, lymphocytes and neutrophils were available for telomere analyses (n 55). Whole blood samples were available for telomere analyses in the second cohort (n 69). With the cell types considered separately, and based on Pearson correlations at an α level of 0·05, the study had 80 % power to detect a moderate correlation (r = 0·37) between change in total DGI score and change in TL in neutrophils and lymphocytes (n 55) and was similarly powered to detect a correlation (r = 0·33) between change in DGI and change in TL in whole blood (n 69)(Reference Cohen64).
Data and statistical analysis
Statistical analyses were undertaken using SPSS version 25.0 (SPSS In). Data were checked for normality using histogram plots and Shapiro–Wilk tests. Non-normally distributed data were initially transformed (squared and logged); however, as distributions did not improve, analyses were performed on non-transformed data. For all analyses, a statistical significance of P < 0·05 was set.
Weighted means for TL in neutrophils and lymphocytes were determined for each participant based on each cell types relative proportion in blood(Reference DeMoranville and Longe65).
 $$\left[ {neutrophil\;TL\;*\;0\cdot7\left] {\; + \;} \right[lymphocyte\;TL\;*\;0\cdot3} \right] = weighted\;mean\;TL$$
A Mann–Whitney U test was used to compare within-person changes from the weighted neutrophil and lymphocyte mean TL (cohort 1) to mean whole blood TL (cohort 2). A significant difference was identified (P = 0·001); therefore, it was determined appropriate to analyse the cell types individually.
Covariates considered for inclusion into statistical models assessing relationships with TL were explored using Spearman’s correlation coefficient. Baseline measures of age, sex, BMI, energy intake, the MetS score, physical activity, sleep quality and total sleep time were assessed. Alcohol intake and smoking have the potential to be confounding factors; however, participants were required to be non-smokers and alcohol intake was assessed within the DGI, so these were not included as covariates. Potential demographic confounders, parental and participant race/ethnicity, highest level of education attained, employment status and marital status were also assessed for inclusion. Sex differences in TL at baseline were assessed using Mann–Whitney U test.
Linear regression models were used to investigate baseline associations between DGI scores (reflecting diet quality) and TL in the different cell types and whole blood. Age, sex and BMI were included in the multivariable linear regression model. A random effects mixed model with time and treatment as fixed effects and subject ID as a random effect was used to determine the effect of change (week 12–week 0) in diet quality (total DGI score; core food and non-core food component sub-scores) on change in TL. TL in each cell type and whole blood were considered separately. P values were determined for the group, time and group by time interactions. Multivariable linear regression was used to examine the relationship between change in TL (in whole blood, neutrophils or lymphocytes) and change in diet quality, accounting for age, sex and BMI. Cohen’s standard classifications for β-standardised regression coefficients were employed(Reference Cohen66). To account for intraindividual correlation in TL, percentage difference in measures of TL and diet quality relative to baseline values were also calculated, and change relationships assessed by multivariate linear regression(Reference Vickers and Altman67).
Results
Participants
The consort diagram for the trial is shown in Fig. 1. Of the 151 participants enrolled, nine withdrew prior to baseline assessment, leaving 142 who completed the baseline measures. A total of fourteen participants withdrew during the trial (mostly due to time commitments). Of the 128 completers, baseline and week 12 samples for telomere analysis were available for 124 participants. Baseline WFR was available for 123 of these participants and for 119 participants at week 12. One participant was excluded from dietary analyses with energy intake falling below 4000 kJ/d.
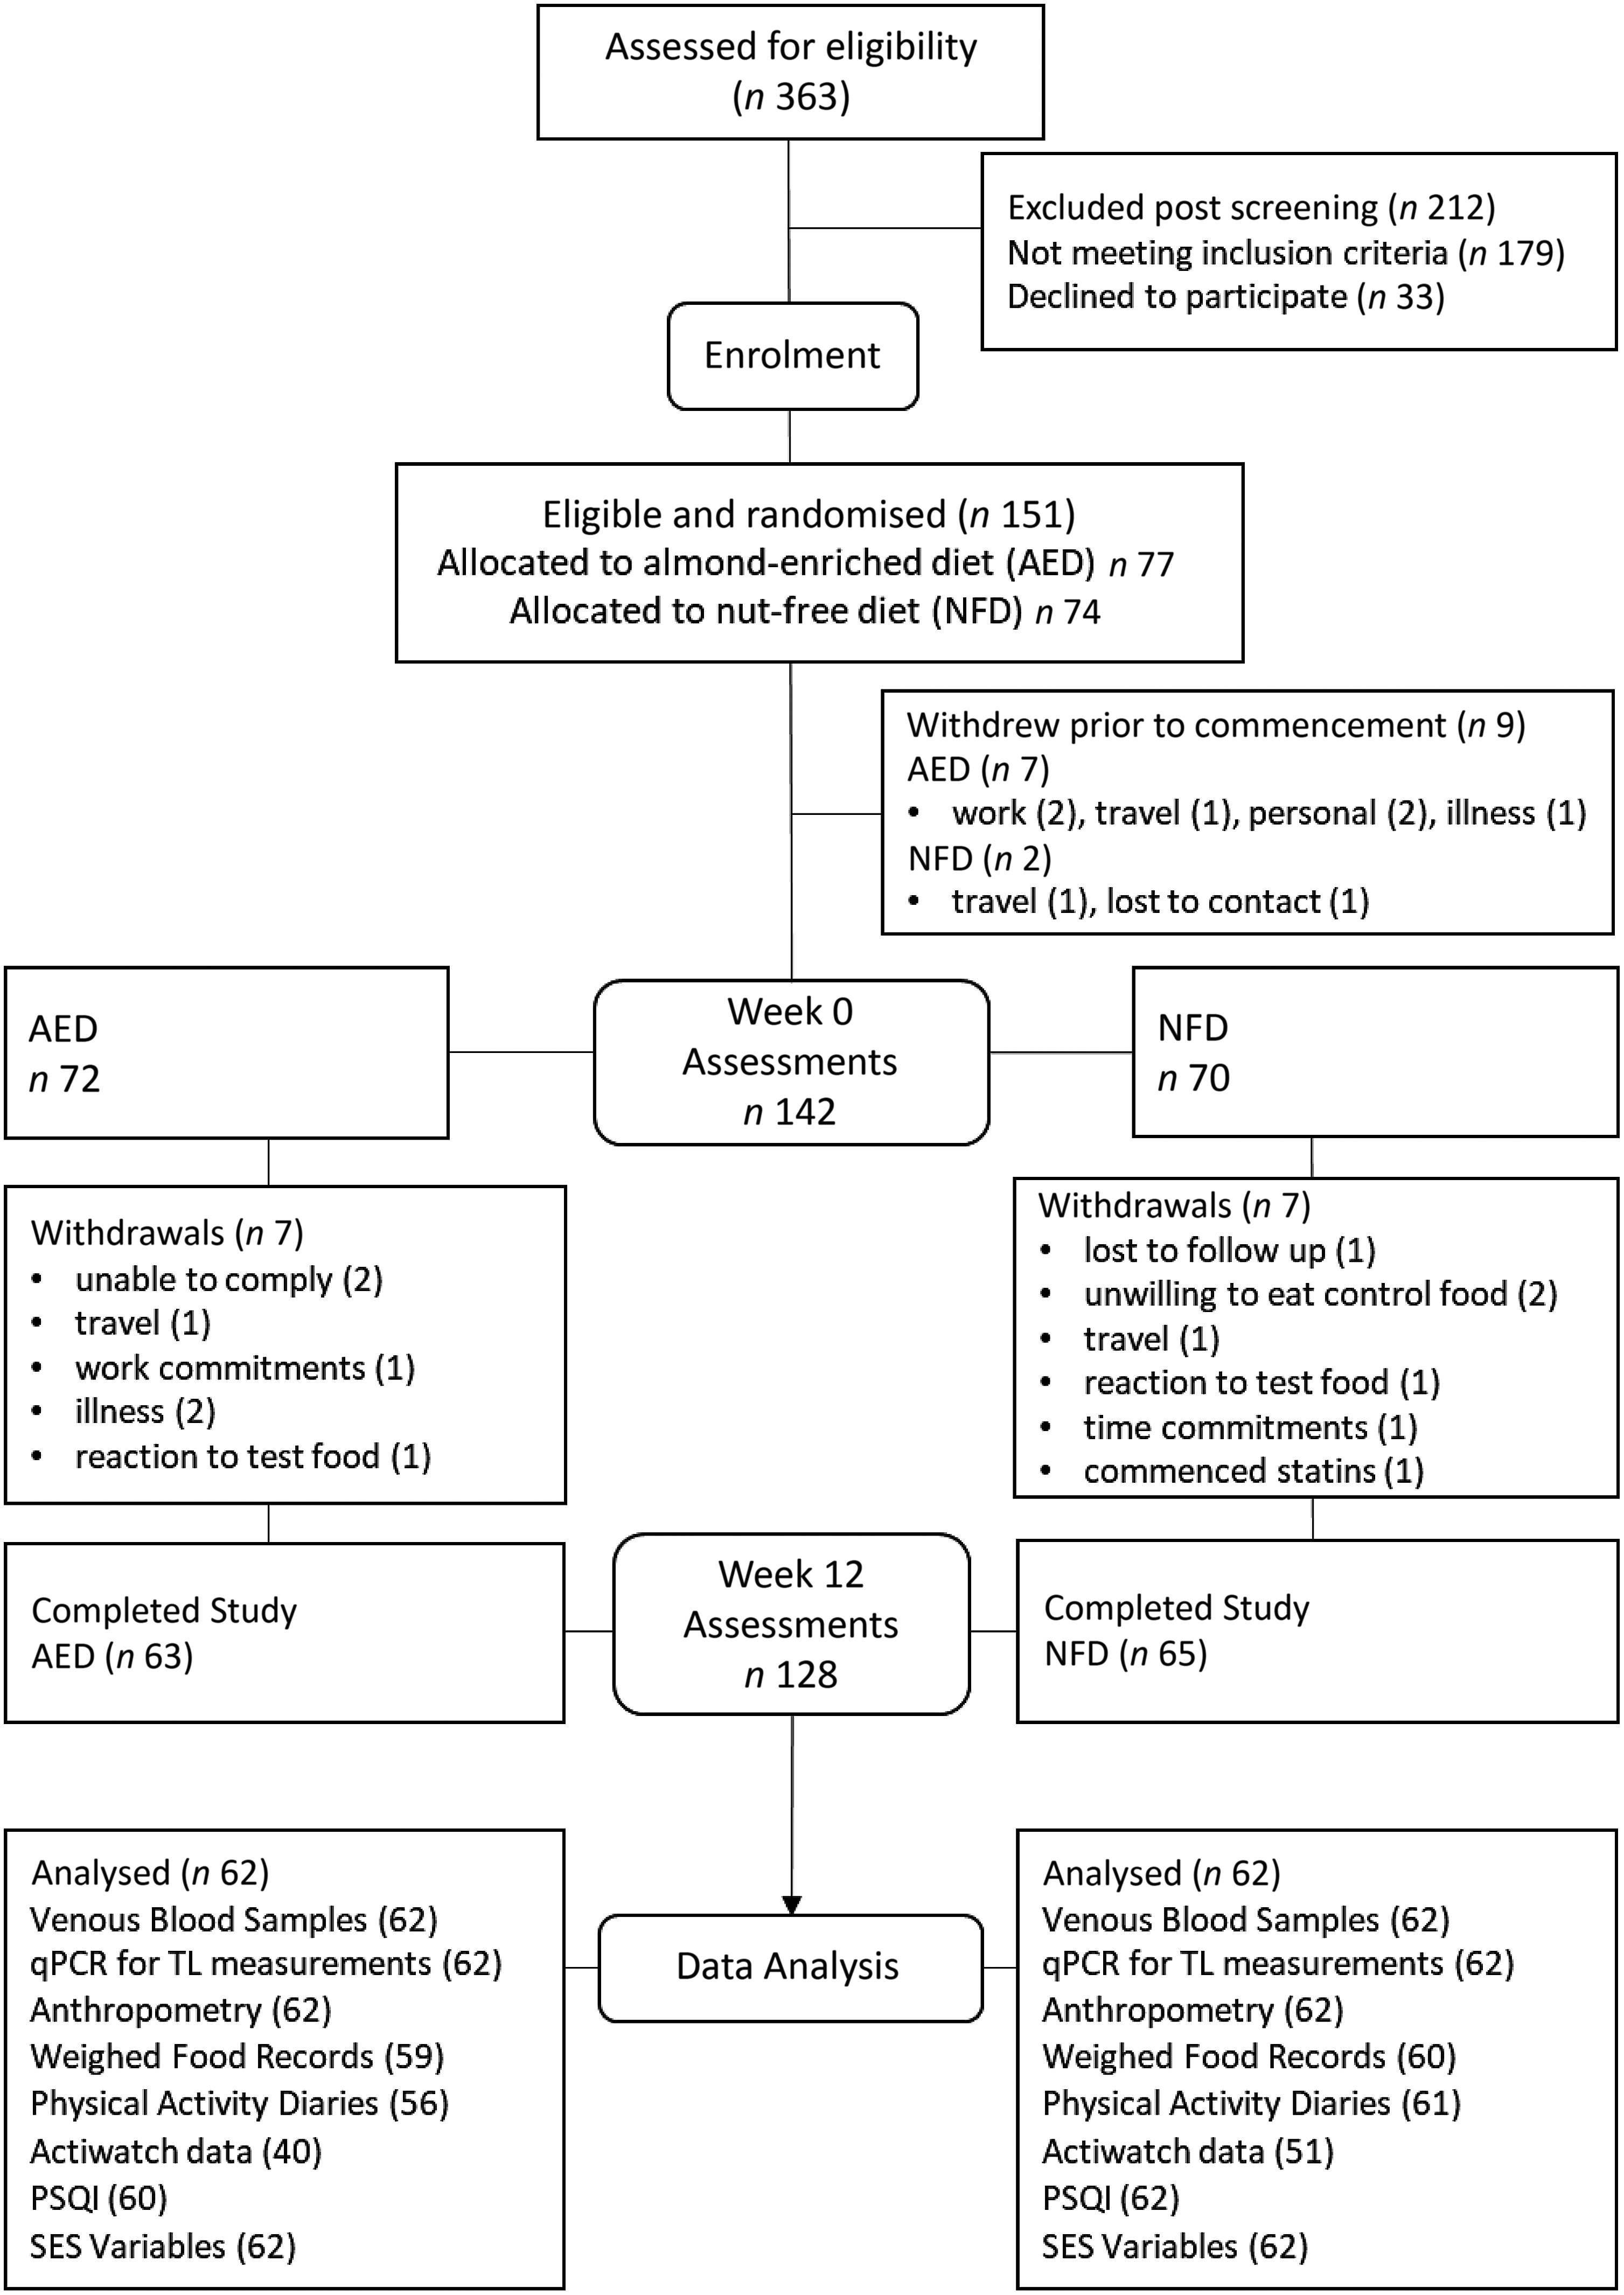
Fig. 1. Consort diagram showing participant flow through the study and number analysed per variable. AED, almond-enriched diet; NFD, nut-free diet; qPCR, quantitative PCR; TL, telomere length; PSQI, Pittsburgh Sleep Quality Index; SES, socio-economic status.
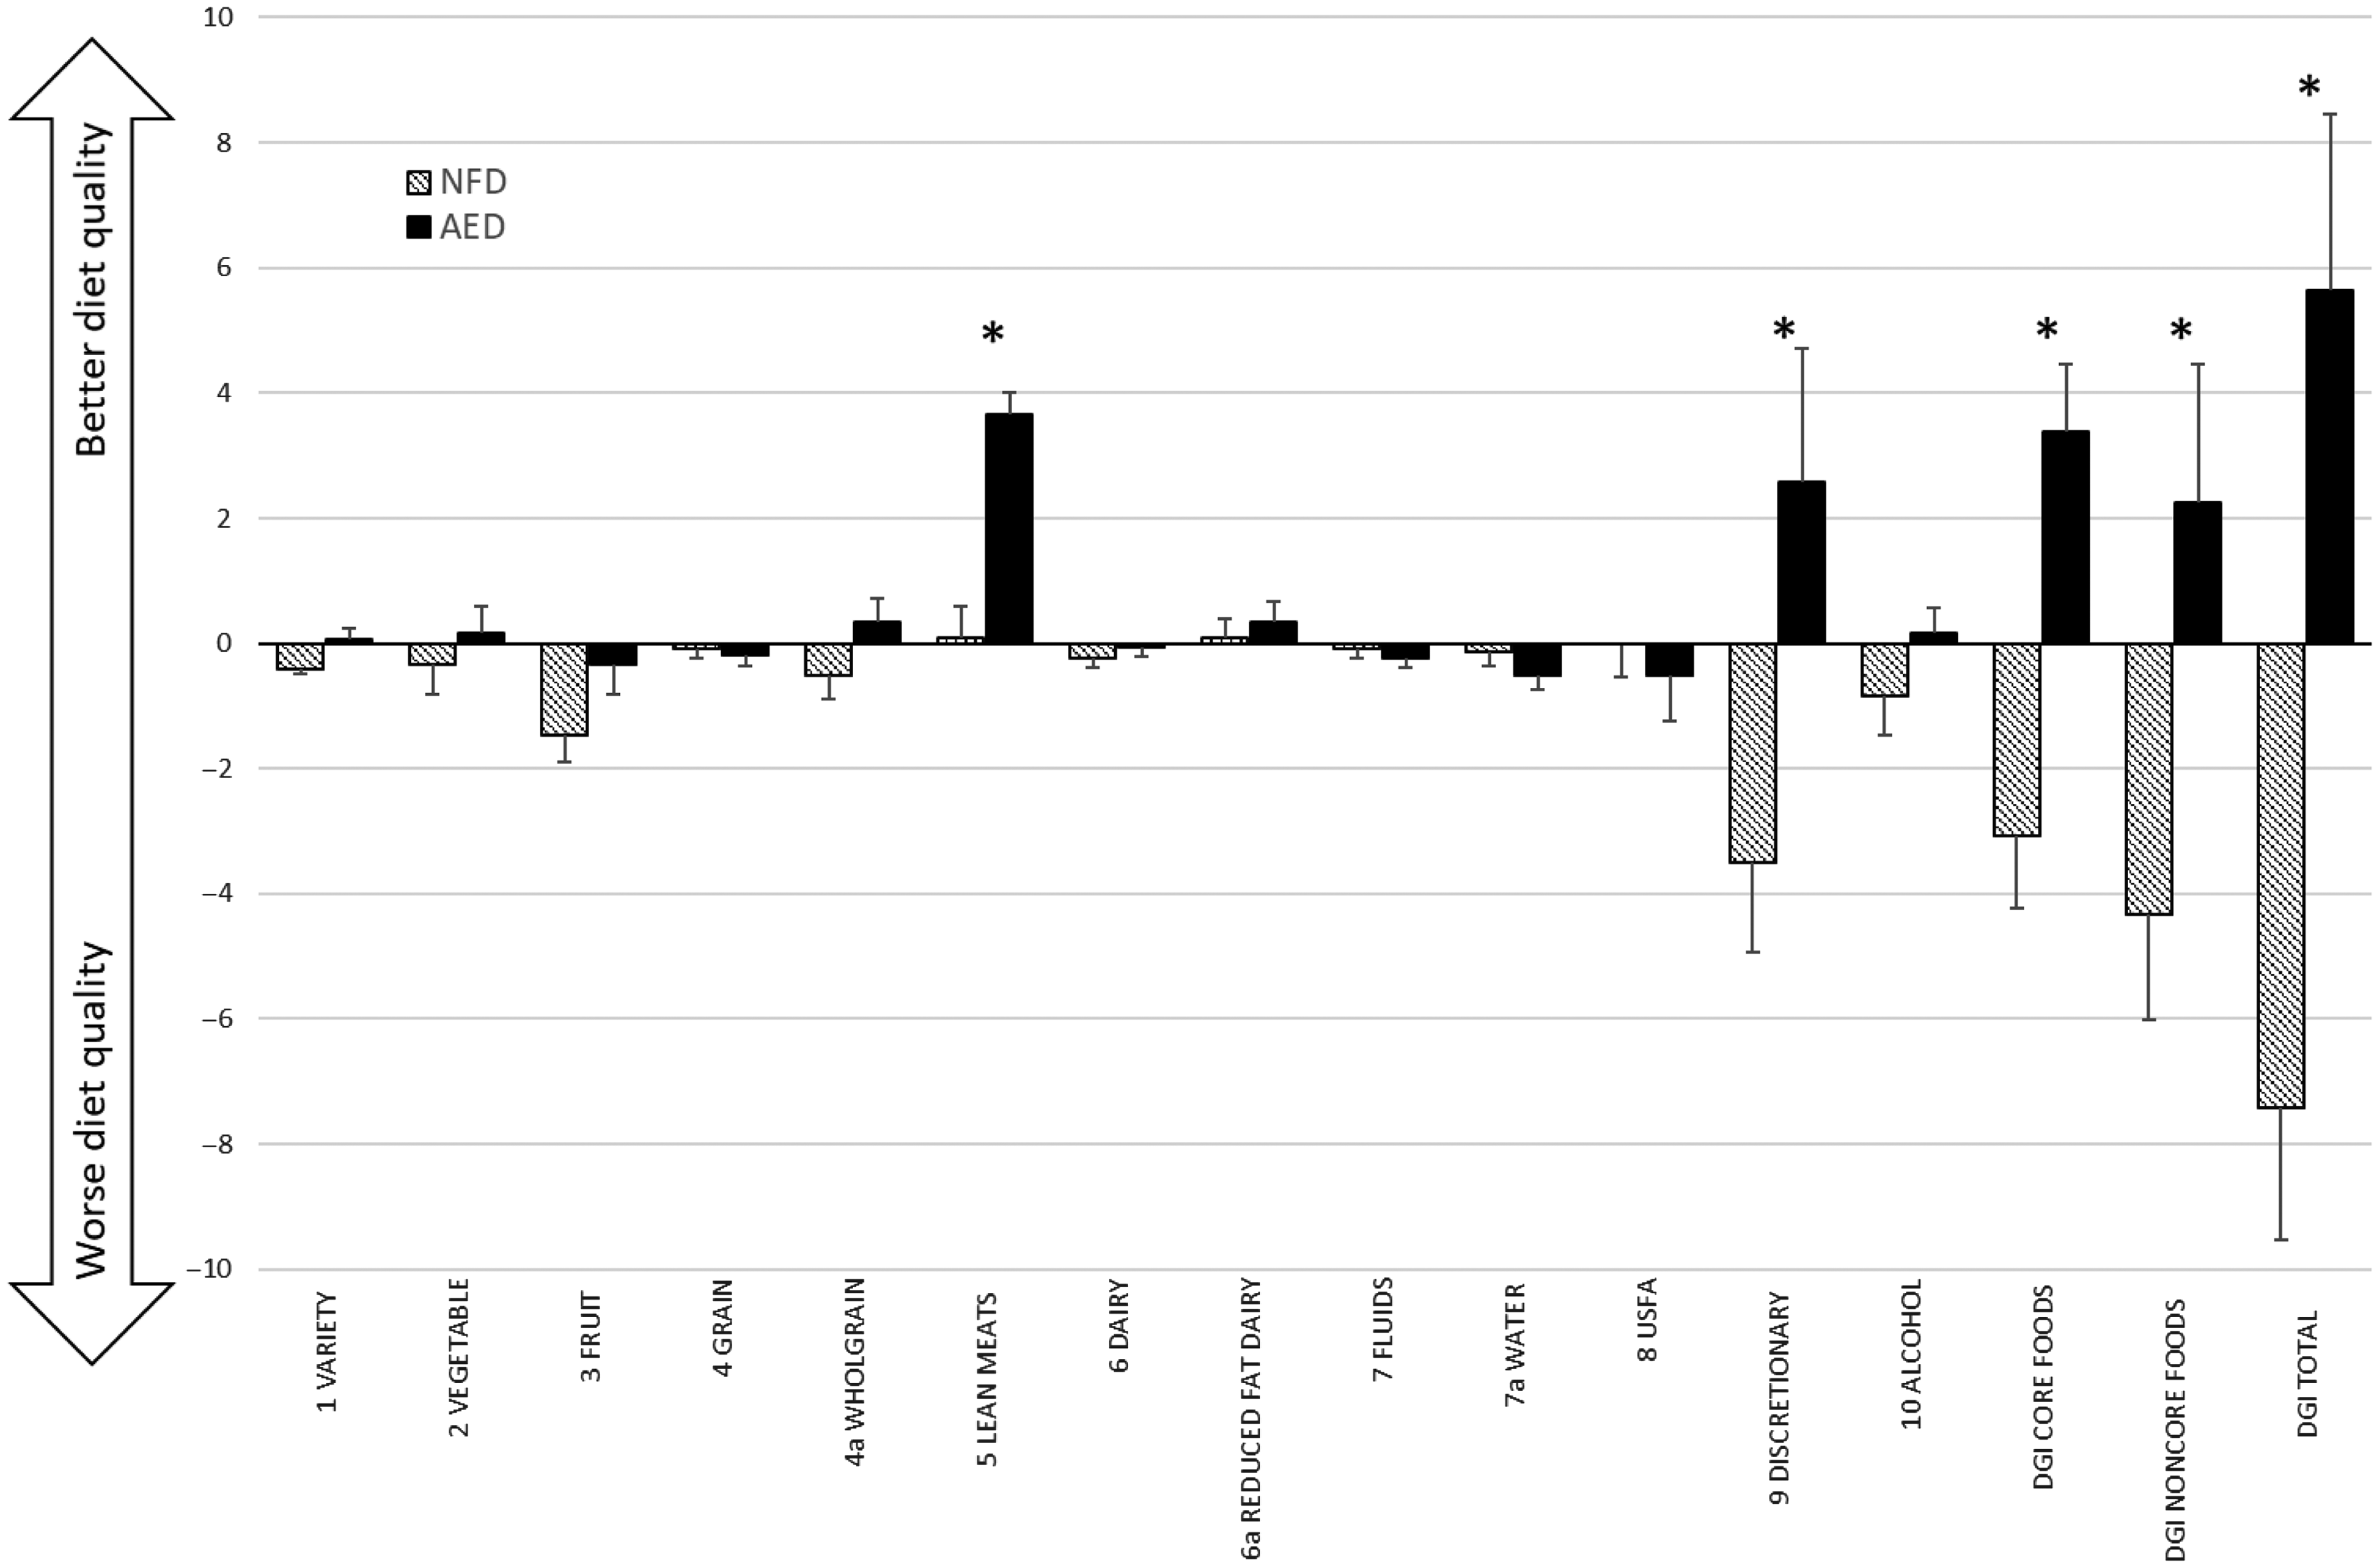
Fig. 2 Mean change (±standard error) in DGI component scores between intervention groups, plus mean change in DGI scores for core food components, non-core food components and total DGI. *denotes significant between group difference derived from mixed model (P < 0·05). AED, almond-enriched diet; NFD, nut-free diet; USFA, unsaturated fatty acids; DGI, Dietary Guideline Index.
Baseline characteristics
Baseline characteristics and DGI scores of participants are presented in Table 1. Participants were aged 50–80 years, 62 % were women, with equal numbers of participants falling in the overweight (BMI 25·0–29·9 kg/m2, n 62) and obese (BMI ≥ 30 kg/m2, n 62) categories. Most participants were married (65 %), retired or semi-retired (58 %), having gained a tertiary qualification (diploma or higher, 65 %) and 32 % of participants were in the highest two deciles of Socio-Economic Indices for Areas Disadvantage (least disadvantaged). Australia and New Zealand (59 %), the UK (19 %) and Europe (11 %) represented the principal countries of birth of participants. There were no differences in baseline TL between men and women.
Table 1 Baseline characteristics of study participants
(Mean values and standard deviations)
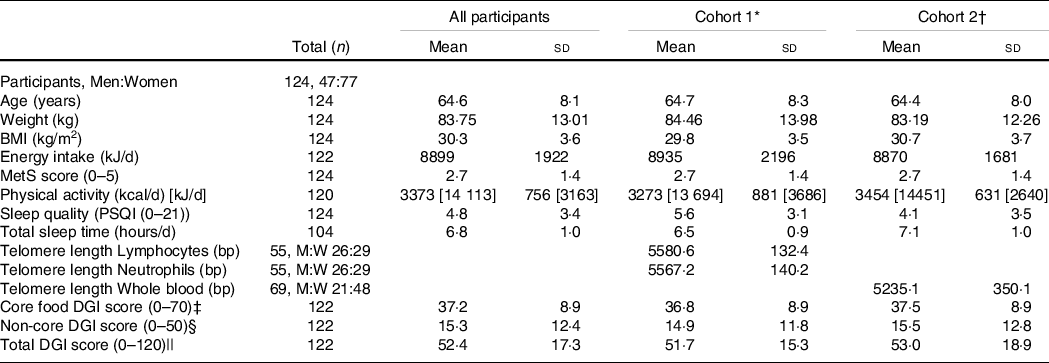
MetS, metabolic syndrome; kcal, kilocalories (conversion factor for kcal to kJ, 4.184); PSQI, Pittsburgh Sleep Quality Index; DGI, Dietary Guideline Index; M:W, numbers of men and women.
* Cohort 1 defined by availability of neutrophils and lymphocytes samples for analyses.
† Cohort 2 defined by availability of whole blood for analyses.
‡ Core food components (0–70) include scores for variety plus vegetable, fruit, grain, wholegrain, lean meat and alternatives, dairy and alternatives, reduced fat dairy, and fluid serves, and proportion of water.
§ Non-core food components (0–50) include scores for unsaturated spreads and oils, discretionary and alcohol serves.
|| Total DGI scored 0–120. Statistical significance P < 0·05.
Baseline associations
Table 2 displays associations between participant characteristics and TL at baseline. TL in lymphocytes, neutrophils and whole blood were all moderately inversely associated with age. TL was moderately inversely associated with BMI in whole blood (rho = −0·391, P = 0·001), but not in neutrophils or lymphocytes. There was a weak positive association between energy intake and TL in neutrophils (rho = 0·267, P = 0·049), but not other cell types. There was a weak negative association between TL and physical activity levels (rho = −0·248, P = 0·045) and the MetS score in whole blood only (rho = −0·296, P = 0·014). No associations were seen between TL and sleep quality (Pittsburgh Sleep Quality Index) or quantity (sleep time in hours). There were no significant relationships between diet quality (DGI score) and TL in lymphocytes, neutrophils or whole blood samples at baseline. Similarly, no significant relationships were observed between DGI sub-scores for core or non-core foods and TL (data not shown). Worse diet quality was associated with higher energy intake (rho = −0·228, P = 0·011).
Table 2 Associations between baseline characteristics with DGI scores and telomere length in lymphocytes, neutrophils and whole blood in trial participants*
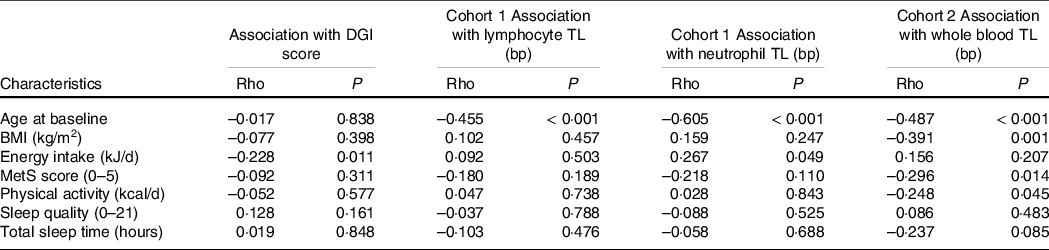
DGI, Dietary Guideline Index; TL, telomere length; MetS, metabolic syndrome.
* Baseline exploratory analysis did not account for multiple comparisons. Statistical significance P < 0·05.
Change in health, lifestyle, diet quality and telomere length
Health and Lifestyle
Over the 12-week intervention, energy intake increased in the AED (9009 ± 263 kJ v. 9631 ± 264 kJ) compared with the NFD (8819 ± 259 kJ v. 8691 ± 262 kJ; group by time interaction, P < 0·05). Body weight remained stable throughout the intervention, with no change in physical activity levels, or the duration or quality of participants’ sleep. Prevalence of the MetS was reduced in the entire cohort by week 12 (week 0, 57·3 % v. week 12, 52·4 %, P < 0·002).
Diet quality
By week 12, the total DGI score improved significantly in the AED compared with a reduction in the NFD (group by time interaction P < 0·001; +5·2 v. –7·4 points, respectively). Similarly, the AED demonstrated significant improvements in both the core and non-core food components (online Supplementary Table S2). Significant group by time differences were seen for the individual DGI components: variety scores, lean meat and alternative serves (which incorporated almond intake) and discretionary serves. In each of these components, scores increased for AED and worsened for NFD (Fig. 2; online Supplementary Table S2).
Absolute telomere length
Absolute TL are presented in Table 3. Over 12 weeks, there was a trivial but significant lengthening of telomeres in neutrophils (P = 0·009), a change that equated to a 9·6 bp increase in TL. A trivial but significant decrease in TL in whole blood was observed (12·1 bp shortening, P < 0·001). There was no significant change in the length of telomeres in lymphocytes (P = 0·783). There were no significant differences in TL between the intervention groups for any cell type or any group by time interactions for lymphocytes (P = 0·613), neutrophils (P = 0·281) or whole blood (P = 0·146).
Table 3 Effect of intervention on week 0 and week 12 telomere lengths in lymphocytes, neutrophils and whole blood*
(Standard errors of the mean)
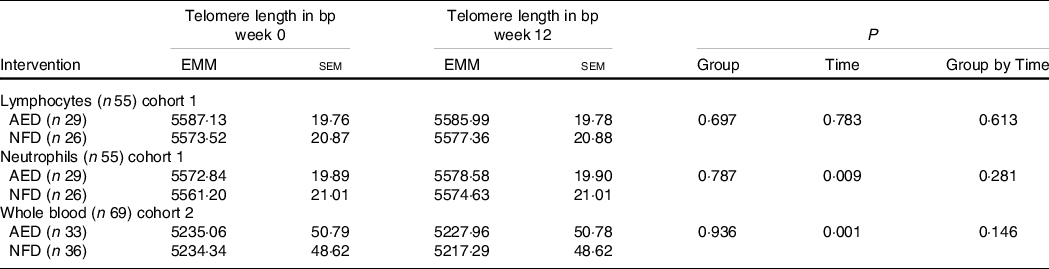
EMM, estimated marginal means; AED, almond-enriched diet; NFD, nut-free diet.
* Covariates in the model were age, sex and BMI. Statistical significance P < 0·05.
Effect of change in diet quality on change in telomere length
There was no relationship between change in diet quality scores (total DGI score) and change in lymphocyte, neutrophil or whole blood TL with 12 weeks intervention (data not shown). Adjusting the model for age, sex and BMI did not change the results. No significant relationships were observed for percentage change in TL and diet quality relative to baseline values over 12 weeks (data not shown).
Discussion
Our analysis showed that there were no baseline associations between diet quality and TL in a sample of mid-age to older Australian adults enrolled in a dietary intervention trial. After 12 weeks, diet quality scores improved in participants consuming an AED. Trivial lengthening of telomeres was observed at 12 weeks in neutrophils, while shortening of telomeres occurred in whole blood. The changes in TL however did not differ between dietary intervention groups and were not associated with the observed changes in diet quality.
Differentiating the components of the DGI allowed for the effects of dietary substitution to be analysed within the intervention trial. Participants in each group were advised to incorporate test snack foods by reducing discretionary food/beverage consumption, with the goal that participants remained weight stable. Factors driving improvement in diet quality for the AED were higher scores for the lean meat and alternatives component (which captured almond intake in line with the Australian Dietary Guidelines), and higher scores, reflecting lower intake, for the discretionary component(63). Conversely, lower scores for the variety and discretionary components drove lower overall diet quality scores for the NFD group. Diet quality, however, remained poor across both groups, with the majority of participants failing to meet half the maximum score and changes in diet quality scores were not associated with changes in TL.
Comparison with other studies
To date, only one previous study has investigated the relationship between diet quality determined via the DGI and TL as measured in whole blood(Reference Milte, Russell and Ball68). A cross-sectional analysis of data collected from 679 Australian adults aged 57–68 years determined that a higher quality diet (measured by the DGI-2013, Mediterranean Diet Score and Recommended Food Score) was not associated with longer relative leukocyte TL. They observed longer relative TL in women than men, but TL did not differ by age, BMI, smoking status or physical activity level(Reference Milte, Russell and Ball68).
Other cross-sectional analyses of diet quality, based on national dietary guidelines or dietary patterns, and TL have presented equivocal findings(Reference Galiè, Canudas and Muralidharan24). Most recently, in an analysis of 1981 older Chinese adults (65 years and over), scores derived from a range of dietary indices were not associated with leukocyte TL in age, and sex adjusted, or multivariate adjusted models. Investigators scored dietary patterns using the Diet Quality Index-International score, the Dietary Approaches to Stop Hypertension score, the Mediterranean Diet Score, the Mediterranean-Dietary Approaches to Stop Hypertension Intervention for Neurodegenerative Delay score, the Hong Kong diet pattern score and the Okinawan diet score, as well as three dietary patterns derived from factor analysis(Reference Chan, Leung and Tang69). Similarly, in ninety-six American adults, diet quality, as measured by adherence to the American dietary guidelines Healthy Eating Index-2015 or to the Mediterranean diet, was not associated with relative TL(Reference Ventura Marra, Drazba and Holásková70). Within their study however, participants identified as being at ‘nutritional risk’ based on a Dietary Screening Tool were more likely to have shorter relative TL(Reference Ventura Marra, Drazba and Holásková70). Furthermore, no associations were seen between higher diet quality scores and leukocyte TL in an Asklepion (Belgium) population of 2509 healthy middle-aged men and women(Reference De Meyer, Bekaert and De Buyzere71). Conversely, Ojeda-Rodriguez et al. (Reference Ojeda-Rodriguez, Zazpe and Alonso-Pedrero72) measuring TL from salivary samples recently reported that higher diet quality scores, measured using five evidence-based indices, were associated with a lower risk of shorter telomeres in 886 mid-age to older (> 55 years) Spanish adults.
The cross-sectional nature of most analyses of diet quality may be limited by inherent inter-individual variations in TL. TL is largely genetically determined, with differences arising from initial zygote TL at birth(Reference Demanelis, Jasmine and Chen73–Reference Graakjaer, Pascoe and Der-Sarkissian75), influenced by sex and race/ethnicity(Reference Demanelis, Jasmine and Chen73,Reference Factor-Litvak, Susser and Kezios76,Reference Hunt, Chen and Gardner77) . Previous studies assessing relationships between diet quality and TL have reported sex differences(Reference Sun, Shi and Prescott2,Reference Crous-Bou, Fung and Prescott25,Reference Milte, Russell and Ball68,Reference Leung, Fung and McEvoy78) . Our investigation adjusted for sex in the analyses, however, did not consider men and women separately due to the small sample size, and the fact that there were no sex differences in TL at baseline. Women have been repeatedly shown to have better diet quality scores(Reference McNaughton, Ball and Crawford34,Reference Ward, Coates and Hill62,Reference Wirfalt, Drake and Wallstrom79,Reference Thorpe, Milte and Crawford80) , as well as longer telomeres than men, potentially related to premenopausal oestrogen levels(Reference Milte, Russell and Ball68,Reference De Meyer, Bekaert and De Buyzere71,Reference Barrett and Richardson81,Reference Dalgard, Benetos and Verhulst82) . Although menopausal status was not captured, participants in our study were aged over 50, and the potential beneficial effects of this were therefore likely to have diminished. Of note, a recent analysis reported only a weak association between sex and relative TL across twenty-four tissue types (including whole blood)(Reference Demanelis, Jasmine and Chen73). Supporting the well-established age-related loss of TL reported in other studies, a moderate correlation between age and TL was observed in all samples(Reference Lopez-Otin, Blasco and Partridge14,Reference McHugh and Gil15,Reference Demanelis, Jasmine and Chen73,Reference Jylhava, Pedersen and Hagg83) .
Outcomes from longitudinal studies investigating predominantly antioxidant and anti-inflammatory dietary patterns and telomeres have provided equivocal results to date. In the PREDIMED-NAVARRA study, baseline scores assessing adherence to the Mediterranean diet were associated with longer telomeres in women, but not men. However, at 5-year follow-up, adherence to the Mediterranean dietary pattern was not associated with reduced telomere attrition(Reference Garcia-Calzon, Martinez-Gonzalez and Razquin36). Of significance, the intervention arm supplemented with nuts saw an unexpected higher rate of telomere shortening(Reference Garcia-Calzon, Martinez-Gonzalez and Razquin36). Conversely, in the same cohort, diet assessed to be anti-inflammatory by the Dietary Inflammatory Index was associated with longer telomeres at baseline and with reduced telomere attrition at 5 years(Reference Garcia-Calzon, Zalba and Ruiz-Canela37). More recently, baseline diet quality in a Finnish population, assessed through compliance to a Baltic Diet (Baltic sea diet score), Mediterranean diet (modified Mediterranean diet score (mMED)) or Dietary Inflammatory Index, was not associated with leucocyte TL at 10 years, except in women where, contrasting with previous studies, greater leucocyte telomere attrition was observed in association with higher mMED scores(Reference Meinila, Perala and Kautiainen39). An earlier investigation of dietary patterns measured 10 years previously showed that a prudent dietary pattern characterised by higher consumption of vegetables, legumes, wholegrains, fish, seafood, seaweed and nuts was positively associated with longer telomeres in a Korean population(Reference Lee, Jun and Yoon38).
The link between the consumption of nuts and TL has been expressly investigated in observational studies. Where, in a cohort of 5582 adults from the National Health and Nutrition Examination Survey, higher consumption of nuts and seeds was positively associated with longer telomeres(Reference Tucker42). Similarly, higher intakes of nuts along with legumes, and fish were associated with longer leucocyte TL in a Chinese cohort with varying levels of glucose tolerance(Reference Zhou, Zhu and Cui84). Cross-sectional studies in female nurses(Reference Crous-Bou, Fung and Prescott25), and two multi-ethnic cohorts from America(Reference Nettleton, Diez-Roux and Jenny85,Reference Gu, Honig and Schupf86) , older Chinese adults(Reference Chan, Woo and Suen87) and Iranian men aged 25–40 years(Reference Karimi, Nabizadeh and Yunesian88), however, have reported no associations between the consumption of nuts with TL. The present study did not investigate specific food group associations with TL.
Cell types
This study enabled us to investigate bp TL differences between lymphocytes and neutrophils, as well as whole blood. Lengthening of telomeres in lymphocytes and neutrophils has previously been demonstrated with n-3 PUFA supplementation(Reference Barden, O’Callaghan and Burke29,Reference Kiecolt-Glaser, Epel and Belury30) . Kiecolt-Glaser et al. (Reference Kiecolt-Glaser, Epel and Belury30) investigated changes in lymphocyte TL in response to two doses of n-3 PUFA, or a placebo, similarly in mid-aged overweight and obese men and women over 4 months. Adjusting for baseline TL, mean change in TL was an increase of 50 bp for the high dose n-3 PUFA and 21 bp for the low dose. TL in the placebo group decreased by 43 bp. Differences between groups however were not significant. Barden et al. (Reference Barden, O’Callaghan and Burke29) demonstrated telomere lengthening in neutrophils (when adjusting for neutrophil cell count) with 8 weeks of n-3 PUFA supplementation; however, this study was performed in patients with chronic kidney disease(Reference Barden, O’Callaghan and Burke29).
Whole blood samples are often the preferred method for TL analysis, as it provides a high yield of high-quality DNA, is assumed to reflect the replicative potential of the immune system(Reference Blackburn, Epel and Lin6) and has been determined to be a suitable proxy for TL across tissue types(Reference Demanelis, Jasmine and Chen73). The whole blood sample, however, contains a mix of granulocyte, monocyte and lymphocyte subsets, each of which is very different in terms of telomerase activity, proliferation rate and TL(Reference Lin, Epel and Cheon89). Changes in TL in the whole blood sample may reflect changes in the proportion of these different cells within the sample. Interestingly, there were more factors associated with TL in the whole blood sample than the individual cells, where baseline associations with BMI, the MetS and physical activity were observed. This suggested that those with lower BMI and the MetS score had longer telomeres, while unexpectedly, higher levels of self-reported physical activity were associated with shorter telomeres. A limitation of this study was the variance in the processing of the samples which did not allow the comparison of TL between the individual cell types to whole blood in the same volunteer either at baseline or after 12-week intervention. The differing blood processing procedures in the two cohorts may have reduced our power to detect small between group differences in TL. Furthermore, as outlined by Wang et al. (Reference Wang, Savage and Alsaggaf90) calculating an absolute TL from qPCR T/S ratio using a conversion equation provides imprecise estimates of TL at the extremes of length; therefore, outcomes should be used with caution when these ranges of TL are used to make associations with disease states.
Isolating neutrophils and lymphocytes allowed variations in TL dynamics between these cell types to be investigated(Reference Barden, O’Callaghan and Burke29,Reference Lin, Epel and Cheon89,Reference Nussey, Baird and Barrett91) . Lymphocytes are a heterogeneous group of cells known to express telomerase on proliferation, enabling TL restoration(Reference Lin, Epel and Cheon89,Reference Weng92) . The increase in TL observed in neutrophils but not lymphocytes may be the consequence of true telomere lengthening, with addition of telomeric DNA repeats, mediated by telomerase, in haemopoietic stem cells. However, apparent lengthening through the redistribution of proportions of leukocyte subsets with a greater proportion of circulating neutrophils with longer telomeres should nevertheless be considered(Reference Lin, Smith and Esteves93,Reference Puterman, Weiss and Lin94) . Sampling errors and technical variations in telomere measurement by qPCR also need consideration(Reference Wang, Savage and Alsaggaf90,Reference Nussey, Baird and Barrett91,Reference Lin, Smith and Esteves93) . Intra-assay CV was 0·85 % and inter-plate CV for telomeres in this study was 3·0 %. The degree of CV would mean that the significant increase or decrease in TL seen in neutrophils and whole blood samples, respectively, could be a result of this variation, rather than a true difference. The high variance (standard error) in TL measures additionally suggests inter-individual variation, potentially limiting the clinical significance of the results.
There are several strengths of the study, including the longitudinal design of the study. The study also included the evaluation of diet quality from dietary data captured by gold standard 3-d WFR(Reference Johnson95). Furthermore, the DGI was sensitive to detecting changes in diet quality through the incorporation of snack foods of differing nutrient profiles. Previous studies have typically relied either on FFQ or 24-h recall data to establish dietary intake and diet quality. FFQ relies on memory and is biased to over-reporting fruit and vegetable intake(Reference Steinemann, Grize and Ziesemer96). However, it is acknowledged that all self-reported dietary data are biased to over-reporting of healthy foods and under-reporting of discretionary choices and overall intake(Reference Hendrie, Baird and Golley97,Reference Subar, Freedman and Tooze98) .
There was no association between diet quality and TL at baseline. Diet is one of many factors identified as influencing TL. A limitation of the study was the overweight/obese status of participants, and high proportion of these was assessed as having the MetS(Reference Alberti, Eckel and Grundy55), which could influence underlying levels of inflammation and insulin resistance, potentially having a greater influence on telomere integrity than the impact of changing dietary patterns, as has previously been reported(Reference Cheng, Kao and Chang99,Reference Welendorf, Nicoletti and Pinhel100) . Obesity has been linked with accelerated telomere shortening, with inverse relationships seen between TL and measures of adiposity(Reference Garcia-Calzon, Gea and Razquin101–Reference Rode, Nordestgaard and Weischer103), and a negative correlation between obesity and TL reported in a 2015 meta-analysis(Reference Mundstock, Sarria and Zatti104). In the present study, an inverse association was observed between BMI and TL at baseline in the whole blood sample only, and as intended, participants’ BMI did not change during intervention.
Generalisability of results was limited by the study population, which was comparatively homogenous in regard to characteristics, such as ethnicity, socio-economic status, marital status, levels of education and participants were required to be non-smokers. Participants’ BMI, physical activity levels, sleep quality or quantity did not change over time or differ between the intervention groups. Thus, while the design of this study limited the exploration of external influences on TL, it did allow us to explore the impact of changing dietary exposure on TL while controlling for other lifestyle factors that may influence TL. A number of studies have reported no significant association between individual dietary factors and TL in adult populations. However, when considering the impact of overall healthy lifestyle patterns, significant associations with TL have been demonstrated(Reference Crous-Bou, Fung and Prescott25,Reference Mirabello, Huang and Wong105–Reference Puterman, Lin and Krauss107) . Mirabello et al. (Reference Mirabello, Huang and Wong105) assessed lifestyle factors individually; however, they found a sum score of healthier dietary patterns, in addition to favourable lifestyle factors such as not smoking, lower BMI and more physical activity, positively correlated with longer telomeres. At a 5-year follow-up study in men with low risk prostate cancer, lifestyle intervention was associated with an age-adjusted increase in TL(Reference Ornish, Lin and Chan106). In a sample of healthy postmenopausal woman, higher levels of healthy behaviours including diet, exercise and sleep had a protective effect on telomere shortening associated with life stressors experienced within a 1-year period(Reference Puterman, Lin and Krauss107). Future studies should consider that the combination of environmental, lifestyle, psychological, physiological as well as dietary factors may have more of an effect on TL than any single factor alone.
Conclusions
This study demonstrated that the relatively small changes in diet quality achieved over a 12-week period were not of sufficient magnitude to impact TL. The longitudinal analysis of TL in the different cell types will contribute to data on telomere dynamics; however, if TL reflects the burden of inflammation or oxidative stress from birth, or even earlier, through to adulthood, dietary influences need to be tracked longitudinally over several years or even decades.
Acknowledgements
The authors thank the study participants for their participation in the study. We thank the following for their assistance: Prof. Andrew Scholey, Dr Catherine Yandell, Mrs Louise Massie, Dr Kirsty Turner, Ms Samantha Morgillo, Ms Grainne Quirke, Ms Mary Cleary, Mr Paul Ruanne and Mr Paul Butler.
The research was funded by the Almond Board of California (2015–2016) and a University of South Australia Research Themes Investment Scheme Grant. J. L. M. was funded by an Australian Research Council Future Fellowship (Level 3; FT170100431). Funding sources did not contribute to the design of the study, collection, analysis or interpretation of data or writing the manuscript.
Conceptualisation: A. M. C., A. M. H., J. D. B., S. B. and V. S. D.; methodology: A. M. C., A. M. H., J. D. B., S. B., J. L. M., S. L. H., V. S. D. and S. J. W.; quantitative PCR telomere length protocol and telomere length quantification: V. S. D.; quantitative PCR telomere length analysis: S. L. H. and S. J. W.; data preparation and statistical analysis: S. J. W.; writing – original draft preparation: S.J.W; writing – review and editing: A. M. C., A. M. H., J. D. B., S. B., J. L. M., S. L. H. and V. S. D. All authors read and approved the published version of the manuscript.
A. M. C. has consulted for Nuts for Life (an initiative of the Australian Tree Nut Industry). The funders had no role in the design of the study; in the collection, analyses, or interpretation of data; in the writing of the manuscript, or in the decision to publish the results.
Supplementary material
For supplementary materials referred to in this article, please visit https://doi.org/10.1017/S0007114521001549


