The prevalence of morbid obesity continues to be a major health threat to humans, as a result of which the WHO has termed obesity as alarming ‘globesity’. In previous studies on rodents fed with obesogenic oils(Reference Ikemoto, Takahashi and Tsunoda1, Reference Stachon, Furstenberg and Gromadzka-Ostrowska2), highly unsaturated soyabean oil (84·4 g unsaturated fatty acids/100 g total fatty acids) and sunflower oil (89·7 g unsaturated fatty acids/100 g total fatty acids) have been shown to result in a higher body fat content compared with palm oil and lard. Yet, this observation is not parallel with those of other studies that have used broiler chicken(Reference Sanz, Lopez-Bote and Menoyo3, Reference Newman, Bryden and Fleck4) and rat(Reference Shimomura, Tamura and Suzuki5, Reference Matsuo, Takeuchi and Suzuki6) models, in which it has been reported that sunflower oil significantly lowers fat accumulation when compared with beef tallow. On the other hand, the accumulation of fats in subcutaneous and visceral adipose tissues is highest in mice fed with a lard-enriched diet compared with those fed with diets fortified with olive, rapeseed and sunflower oils(Reference Catta-Preta, Martins and Brunini7). Generally, the intake of saturated fats has been perceived to exert deleterious effects on body fat deposition. Nonetheless, cocoa butter, a saturated fat, which has 63 g SFA/100 g total fatty acids, has been reported to prevent weight gain when compared with olive oil and safflower oil due to the presence of high amounts of palmitic and stearic acids(Reference Timmers, de Vogel-van den Bosch and de Wit8).
Based on the types of fatty acids present, SFA is responsible for higher rates of weight gain(Reference Larson, Hunter and Williams9), whereas PUFA, such as linoleic acid, do not induce obesity in C57BL/6J mice(Reference Ikemoto, Takahashi and Tsunoda1). Excessive intake of MUFA has deleterious effects that are similar to those caused by the intake of a diet rich in SFA(Reference Catta-Preta, Martins and Brunini7). A recent study has shown that there is a positive correlation between carcass fat content in rats and palmitic, stearic and oleic acids, and a negative correlation for linoleic acid(Reference Matsuo, Takeuchi and Suzuki6). The issue of the effect of n-6 PUFA, in particular linoleic acid, on obesity is controversial. In recent studies, linoleic acid has been shown to exert pro-obesity effects using rodents(Reference Stachon, Furstenberg and Gromadzka-Ostrowska2, Reference Jen, Buison and Pellizzon10); however, Matsuo et al. (Reference Matsuo, Takeuchi and Suzuki6) postulated n-6 PUFA to be the most effective fatty acids in limiting the deposition of fats. A recent review article by Czernichow et al. (Reference Czernichow, Thomas and Bruckert11) has stated that the role of n-6 PUFA in obesity remains unclear as no conclusive inference can be drawn from the available epidemiological evidence. Although n-3 PUFA(Reference Okuno, Kajiwara and Imai12, Reference Micallef, Munro and Phang13) have been claimed to reduce fat deposition, no conclusive results could be obtained by a recent systematic review of the evaluation of the effect of n-3 PUFA on body weight(Reference Martinez-Victoria and Yago14).
There is no consistent inference that can be drawn from the relationship between TAG and obesity as most researchers have focused mainly on establishing the correlation between different dietary fatty acids or fats and distinct saturation levels. The effects of different levels of fat or the types of fats in the diet have been compared. Little attention has been paid to the effect of different rates of fat absorption due to the different positional distribution of fatty acids in TAG. Fatty acids at different sn-positions might not be subjected to the same rate of absorption. An individual consuming oils and fats is not only affected by the fatty acids, or saturation as a whole, but also by the chemical nature of TAG(Reference Ong and Goh15). The positional distribution of fatty acids in the glycerol backbone is the key determinant of fat digestion and absorption(Reference Ong and Goh15, Reference Small16). A fatty acid at the sn-2 position is absorbed in the form of monoacylglycerols through intestinal mucosa after the action of 1, 3-specific pancreatic lipase and those that are esterified at the sn-1, 3 positions are absorbed as NEFA(Reference Small16, Reference Kayden, Senior and Mattson17). Prior literature has revealed that long-chain saturated NEFA suffer delayed absorption by virtue of the formation of Ca or Mg soaps(Reference Brink, Haddeman and de Fouw18–Reference Innis, Dyer and Lien20). This has led us to investigate the effect of positional fatty acid profile on fat deposition and obesity, using refined, bleached and deodorised palm olein (POo), chemically interesterified POo (IPOo) and refined, bleached and deodorised soyabean oil (SOY), which differ in the degree of fatty acid saturation levels at the sn-1, 3 positions.
Experimental methods
Diets
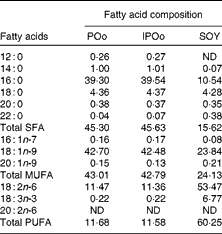
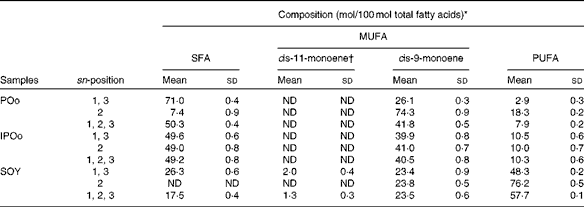
POo of iodine value 56 was provided by Intercontinental Specialty Fats Sdn. Bhd. Chemically interesterified palm olein (IPOo, iodine value 56) was prepared from POo using sodium methoxide as a catalyst(Reference Lo and Handel21). SOY was a generous gift from Soon Soon Oil Mills Sdn. Bhd. An autoclavable standard pellet feed (digestible energy 14·0 MJ/kg) was purchased from Specialty Feeds. It was used as a diet for the control group without further fortification, whereas the other three test diets were fortified with POo, IPOo and SOY at an oil composition of 150 g/kg diet (Tables S1–S4, available online). All test diets were isoenergetic (20 MJ/kg). The total fatty acid composition and positional fatty acids at the sn-1, 3 and sn-2 positions of the test oils are given in Tables 1 and 2, respectively. The diets were prepared manually in the laboratory by mixing the pulverised standard diet pellets thoroughly with the test oils and thereafter pelleted to the original size and shape. The diets were then left to dry at 30°C in an oven overnight and stored at 4°C until use.
Table 1 Total fatty acid composition of the dietary oils and fats (g/100 g total fatty acids)
POo, palm olein; IPOo, chemically interesterified POo; SOY, soyabean oil; ND, not detected.
Table 2 Positional fatty acid composition (mol/100 mol total fatty acids) of the dietary oils (Mean values and standard deviations)
POo, palm olein; ND, not detected; IPOo, chemically interesterified POo; SOY, soyabean oil.
* 13C NMR results are the mean of three replicates.
† cis-11-monoene mainly consists of cis-vaccenic acid (18 : 1n-7)(Reference Gouk, Cheng and Ong24).
Animal experiments
A total of thirty-two weaned male C57BL/6 mice (Monash University, Selangor, Malaysia) were randomly distributed into four groups of eight each and caged individually. The average body masses of the mice did not differ significantly after randomisation (P= 0·945), while they were 17·4 (sd 0·9), 17·9 (sd 1·0), 17·3 (sd 1·4) and 17·5 (sd 1·0 ) g when fed with the control, POo, IPOo and SOY diets, respectively. The animals were kept in rooms with adequate ventilation at 23 ± 2°C and a relative humidity of 60 % with a 12 h light–12 h dark cycle. They were given ad libitum access to food and water.
The consumption of food and water was determined on a daily basis, whereas the body mass of the mice was recorded weekly. The actual food intake was corrected for spilled food after separation from the faeces of the mice. Fresh faeces were collected daily, pooled and stored at − 20°C for faecal analysis, starting from week 3 until week 15. At the end of the study, mice were killed by dislocation of the neck. Subsequently, the subcutaneous and visceral fats were removed, weighed and kept frozen at − 80°C. All protocols for the mouse experiments were approved by the Animal Care and Use Committee, Faculty of Medicine, University of Malaya, Kuala Lumpur, Malaysia (ethic no: KIM/23/03/2011/CSF (R)).
Faecal lipids
The extraction of fatty acids from faeces was carried out by using a modified method(Reference Folch, Lees and Sloane Stanley22). Briefly, 300 mg of faeces were extracted with 15 ml of chloroform–methanol (2:1, v/v) containing 10 parts per million of butylated hydroxytoluene. After overnight extraction, the solution was filtered and mixed with 4 ml of 0·9 % NaCl. It was then shaken and left overnight at 4°C to remove aqueous impurities. The lower phase containing lipids was evaporated under reduced pressure on the next day and then methylated to form fatty acid methyl esters by acid-catalysed transesterification for fatty acid composition analysis(Reference Christie23). The ratio of the composition of NEFA in the faeces to the composition of the individual fatty acids in the dietary oils (Table 1) was computed to represent the excretion index of each fatty acid.
Lipid analysis
The test oils and the NEFA extracted from the faeces were derivatised to fatty acid methyl esters by sodium methoxide-catalysed and sulphuric acid-catalysed transesterification, respectively(Reference Christie23). A methyl ester sample (1 μl) was injected into a GC (GC-2010A series; Shidmadzu) equipped with a flame ionisation detector and a BPX70 capillary column of 30 m × 0·32 mm inner diameter. An initial temperature of 140°C was held for 2 min and subsequently was increased to 220°C at a rate of 8°C/min. The column was held at the final temperature for 5 min. The oven, injector and detector ports were set at 140, 240 and 260°C, respectively. Helium was used as the carrier gas with the column flow rate being 1·10 ml/min at a 50:1 split ratio.
Regiospecific analysis of the test oils was conducted as described previously(Reference Gouk, Cheng and Ong24). 13C NMR measurements were performed using a JEOL ECA-400 MHz NMR spectrometer (JEOL Ltd) operating at 9·4 T. Manual shimming was employed. A spectral width of 1500 Hz at which the acyl chain carbonyl carbons resonate, 8192 data points and 90° pulse excitation were applied. The experimental temperature was set at 298·15 K, whereas a repetition time of 34·5 s was chosen. The total number of scans per analysis was 128. Deconvolution was used as the integration method to separate the overlapped peak and calculate its area.
Statistical analysis
Data were subjected to IBM SPSS Statistic 20 (SPSS Inc.) for the statistical analysis. The significance level of differences among the dietary groups was assessed by one-way ANOVA. When significant differences were found, pairwise comparisons between groups were carried out by Fisher's least significant difference test, with one common standard error of the differences between means (sed) as the component for comparison. The accepted level of significance was P< 0·05.
Results
Food consumption, body mass gain and body mass gain per g feed
Throughout the 15 weeks (Table 3), all mouse groups, except the control group, showed comparable food consumption. Mice fed with the control diet, lacking fortified oils, served as the baseline for comparison. Different dietary oils exerted a similar effect on body mass gain and feed efficiency (body mass gain per g feed consumed). Food consumption and body mass gain at each week throughout the experimental period are given in Tables S1–S4 (available online).
Table 3 Different responses induced by various dietary oils in C57BL/6 mice over a 15-week experimental period (Mean values with their standard errors)

POo, palm olein; IPOo, chemically interesterified POo; SOY, soyabean oil.
a,b,c,dMean values within a row with unlike superscript letters are significantly different (P< 0·05).
* P values were determined by one-way ANOVA.
† Food consumption was calculated as the total food intake for each mouse in 15 weeks and then averaged for each group (n 8).
Fat deposited
Mice receiving the SOY-enriched diet gained a significantly higher mass of subcutaneous fat (P= 0·011) and total fat (P= 0·013) compared with the POo group (Table 3). The IPOo group exhibited a non-significant difference in terms of fat deposition compared with the SOY and POo groups. The fat-free masses of mice were not significantly different among the POo, IPOo and SOY dietary groups.
The mass of total fat deposited was further subjected to normalisation with total food consumption, denoted as fat:feed, to eliminate the effects of fat intake per se. Visceral fat:feed of mice fed with the POo-enriched diet was significantly lower (P= 0·044) than that of those fed with the SOY-enriched diet (Table 3), whereas no difference was found when compared with the IPOo group. In the context of total fat:feed, all groups differed significantly (P= 0·012; Table 3). Significantly higher subcutaneous fat:feed (P= 0·006) and total fat:feed (P= 0·003) were observed in the SOY group when compared with mice fed with the POo-enriched diet. It is noteworthy that chemical interesterification was associated with higher subcutaneous fat:feed and total fat:feed (P= 0·049 and 0·013, respectively) as exhibited by mice fed with the IPOo-enriched diet when compared with those fed with the POo-enriched diet (Table 3). A negative linear correlation was observed between fat:feed and SFA content (mainly 16 : 0 and 18 : 0) at the sn-1, 3 positions (Fig. 1(a)), while a positive linear correlation was found between fat:feed and the total unsaturated fatty acid content at the same positions (Fig. 1(b)). The correlation coefficients, r, fell in the range of 0·9076–0·9686. On the contrary, poor regressions were found for MUFA (r 0·1830–0·3578; Fig. 2(a)) and PUFA (r 0·7142–0·8289; Fig. 2(b)).
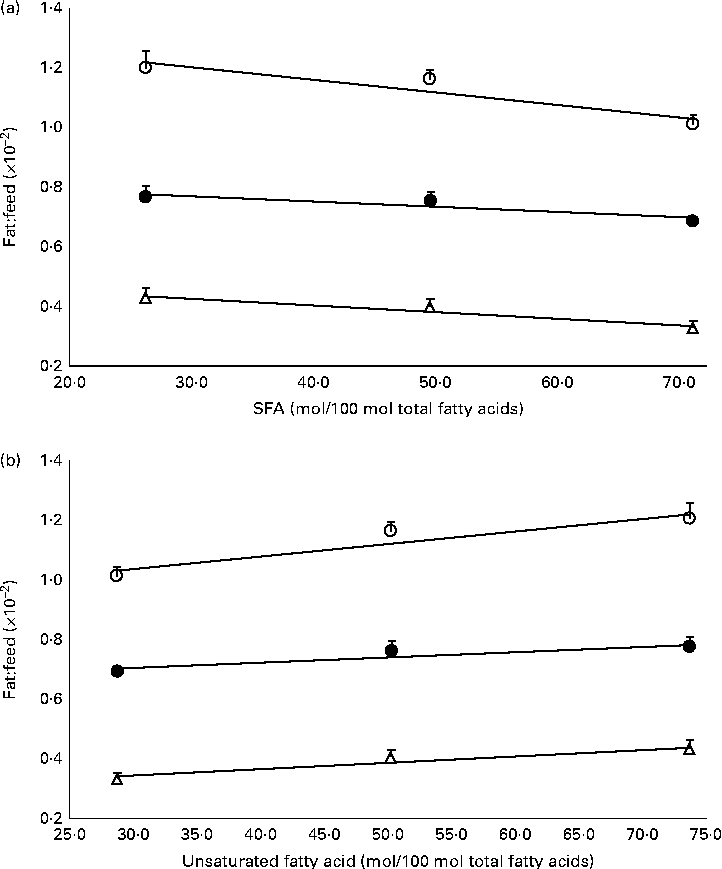
Fig. 1 Effect of total saturation levels at the sn-1, 3 positions of TAG on fat deposition (mass of fat deposited:total feed consumed). Total fat:feed (○, n 8), visceral fat:feed (●, n 8) and subcutaneous fat:feed (Δ, n 8) varied with (a) total SFA composition and (b) total unsaturated fatty acid composition at the sn-1, 3 positions. Values are means, with their standard errors represented by vertical bars. Correlation coefficients with P values < 0·05 were considered as significant. Total fat:feed: (a) y= − 0·0042x+1·3296, r= 0·9404, P= 0·038; (b) y= 0·0042x+0·9083, r= 0·9404, P= 0·058. Visceral fat:feed: (a) y= − 0·0018x+0·8267, r= 0·9076, P= 0·033; (b) y= 0·0018x+0·6497, r= 0·9076, P= 0·043. Subcutaneous fat:feed: (a) y= − 0·0022x+0·4955, r= 0·9686, P= 0·038; (b) y= 0·0022x+0·2732, r= 0·9686, P= 0·072.
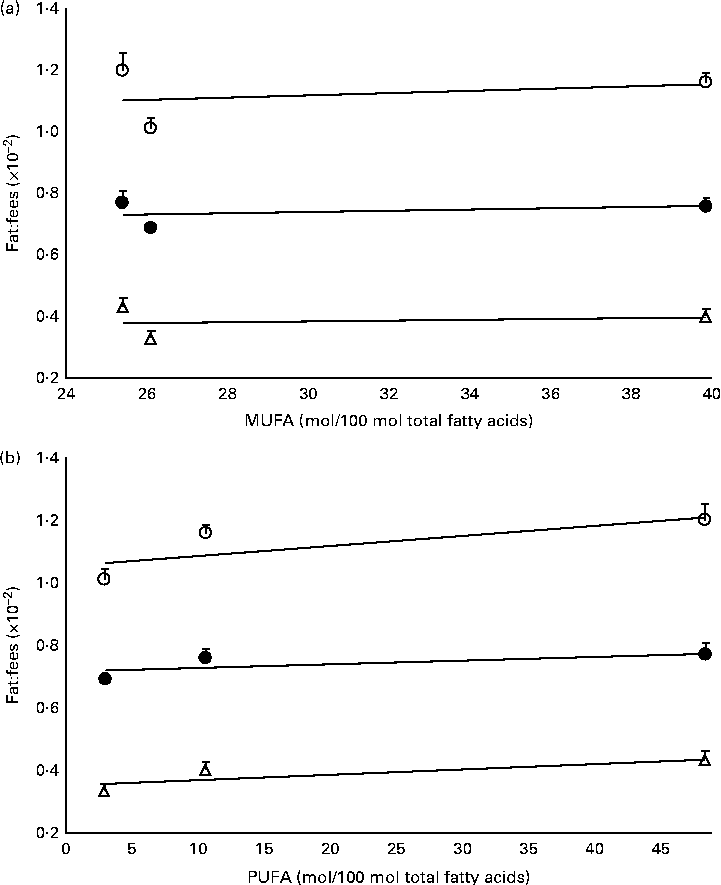
Fig. 2 Effect of different unsaturation levels at the sn-1, 3 positions of TAG on fat deposition (mass of fat deposited:total feed consumed). Total fat:feed (○, n 8), visceral fat:feed (●, n 8) and subcutaneous fat:feed (Δ, n 8) varied with (a) total MUFA composition and (b) total PUFA composition at the sn-1, 3 positions. Values are means, with their standard errors represented by vertical bars. Correlation coefficients with P values < 0·05 were considered as significant. Total fat:feed: (a) y= 0·0034x+1·0203, r= 0·2760, P= 0·822; (b) y= 0·0032x+1·058, r= 0·7717, P= 0·439. Visceral fat:feed: (a) y= 0·0019x+0·6819, r= 0·3578, P= 0·767; (b) y= 0·0013x+0·7137, r= 0·7142, P= 0·494. Subcutaneous fat:feed: (a) y= 0·0011x+0·3517, r= 0·1830, P= 0·883; (b) y= 0·0017x+0·3507, r= 0·8289, P= 0·378.
Faecal fatty acids
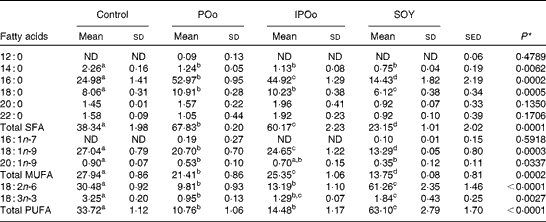
The composition of NEFA excreted in the faeces of mice in the present study is given in Table 4. The content of excreted linoleic acid (18 : 2n-6) was significantly higher in mice fed with the SOY-enriched diet compared with that in both the POo (P< 0·001) and IPOo (P< 0·001) groups. This finding was reflected in the total content of PUFA excreted by mice fed with the SOY-enriched diet, which accounted for 63·1 % of total fatty acids. It is important to note that the content of excreted α-linolenic acid (18 : 3n-3) in the faeces of the SOY group differed significantly from that in the faeces of mice fed with the POo-enriched diet (P= 0·023), but no difference was found in mice fed with the IPOo-enriched diet. Total excretion of MUFA and SFA was significantly lower in the SOY group in comparison with the POo (P= 0·001 and P< 0·001, respectively) and IPOo (P= 0·001 and P< 0·001, respectively) groups.
Table 4 Composition of NEFA (g/100 g total fatty acids) in the faeces of mice in each test group (Mean values and standard deviations)

POo, palm olein; IPOo, chemically interesterified POo; SOY, soyabean oil; ND, not detected.
a,b,c,dMean values within a row with unlike superscript letters are significantly different (P< 0·05).
* P values were determined by one-way ANOVA.
Despite being fed with diets of an identical total fatty acid composition, mice fed with the POo-enriched diet excreted higher amounts of SFA (P= 0·019) compared with mice fed with the IPOo-enriched diet. The composition of 16 : 0 was higher (P= 0·021) in the POo group, but no significant difference was found for the 18 : 0 content. In contrast, there was a substantially higher amount (P= 0·008) of MUFA, which mainly consisted of 18 : 1n-9, being excreted by mice fed with the IPOo-enriched diet compared with the POo group. Such increment was also observed for PUFA excretion in the IPOo group, but the difference was not significant. The absolute amount of NEFA in the faeces of mice from the different dietary groups is given in Tables S1–S4 (available online).
Table 5 shows that mice fed with the POo-enriched diet had greater excretion indices of both major SFA (1·35 for 16 : 0 and 2·50 for 18 : 0) in comparison with the IPOo group (1·14 for 16 : 0 and 2·34 for 18 : 0). This trend was reflected in the excretion index of total SFA (1·50 for POo and 1·32 for IPOo). It is interesting to note that the excretion of SFA with a longer chain length was greater than that of those with a shorter chain length. On the other hand, within a similar pairwise comparison, the IPOo group showed a concomitant increase in the excretion indices of total MUFA (18·0 % greater) and PUFA (35·9 % greater). Generally, the rate of fatty acid excretion for all the dietary oils is in the following order: SFA>PUFA>MUFA.
Table 5 Excretion indices of each fatty acid in the faeces of mice in the different dietary groups
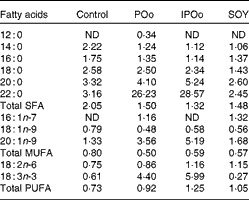
POo, palm olein; IPOo, chemically interesterified POo; SOY, soyabean oil; ND, not detected.
Discussion
The present study shows that the fatty acid composition at the sn-1, 3 positions of the TAG molecule influences body fat accretion in C57BL/6 mice. If long-chain SFA (16 : 0 and above) are present at the sn-1, 3 positions, they tend to alleviate fat deposition, whereas they have no effect if present at the sn-2 position. In the duration of 15 weeks, mice from all the experimental groups (POo, IPOo and SOY) gained significantly higher fat and fat-free masses compared with the control group by virtue of the presence of fortified oils in their diets. The differences between the three experimental groups and the control group were more pronounced than the differences among the three experimental groups. It appears that the higher energy density in the test diets accounted for the remarkable changes in body composition. The total food consumption of all mice did not show any discrepancy, and all the test oils exerted the same effect on the hunger and appetite of mice. The differences in body mass gain were insignificant across all the test groups, even after normalisation with food consumption (gain:feed) (Table 3). On the other hand, it was found that the different test oils had resulted in fat deposition to different extents in the subcutaneous and visceral tissues as well as total fat:feed (Table 3). Hence, the present study shows that body mass gain and fat deposition do not necessarily occur in tandem, and this clarifies the previous studies(Reference Ikemoto, Takahashi and Tsunoda1, Reference Timmers, de Vogel-van den Bosch and de Wit8), which used body mass gain as the marker for obesity. We, therefore, focused on normalisation data (Table 3), namely fat:feed, in the present evaluation of diet-induced adipogenic oils. As a whole, in the context of obesity risk factor, the present study shows that the SOY- and IPOo-enriched diets exhibit a higher potential towards obesity risk compared with a POo-enriched diet.
Feeding of the SOY-enriched diet (17·5 mol SFA/100 mol total fatty acids) for 15 weeks induced significantly higher fat deposition when compared with that of the POo-enriched diet (50·3 mol SFA/100 mol total fatty acids), which is in agreement with previous reports that have compared both(Reference Stachon, Furstenberg and Gromadzka-Ostrowska2, Reference Jen, Buison and Pellizzon10). However, this contradicts the reports(Reference Sanz, Lopez-Bote and Menoyo3–Reference Matsuo, Takeuchi and Suzuki6) that have generalised that any increase in fat deposition is correlated with the amount of saturation in the oil; that is, an oil with a higher saturation content results in more fat deposition when compared with a lower saturated (or higher unsaturated) oil, based on studies that have used sunflower oil and beef tallow. This inconsistency can be elucidated by looking at the positional distribution of SFA in the oils being studied. Beef tallow contains about 33·6 g SFA/100 g and 79·4 g SFA/100 g total fatty acids at the sn-1, 3 and sn-2 positions, respectively(Reference Gunstone, Harwood, Gunstone, Harwood and Dijkstra25), while POo used in the present study contains 71·0 mol SFA/100 mol total fatty acids at the sn-1, 3 positions and 7·4 mol SFA/100 mol total fatty acids at the sn-2 position (Table 2). Based on the present study, we postulate that if higher amounts of long-chain SFA are present at the sn-1, 3 positions, they tend to alleviate fat deposition.
By investigating the types of fat deposition, we found that the SOY-enriched diet resulted in a significantly higher deposition of visceral fat:feed compared with the POo-enriched diet (Table 3). This significant difference, which may provide some prospective benefits in getting a healthy diet as visceral adiposity is associated with various health problems, including CVD, insulin resistance, hypertension, breast and endometrial cancers, and overall mortality(Reference Emery, Schmid and Kahn26, Reference Kim, Jang and Son27), should be confirmed in future clinical trials.
It was noted that the differences in fat deposition were significant between the POo and SOY groups, but not in the pairwise comparison between the IPOo and SOY groups (Table 3). Despite identical total saturation and unsaturation levels, mice fed with the IPOo-enriched diet gained 14·3 % more fat per food consumed compared with the POo group. As shown in Table 2, the saturated content at the sn-1, 3 positions in POo was 21·4 mol% higher than that in IPOo. This observation supported our postulation that a lower SFA content at the sn-1, 3 positions in IPOo was responsible for the higher fat absorption, TAG resynthesis in chylomicrons and eventually deposition in the mice. Mostly free SFA that deacylated from the sn-1, 3 positions of POo suffered delayed absorption and formed Ca soaps and then subsequently were excreted from the body as suggested previously(Reference Mattson, Nolen and Webb19, Reference Innis, Dyer and Lien20). This is further supported by the greater excretion indices of palmitic and stearic acids in the faeces of mice fed with the POo-enriched diet, which are 18·4 and 6·8 %, respectively, which are higher than those of the acids in the faeces of mice fed with the IPOo-enriched diet (Table 5), and this is consistent with the trend reported by other researchers(Reference Brink, Haddeman and de Fouw18). Furthermore, encouraging reductions in subcutaneous and total fat deposition in mice fed with the POo-enriched diet when compared with those fed with the IPOo-enriched diet were observed, despite their comparable total fatty acid compositions. This has never been disclosed and might possess the potential to surpass previous studies(Reference Ikemoto, Takahashi and Tsunoda1–Reference Jen, Buison and Pellizzon10), which have investigated the adipogenic effect of oils merely based on total SFA, MUFA or PUFA contents.
According to reported data(Reference Small16, Reference Brink, Haddeman and de Fouw18Reference Mattson, Nolen and Webb19), after the action of pancreatic lipase, long-chain SFA that are liberated from the sn-1, 3 positions are poorly absorbed and subsequently excreted in the form of Ca or Mg NEFA salts. This was further proven in the present investigation. When the fatty acids in the faeces were normalised with their respective composition in the ingested fats (Table 5), an interesting trend was observed for total SFA, PUFA and MUFA. All the excretion indices were somewhat similar regardless of the type of ingested fats. Major MUFA, namely oleic acid, were found to be less readily excreted as they were well absorbed in the intestine. In contrast, the relative compositions of all types of SFA in the faeces were greater than those of the corresponding fatty acids in dietary fats. For efficient absorption, micelles formed by the bile salts take up the non-polar NEFA to permit their transport across the aqueous boundary layer of the intestinal wall. Thus, long-chain SFA, which are relatively more non-polar than unsaturated fatty acids, have been observed to be less susceptible to intestinal absorption. The susceptibility of fatty acids to absorption in the intestine in an increasing order is as follows: SFA; PUFA; lastly the most absorbed MUFA.
Using our postulation, several previous contradicted reports can be further generalised and elucidated. Conventional saturated fats, namely palm oil(Reference Ikemoto, Takahashi and Tsunoda1) and cocoa butter(Reference Timmers, de Vogel-van den Bosch and de Wit8), v. beef tallow(Reference Sanz, Lopez-Bote and Menoyo3–Reference Matsuo, Takeuchi and Suzuki6, Reference Larson, Hunter and Williams9) and lard(Reference Catta-Preta, Martins and Brunini7) have been reported to exert diverse adipogenic effects. Palm oil and cocoa butter, which have been found to be less obesogenic, contain SFA mainly at the sn-1, 3 positions, whereas major SFA are present at the sn-2 position of the TAG moiety in beef tallow and lard(Reference Gunstone, Harwood, Gunstone, Harwood and Dijkstra25). Thus, the positive correlation between SFA composition and carcass fat content found in a previous study, which used beef tallow as the sole major source of SFA(Reference Matsuo, Takeuchi and Suzuki6), might not be valid as a similar investigation is being conducted on cocoa butter. On the other hand, excessive intake of MUFA has been reported to exert detrimental effects on fat deposition(Reference Catta-Preta, Martins and Brunini7), which can be correlated with the higher rate of absorption (lower rate of excretion) of MUFA found in the present study. From the perspective of positional fatty acids at the sn-1, 3 positions in the TAG molecule, a positive correlation was observed between total fat:feed and the unsaturated content, whereas a negative correlation was found between fat:feed and the total SFA content (Fig. 1). There was no relationship found between fat deposition and linoleic acid content in the present study (Fig. 2).
In addition, Ponnampalam et al. (Reference Ponnampalam, Lewandowski and Nesaratnam28) observed a slightly lower fat percentage (20·5 %) in piglets fed with a diet containing natural palm olein compared with those fed with a diet containing lard (21·2 %) and chemically interesterified palm olein (21·5 %). A recent study has also shown that the dietary 1(3)-behenoyl-2,3(1)-dioleoylglycerol, which contains long-chain saturated behenic acid (22 : 0) at the sn-1 or sn-3 position, prevents the deposition of visceral fat and hepatic TAG(Reference Kojima, Tachibana and Yamahira29). With no explicit reason being given previously, our postulation is expected to provide more insights into the effect of positional distribution of long-chain SFA on fat deposition.
On the other hand, the analysis on fatty acid composition of adipose tissue (data not shown) showed that there was a greater degree of fatty acid deposition for MUFA, followed by PUFA and lastly by SFA. This is in accordance with the excretion index of fatty acids, which is greatest for SFA, followed by PUFA and lowest for MUFA (Table 5). The deposited fatty acids are highly correlated with those absorbed through the intestine after the action of pancreatic lipase, which further elucidates the rate of absorption of different fatty acids and eventually the effect on fat deposition. Some minor fatty acids, particularly myristic (14 : 0) and palmitoleic (16 : 1n-7) acids, were found abundantly in both subcutaneous and visceral adipose tissues, suggesting de novo synthesis(Reference Perona, Portillo and Macarulla30).
In conclusion, we demonstrated that the positional distribution of long-chain SFA and not the total SFA content exerts a more profound effect on body fat accretion. If long-chain SFA (16 : 0 and above) are present at the sn-1, 3 positions, they tend to reduce fat deposition. Consequently, the amount of resynthesised TAG is reduced, affecting their incorporation in lipoproteins and subsequent metabolism, their distribution into tissues and eventually the extent of fat deposition. Due to the observation of greater excretion indices for a longer chain length, there might be a further alleviation of fat deposition if longer chains of SFA, for instance, 18 : 0, 20 : 0 and 22 : 0, are present mainly at the sn-1, 3 positions, and this warrants further investigation.
Supplementary material
To view the supplementary material for this article, please visit http://dx.doi.org/10.1017/S0007114513001475
Acknowledgements
The present study was supported by the Ministry of Higher Education Malaysia, through the Fundamental Research Grant Scheme (grant no. FP011/2010A). All authors were responsible for the design and execution of the study. S. W. G. performed the hands-on experiments, namely, the animal study, sample analyses and statistical analyses. S. W. G., S. F. C. and C. H. C. wrote the manuscript. J. S. L. M. and A. S. H. O. reviewed, read and approved the final version. The authors have no conflicts of interest to declare.


