


Type 2 diabetes and its related risk factors such as glucose intolerance and insulin resistance are an emerging public health problem worldwide( Reference Lam and LeRoith 1 ). Several lines of evidence have shown that undernutrition during early life accelerates the risk of impaired glucose tolerance and type 2 diabetes during adulthood( Reference Duque-Guimarães and Ozanne 2 ). In particular, the skeletal muscle has a lower priority for nutrient allocation during fetal development( Reference Giussani 3 ). When maternal nutrition is poor, the fetuses are adapted to forfeit skeletal muscle development, which is particularly vulnerable to maternal nutrient partitioning for the prioritisation of other very important tissues such as the brain, heart and liver( Reference Barker 4 ). These early forced adaptations persist later in life, leading to important negative physiological and metabolic consequences in the skeletal muscle, and consequently predispose the offspring to metabolic diseases in adulthood( Reference Latouche, Heywood and Henry 5 , Reference Lie, Morrison and Williams-Wyss 6 ).
Deregulation of glucose metabolism is considered as the leading cause for type 2 diabetes mellitus and glucose intolerance( Reference Samuel and Shulman 7 ). Skeletal muscle predominantly accounts for glucose disposal from the blood, and plays a central role in the sophisticated regulation of glucose homoeostasis( Reference Jornayvaz, Samuel and Shulman 8 ). Concretely, glucose uptake in the skeletal muscle is primarily mediated by GLUT-4( Reference Zorzano, Palacin and Guma 9 ), and glucose is then irreversibly phosphorylated to glucose-6-phosphate by hexokinase (HK)( Reference Vogt, Ardehali and Iozzo 10 ). Subsequently, glucose-6-phosphate can be channelled into either the glycolysis pathway catalysed by pyruvate kinase (PK) or the glycogen synthesis pathway catalysed by glycogen synthetase (GS)( Reference Kruszynska, Ciaraldi and Henry 11 ). Although the effects of poor nutrition during early life on the expressions of these limited enzymes or transporters in the skeletal muscle of the offspring are well reported in different species( Reference Liu 12 – Reference Gavete, Martín and Alvarez 17 ), all the studies have only examined the acute and short-term effects. It has been shown that because of intra-uterine malnutrition, the fetus is insulin-sensitive at birth and only develops insulin resistance well later in life( Reference Devaskar and Chu 18 , Reference Thorn, Rozance and Brown 19 ). This suggests that the long-term effects of maternal malnutrition on the onset of metabolic disease in the offspring are highly dependent on the accumulation of additional detrimental events that occur during the ageing process. However, little is known so far about the molecular mechanisms underlying the interaction between maternal diet and the ageing trajectory in muscle glucose metabolism.
There is increasing evidence that maternal malnutrition can result in permanent changes in fetal gene or protein expressions through epigenetic modulation, thereby leading to increased susceptibility to the related metabolic disease later in life( Reference Wang, Wu and Li 20 ). In particular, DNA methylation as an important regulatory factor of epigenetics usually occurs in gene-specific promoters and is closely associated with gene activity or silencing( Reference Jones 21 ). As glucose transport is the first rate-limiting step for glucose storage and utilisation in the skeletal muscle in most instances( Reference Kruszynska, Ciaraldi and Henry 11 ), GLUT4 should be considered as a target gene affected by maternal malnutrition to mediate fetal programming of muscle glucose metabolism. However, there are a limited number of studies demonstrating the effects of maternal nutrition on epigenetic modification of muscle GLUT4 in the offspring( Reference Zheng, Rollet and Pan 13 , Reference Raychaudhuri, Raychaudhuri and Thamotharan 22 ). Nevertheless, the existence and the mechanism of the dynamic interaction between these epigenetic changes and age-associated glucose intolerance are unknown.
Compared with rats, pigs are considered better models for nutritional and metabolic studies, because pigs are similar to humans in morphology, physiology, anatomy, metabolism and omnivorous habits( Reference Miller and Ullrey 23 , Reference Neeb, Edwards and Alloosh 24 ). It has been reported that pigs with low birth weight exhibit glucose tolerance and insulin resistance during adulthood( Reference Poore and Fowden 25 , Reference Poore and Fowden 26 ), suggesting that pigs can serve as ideal models to investigate the molecular mechanisms underlying the effects of maternal malnutrition on offspring glucose tolerance. Therefore, the pig was used as a model to answer two questions in this study: (1) to assess the impact of maternal dietary restriction on offspring glucose tolerance and gene expression related to glucose metabolism and insulin signalling in the muscle at different postnatal stages and (2) to assess whether maternal diet modifies age-associated methylation of the GLUT4 promoter.
Methods
Animal care and experimental design
Animal care and tissue collection were undertaken following the guidelines of the Animal Care and Use Committees at Sichuan Agricultural University. In total, twelve Landrace×Yorkshire gilts (body weight: 148·6 (sem 6·9) kg) were randomly assigned to the control (CON) and undernutrition (UN) groups (n 6). The gilts in the CON group were fed 1·0 maintenance requirements of nutrients (M), 1·2 M and 1·5 M diets/d during early gestation (day 1–30 of gestation), middle gestation (day 31–90 of gestation) and late gestation (day 91 of gestation to parturition), respectively, according to the recommendations of the National Research Council (NRC). The gilts in the UN group were provided 75 % of the feed intake of CON gilts at all stages of gestation, respectively. Dietary treatment started after artificial insemination at the fourth oestrus cycle, and the day of the last insemination was defined as day 1 of gestation. All the gilts used in the study were artificially inseminated three times on 2 consecutive days with fresh, pooled semen obtained from two pure Landrace boars, both of which were born of the same sow. After farrowing, the lactating sows in each group had ad libitum access to the same diets until weaning at day 28 of lactation. On postnatal days 1 and 28, six pigs with weights close to the average level (±10 %) of each litter were selected to be slaughtered. The remaining piglets were adjusted in order to maintain 10–12 pigs/litter in the same group within 24 h after farrowing. The nursing piglets were kept with their mother, offered creep food before weaning and were weaned at 28 d after parturition. At all stages, the gilts were housed individually in feed stalls and had free access to water; they were fed the same diets (online Supplementary Table S1) that were formulated to meet the NRC requirements. After weaning, sixteen (eight male and eight female) weaned piglets originating from six sows in each treatment were selected to be reared until day 189. All the piglets were reared individually following the standard feeding regimen with the starter, grower and finisher diets recommended for the breed. At postnatal day 189, eight pigs that reached mean body weight (sem10 %) from each litter were selected to be slaughtered.
Data and sample collection
After farrowing, pigs were weighed on day 1, 28, 68, 110, 152 and 189, and feed intake was recorded every day. On postnatal days 1 (dpn1), 28 (dpn28), 68, 110, 152 and 189 (dpn189), 10 ml of blood was collected from the pigs via the precaval vein in the morning between 07.00 and 08.00 hours before feeding. Serum was harvested by centrifuging the collection tubes at 3000 g for 10 min at 4°C, and the samples were frozen at −80°C until further analysis. The pigs were killed at birth, at weaning and in the adult (dpn189) stage; water was provided ad libitum, whereas the feed was removed from the hoppers at 12 h before slaughter. After slaughter, the longissimus dorsi muscle from the left side of the carcass was immediately collected and frozen in liquid N2.
Intravenous glucose tolerance test
At dpn188, after overnight food deprivation, an intravenous (i.v.) glucose tolerance test (GTT) was conducted according to the method described by Guan et al.( Reference Guan, Matte and Ku 27 ). Dextrose (500 g/l) was infused by ear venepuncture at a dose of 0·5 g/kg body weight and an infusion rate of 10 g glucose/min within 6 min. Blood samples were collected at −6, −4, −2 and 0 min relative to completion of dextrose infusion and at 5, 10, 15, 20, 30, 45, 60, 90 and 120 min after infusion. A drop of blood was placed on a test sensor for blood glucose evaluation using a portable Esprit glucometer (Bayer). In addition, glucose clearance rate (k, μmol/l×min) was calculated by the slope of loge glucose against time from 0 to 20 min after an i.v.GTT. The half-life (T1/2, min) of glucose was calculated using −0·693 divided by the clearance rate. The area under the blood glucose curve was integrated for each individual pig.
Biochemical parameter analysis
The concentrations of glucose, TAG and cholesterol were determined using commercially available kits (Jiancheng Bioengineering Institute) according to the manufacturer’s instructions by an automated biochemical analyser (Model 7020; Hitachi). Serum insulin concentration was measured using a commercial RIA kit (R&D Systems Europe Ltd).
Metabolites in the muscle
Skeletal muscle tissues were homogenised. The glycogen content of the muscle samples was determined as previously described by Rosenvold et al.( Reference Rosenvold, Petersen and Lærke 28 ), and the results are displayed as milligram of glycogen per gram of muscle (wet weight). Lactate concentration was measured using a commercially available kit (Jiancheng Bioengineering Institute) according to the manufacturer’s instructions on a UV-1100 spectrophotometer (Mapada).
Total RNA isolation and RT
Frozen tissue samples (50–100 mg) were crushed in liquid N2, and total RNA was extracted using TRIzol reagent (Invitrogen) according to the manufacturer’s instructions. RNA integrity and quality were determined by agarose gel electrophoresis (1 %) and spectrophotometry (A260/A280). RNA concentration was confirmed using the nucleic acid/protein analyser (DU-800; Beckman Coulter Inc.). A commercial RT kit (TaKaRa) was used for complementary DNA (cDNA) synthesis according to the manufacturer’s instructions. The RT products (cDNA) were stored at −20°C for relative quantification by PCR.
Real-time quantitative PCR for gene expression analysis
Primers were designed with Primer Express 3.0 (Applied Biosystems) and are shown in the online Supplementary Table S2. cDNA was amplified using the Real-Time PCR System (ABI 7900HT; Applied Biosystems). The reaction mixture (10 μl) contained 5 μl of SYBR Green Supermix (TaKaRa), 1 μl cDNA, 0·4 μl of each primer (10 μm), 0·2 μl ROX Reference Dye and 3 μl of diethylpyrocarbonate-treated water (ddH2O). The following cycling conditions were used: denaturation at 95°C for 15 s, followed by forty cycles of denaturation at 95°C for 5 s and annealing at 60°C for 30 s. To confirm the specificity of each product, a melting curve analysis (50–95°C with a heating rate of 0·1°C/s and continuous fluorescence measurement) was performed. All samples were analysed in duplicate; product size was determined by agarose gel electrophoresis. β-Actin was used as the internal control for PCR.
Western blot analysis
Total protein was extracted from frozen muscle samples according to the manufacturer’s instruction. In brief, samples were homogenised with basic lysis buffer (Beyotime Biotechnology) and protease inhibitor cocktail (Roche). The homogenate samples were then centrifuged for 30 min at 12 000 g and 4°C. The supernatant was isolated, and the protein content was measured using a bicinchoninic acid protein assay kit (Beyotime Biotechnology). The protein extract was separated by SDS-PAGE on a 10 % gel and transferred to a polyvinylidene fluoride membrane. After the transfer, the membrane was blocked with 5 % non-fat dry milk in TBS/T buffer (0·1 % Tween, 50 mm-Tris-HCl, 150 mm-NaCl and pH 7·6) for 60 min at room temperature. Later, the membranes were incubated overnight at 4°C with the respective antibodies: α-tubulin (3873; Cell Signaling) and GLUT4 (ab654; Abcam). After repeated washing with TBS/T buffer, the membranes were incubated with anti-rabbit IgG peroxidase-conjugated secondary antibodies (7074; Cell Signaling) in TBS/T buffer for 60 min at room temperature. Immunoblotted proteins were visualised using the chemiluminescent horseradish peroxidase substrate (Bio-Rad). The relative expression of GLUT4 protein was normalised using α-tubulin as the internal protein. The GLUT4 content was presented as the fold change relative to the control group.
DNA extraction
Total DNA from muscle tissues was extracted using a DNAiso reagent kit (TaKaRa), treated with ribonuclease A and purified with the MiniBEST DNA fragment purification kit (TaKaRa). No RNA contamination was detected upon agarose gel electrophoresis, and DNA concentration was measured using a nucleic acid/protein analyser (ND-1000; NanoDrop).
MassARRAY quantitative DNA methylation analysis
The CpG-rich sequences of the GLUT4 promoter regions (online Supplementary Fig. S1) were identified using the University of California Santa Cruz (UCSC) genome browser (http://genome.ucsc.edu/) (chr12:54810360–54816580, % GC=62 % and Obs/Exp CpG=0·85); four EpiTYPER assays were designed using Sequenom EpiDesigner software, which covered 11, 39, 6 and 11 CpG sites, respectively. These assays successfully generated data for 10, 34, 6 and 9 CpG sites, respectively. The primer sequences and the location of the four assays are presented in the online Supplementary Table S3. Quantitative methylation analysis of the porcine GLUT4 promoter was performed using Sequenom’s MassARRAY EpiTYPER protocol.
Genomic DNA was treated with bisulphite using the EZ DNA Methylation kit (Zymo Research), according to the manufacturer’s instructions. Bisulphite-treated DNA served as a template for amplification, and PCR was performed with the following conditions: 94°C for 4 min followed by forty-five cycles of 94°C for 20 s, 52–62°C for 30 s and 72°C for 3 min. All PCR amplification products were detected on agarose gels before further analysis. After treatment with shrimp alkaline phosphatase, the PCR products were used as templates for in vitro transcription and RNase cleavage reaction, as per the manufacturer’s instructions. Transcription cleavage products were dispensed into a 384-element SpectroCHIP bioarray, and the mass spectra were acquired by means of a MassARRAY mass spectrometer. The proportion of DNA methylation was calculated by EpiTYPER™ software version 1.0 (Sequenom).
Statistical analysis
Data are presented as mean values with their standard errors. Statistical analysis was performed using SPSS 20.0 software (SPSS Inc.). Serum measurements, gene and protein expressions, as well as methylation levels were analysed as a mixed model with maternal diet and postnatal age as fixed effects using the MIXED procedure in SPSS. During the GTT, both diet and time point were considered as the fixed effects. One-way ANOVA, followed by Duncan’s multiple-range test, was conducted to determine the differences between treatments. In addition, sow reproductive performance and piglet growth performance were analysed by independent-samples t test. Relative mRNA abundance was determined using the ΔΔcycle threshold (ΔΔC t ) method, and results of the relative mRNA abundance are expressed as fold change relative to the mean value of the control group. Probability values <0·05 were considered as statistically significant.
Results
Growth performance
The mean birth weight and mean litter weight were lower in the UN group than in the CON group (Table 1, P<0·01). Although lower body weights were observed in UN pigs than in CON pigs at dpn28 (P<0·05), body weights were not affected at dpn68, dpn110, dpn152 and dpn189 among treatments (Table 2). There was no difference in average food intake during 28–68, 68–110, 110–152, 152–189 and 29–189 d between the UN and CON groups (Table 3).
Table 1 Sow performance and body weight of killed piglets (Mean values with their standard errors; n 6 litter per treatment)
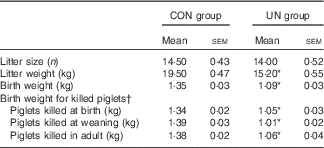
CON, control; UN, undernutrition.
* Significant differences between control and undernutrition groups (P<0·05).
† Piglets killed at birth (postnatal day 1), weaning (postnatal day 28) and adulthood (postnatal day 189).
Table 2 Body weight of pigs at different stages (Mean values with their standard errors; n 16 pigs per treatment)
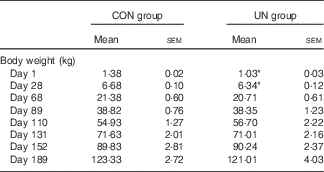
CON, control; UN, undernutrition.
* Significant differences between control and undernutrition groups (P<0·05).
Table 3 Growth performance of pigs at different stages (Mean values with their standard errors; n 16 pigs per treatment)

CON, control; UN, undernutrition.
* Significant differences between control and undernutrition groups (P<0·05).
† Feed conversion ratio calculated by the ratio of average daily gain:average daily feed intake.
Serum metabolites, serum hormones and muscle metabolites
Serum glucose concentration was significantly lower in UN pigs at dpn1 (Table 4, P<0·05), but higher (P<0·05) at dpn152 and dpn189 than in CON pigs. Compared with CON pigs, serum TAG concentration was significantly increased (P<0·05) in UN pigs at dpn152. Elevation in serum insulin concentrations was observed in UN pigs at dpn110 (P<0·05) and dpn189 (P<0·05), compared with that in CON pigs. In addition, UN pigs exhibited higher muscle lactate content at dpn1 (P<0·05), and lower muscle glycogen content at dpn28 (P<0·05) and dpn189 (P<0·05), compared with their counterparts in the CON group. In UN pigs, serum glucose content was lower at day 1 than at days 28, 68, 110, 152 and 189, whereas in CON pigs serum glucose content was lower at day 1 than at days 28, 68 and 110 (P<0·05). Compared with day 1, serum TAG and cholesterol contents increased at day 28 in both UN and CON pigs (P<0·05). High serum insulin content was observed at day 189 rather than at days 1, 28, 68, 110 and 152 in UN pigs, whereas high serum insulin content was observed at day 1 rather than at days 68, 110 and 152 in CON pigs (P<0·05). Compared with day 1, glycogen content was decreased and lactate content was increased in the muscle of both UN and CON pigs at day 189 (P<0·05).
Table 4 Serum and muscle metabolites of pigs at different stages (Mean values with their standard errors; n 16 pigs per treatment)

CON, control; UN, undernutrition.
a,b Mean values within a row with unlike superscript lower-case letters were significantly different between diet groups (P<0·05).
A,B,C,D Mean values within parameter and diet with unlike superscript capital letters were significantly different between times (P<0·05).
Intravenous glucose tolerance test
Blood glucose concentration was significantly higher in UN pigs at post-infusion times 5 and 20 than that in CON pigs (online Supplementary Table S4, P<0·05). During i.v.GTT, the area under the blood glucose curve (AUC, P<0·05) and half-life (P<0·05) were significantly increased, whereas glucose clearance rate (P<0·05) was significantly decreased in UN pigs, compared with those in CON pigs (Fig. 1).

Fig. 1 Plasma glucose concentrations (a), area under the blood glucose curve (AUC, b), glucose clearance rate (c) and half-time (d) during intravenous glucose tolerance test in pigs from control (CON) or undernutrition (UN) dams. Time indicates minutes relative to completion of dextrose infusion (n 8). * Significantly different between UN and CON group (P<0·05). ![]() , CON;
, CON; ![]() , UN.
, UN.
Gene expression involved in muscle glucose metabolism
At dpn1, the expressions of GLUT4 and HK2 mRNA were significantly down-regulated (Table 5, P<0·05), whereas the expression of lactate dehydrogenase (LDH) mRNA was significantly up-regulated in the skeletal muscle of UN pigs, as compared with those in CON pigs. At dpn28, maternal undernutrition during gestation markedly (P<0·05) decreased mRNA levels of GLUT4, GS, PK and citrate synthase (CS) and increased LDH mRNA levels in the offspring skeletal muscle. At dpn189, the expression levels of GS and GLUT4 were significantly lower (P<0·05), whereas the expression level of pyruvate dehydrogenase kinase (PDK) was significantly (P<0·05) higher in the UN group than in the CON group. In UN pigs, PK mRNA levels were lower at day 1 than at day 28, and LDH mRNA levels were higher at day 28 than at day 189 (P<0·05). In CON pigs, GLUT4 mRNA level was higher but GS mRNA level was lower at day 1 than at days 28 and 189, whereas PK, CS and PDK mRNA levels were lower at day 1 than at day 28 (P<0·05).
Table 5 The mRNA expressions of genes related to glucose metabolism in skeletal muscle of pigs at different stages (Mean values with their standard errors; n 6 at days 1 and 28, n 8 at day 189)

CON, control; UN, undernutrition; HK2, hexokinase II; GS, glycogen synthase; PK, pyruvate kinase; LDH, lactate dehydrogenase; CS, citrate synthase; PDK, pyruvate dehydrogenase kinase.
a,b Mean values within a row with unlike superscript lower-case letters were significantly different between diets (P<0·05).
A,B Mean values within parameter and diet with unlike superscript capital letters were significantly different between times (P<0·05).
Gene expression involved in muscle insulin signalling
At dpn1, the expressions of insulin receptor (IR) and serine/threonine protein kinase (AKT) 2 (AKT2) mRNA were significantly down-regulated (Table 6, P<0·05). At dpn28, the expression levels of insulin receptor substrate 1 (IRS1) and phosphatidylinositol 3-kinase (PI3K) were significantly lower (Table 6, P<0·05) in the UN group than in the CON group. At dpn189, the IR transcript level was significantly decreased (P<0·05) in the skeletal muscle of UN pigs. In UN pigs, IR mRNA level was higher at day 28 than at days 1 and 189, whereas AKT2 mRNA level was lower at day 1 than at days 28 and 189 (P<0·05). In CON pigs, IRS1 mRNA level was lower at day 1 than at day 28, whereas glycogen synthase kinase 3β (GSK3β) mRNA level was higher at day 28 than at day 189 (P<0·05).
Table 6 The mRNA expressions of genes related to insulin signalling in skeletal muscle of pigs at different stages (Mean values with their standard errors; n 6 at days 1 and 28, n 8 at day 189)

CON, control; UN, undernutrition; IR, insulin receptor; IRS1, insulin receptor substrate 1; PI3K, phosphatidylinositol 3-kinase; AKT1/2, serine/threonine protein kinases 1/2; GSK3, glycogen synthase kinase 3.
a,b Mean values within a row with unlike superscript lower-case letters were significantly different between diets (P<0·05).
A,B Mean values within parameter and diet with unlike superscript capital letters were significantly different between times (P<0·05).
Gene expression involved in DNA methylation
At dpn1, DNA methyltransferase (DNMT) 1 and DNMT3b were expressed at higher (Table 7, P<0·05) levels in the UN group compared with the CON group. At dpn28, the transcript levels of DNMT1 and DNMT3a were significantly increased (P<0·05) in UN pigs compared with CON pigs. At dpn189, the mRNA levels of DNMT3a and betaine-homocysteine methyltransferase (BHMT) were significantly higher (P<0·05) in UN pigs than in CON pigs. In UN pigs, DNMT1 mRNA level was higher at day 1 than at day 189, and adenosylhomocysteinase 1 (AHCY1) mRNA level was higher at day 28 than at day 189 (P<0·05). In CON pigs, AHCY11 mRNA level was higher at day 1 than at day 189 (P<0·05).
Table 7 The mRNA expressions of genes related to DNA methylation in skeletal muscle of pigs at different stages (Mean values with their standard errors; n 6 at days 1 and 28, n 8 at day 189)

CON, control; UN, undernutrition; DNMT1/3a/3b, DNA methyltransferase 1/3a/3b; BHMT, betaine-homocysteine methyltransferase; MAT2b, methionine adenosyltransferase 2b; AHCYL1, adenosylhomocysteinase 1.
a,b Mean values within a row with unlike superscript lower-case letters were significantly different between diets (P<0·05).
A,B Mean values within parameter and diet with unlike superscript capital letters were significantly different between times (P<0·05).
Protein content of muscle GLUT4
Compared with CON pigs, the protein content of GLUT4 (Fig. 2) was decreased in the skeletal muscle of UN pigs at dpn1 and dpn189 (P<0·05).

Fig. 2 Protein expression of GLUT-4 in skeletal muscle of pigs from control (CON) or undernutrition (UN) dams at postnatal days 1 and 189. Values are means (n 4 per treatment), with standard errors represented by vertical bars. a,b Mean values with unlike letters were significantly different (P<0·05). ![]() , CON;
, CON; ![]() , UN.
, UN.
DNA methylation at the GLUT4 promoter region
At dpn1, the sequencing results of the GLUT4 promoter indicated that the methylation ratio was significantly increased at −128, −661 and −826 sites in the UN pigs (Fig. 3, P<0·05) compared with CON pigs. At dpn189, the methylation levels at −128, −826, −840 and −909 sites of the sequenced GLUT4 promoter showed a significant rise in UN pigs compared with the CON pigs (P<0·05). In addition, the average methylation level was significantly increased in UN pigs at dpn1 (P<0·05) and dpn189 (P<0·05) compared with CON pigs. In UN pigs, the average methylation level was higher at day 1 than at day 189 (P<0·05).

Fig. 3 Methylation of individual CpG sites at the GLUT-4 promoter region in the skeletal muscle of pigs from control (CON) or undernutrition (UN) dams at postnatal day 1 (A) and day 189 (B). (C) Compare the percentage of mean methylation at 1–13 CpG sites between UN and CON groups. Values are means (n 4 per treatment), with standard errors represented by vertical bars. * Significantly different between treatments (P<0·05). a,b,c Mean values with unlike letters were significantly different (P<0·05). ![]() , CON;
, CON; ![]() , UN.
, UN.
Discussion
In agreement with previous reports in rodents( Reference Petry, Dorling and Pawlak 29 ), ewes( Reference Ford, Hess and Schwope 30 ) and humans( Reference Li, He and Qi 31 ), this study provided the first evidence in a pig model that maternal undernutrition during pregnancy indeed induced moderate diabetes mellitus and impaired glucose intolerance during adulthood, as demonstrated by increased serum glucose level, insulin content and AUC glucose in adult UN pigs. These outcomes are in agreement with the notion that maternal malnutrition exerts permanent effects on offspring metabolic diseases later in life( Reference Duque-Guimarães and Ozanne 2 ). Interestingly, studies in rats( Reference Lim, Armitage and Stefanidis 32 ), sheep( Reference Limesand, Rozance and Smith 33 , Reference Owens, Gatford and Blasio 34 ) and humans( Reference Iniguez, Ong and Bazaes 35 , Reference Mericq, Ong and Bazaes 36 ) have shown that intra-uterine malnutrition or low birth weight offspring displayed improved insulin sensitivity very early during postnatal life. However, a shift towards decreased insulin sensitivity and impaired glucose tolerance is evident in later life as these offspring age( Reference Devaskar and Chu 18 , Reference Thorn, Rozance and Brown 19 ). Consistently, we found that pigs from malnourished dams had lower serum glucose content at birth, but developed hyperglycaemia and hyperinsulinaemia as adults. This opposite shift suggested a significant interaction between maternal diet and ageing effects.
In particular, skeletal muscles, which account for 70–80 % of postprandial glucose disposal, play a central role in the maintenance of whole-body glucose homoeostasis( Reference Jornayvaz, Samuel and Shulman 8 ). Impaired glucose intolerance is strongly associated with deregulation of glucose disposal in the skeletal muscle( Reference Jornayvaz, Samuel and Shulman 8 ). GLUT4 accounts for the rate-limiting step in glucose uptake, and is the port of entry for glucose into the muscle. A defect in muscle GLUT4 causes severe insulin resistance and impaired glucose intolerance( Reference Kim, Zisman and Fillmore 37 , Reference Zisman, Peroni and Abel 38 ). Interestingly, we found that muscle GLUT4 mRNA and protein expressions in UN pigs were persistently decreased from birth to adulthood. This suggests that maternal malnutrition displays a long-lasting impact on muscle GLUT4 expression, thereby contributing to the development of glucose intolerance in adults.
However, the effects of maternal malnutrition on GLUT4 varied in different previous studies. In early life, a food-deprived (50 v. 100 %) diet during pregnancy and lactation resulted in decreased GLUT4 protein content in the muscle of rats at postnatal days 2 and 60( Reference Thamotharan, Shin and Suddirikku 15 ). Consistently, in sheep, placental restriction decreased protein content of muscle GLUT4 at 140 d of gestation( Reference Muhlhausler, Duffield and Ozanne 16 ) or decreased the mRNA level of muscle GLUT4 at 43 (sem 2) d of age( Reference De Blasio, Gatford and Harland 14 ). Conversely, a similarly designed experiment demonstrated a contrasting result that showed increased muscle GLUT4 protein content in 38-d-old female rats derived from dams fed a low-protein (LP) diet (8 v. 20 %) during gestation and lactation( Reference Zheng, Rollet and Pan 13 ), or in placentally restricted lamb at 21 d of age( Reference Muhlhausler, Duffield and Ozanne 16 ). Results from subcellular fractionation experiments were also inconsistent. Non-stimulated or insulin-stimulated glucose uptake and GLUT4 translocation in the muscle were reported to increase in rats at 60( Reference Gavete, Martín and Alvarez 17 ) and 90( Reference Ozanne, Wang and Coleman 39 ) d, or decrease in rats at 70 d( Reference Agote, Goya and Ramos 40 ), which were derived from dams fed LP or food-restricted diet. In particular, Freitas et al.( Reference Freitas, Souza and Silva 41 ) reported that insulin-stimulated muscle GLUT4 translocation was decreased at 4 and 8 d, but was increased at 60 d in rats from dams that received a protein-free diet during lactation.
In later postnatal life, the effects of maternal malnutrition on GLUT4 displayed consistency across different species. In rat studies, GLUT4 protein content was decreased in the muscle of 15-month-old rats, which were born from LP dams( Reference Freitas, Souza and Silva 41 ) or placentally restricted dams( Reference Raychaudhuri, Raychaudhuri and Devaskar 42 ). Consistently, in human studies, reduced GLUT4 protein content was observed in young men with low birth weight( Reference Ozanne, Jensen and Tingey 43 , Reference Jensen, Martin-Gronert and Storgaard 44 ). Generally, early postnatal life is characterised by immaturity and plasticity, which then progresses to altered glucose homoeostasis from growth to maturity in adults. Therefore, diverse GLUT4 changes in different species during early life induced by poor prenatal nutrition reflect short-term and diverse adaptive responses to improved environmental cues after birth, acting through developmental plasticity. However, the long-term effects of GLUT4 attributed by nutritional factors acting in utero can be fixed in adulthood possibly through epigenetic modulations, which in turn confer an adverse phenotype.
Emerging evidences have revealed that intra-uterine undernutrition leads to permanent changes in the expressions of genes or proteins via DNA methylation, which can alter susceptibility to complex diseases later in life( Reference Lillycrop and Burdge 45 ). In this study, analysis of DNA methylation patterns in the promoter region of GLUT4 indicated a significant increase in methylation levels in newborn and adult UN pigs. Typically, hypermethylation at the gene promoter is considered to prevent gene expression( Reference Raynal, Si and Taby 46 , Reference Cedar and Bergman 47 ). Therefore, these observations of hypermethylation at the GLUT4 promoter are in good agreement with the trend of progressive decline in muscle GLUT4 transcription in newborn and adult UN pigs. Therefore, our findings suggest that altered methylation at muscle GLUT4 promoter persists throughout the lifetime of the pigs, even without further exposure to poor nutrition after birth. It is considered that DNA methylation displays long-term impacts on transcriptional regulation of muscle GLUT4, consequently contributing to impaired glucose intolerance during adulthood.
Indeed, it has been shown that total methylcytosine content is prone to decrease upon ageing, which underlies reduced genomic hypomethylation( Reference Calvanese, Lara and Kahn 48 , Reference Benayoun, Pollina and Anne 49 ). This suggests that ageing is critical for the regulation of DNA methylation. A body of literature has demonstrated the changes in epigenetic patterns over the ageing process. Park et al.( Reference Park, Stoffers and Nicholls 50 ) reported that histone acetylation was progressively lost, whereas histone methylation (H3K9me2) was progressively strengthened, following intra-uterine growth retardation during the ageing process. Consistently, an interesting study by Sandovici et al.( Reference Sandovici, Smith and Nitert 51 ) showed that ageing leads to progressively suppressive histone marks of the hepatocyte nuclear factor-4 in the islets, and a poor maternal diet amplifies the age-associated epigenetic silencing of this locus. A similar observation was also reported by Murgatroyd & Avwu( Reference Murgatroyd, Patchev and Wu 52 ). These studies indicate that early poor nutrition can interact with ageing to influence gene and protein expressions, thereby leading to the development of adverse metabolic phenotypes in later life. Interestingly, in this study, the average methylation levels at the GLUT4 promoter were lower in adults than at birth in UN pigs, but not in CON pigs. Meanwhile, the differences in CpG-site methylation were more pronounced in adults (at −128, −826, −840 and −909) than at birth (at −128, −661 and −826). Both these observations suggested that the methylation changes occurring with age were highly dependent on maternal nutrition status.
Indeed, DNMT, an enzyme that catalyses the transfer of a methyl group to DNA, is required for establishing genomic methylation patterns( Reference Portela and Esteller 53 ). In this study, DNMT1 expression persistently increased in the skeletal muscle of both newborn and weaning UN pigs, whereas DNMT3b and DNMT3a increased in the skeletal muscle of newborn and adult UN pigs, respectively. Reduced expression of DNMT in the skeletal muscle of UN pigs might be expected to support hypermethylation at the GLUT4 promoter during postnatal life. In addition, it has been proposed that decreased DNMT1 expression underlies reduced genomic hypomethylation during the ageing process. As expected, we found that UN pigs showed decreased muscle DNMT1 expression as the postnatal age progressed. These changes may help UN pigs to reduce methylation levels at the GLUT4 promoter with age. In addition, BHMT, which is an enzyme limited to methyl-group metabolism, was increased in the skeletal muscle of UN pigs at dpn189, but not at dpn1 and 28. We speculate that UN offspring might be prenatally adapted to a nutrient-deficient environment, and therefore may respond postnatally to an adequate nutrient supply with increased catabolism of the methyl group by BHMT. This alteration in BHMT expression may help UN pigs to maintain high methylation levels in later life.
Once glucose is transported into the skeletal muscle by GLUT4, it can be phosphorylated to glucose-6-phosphate catalysed by HK2. It has been shown that decreased muscle glucose uptake is associated with decreased activity or expression of HK2( Reference Vestergaard, Bjørbaek and Hansen 54 ), indicating that muscle glucose transport may be rate limiting for HK2 expression. As expected, we found that muscle HK2 expression was down-regulated in UN pigs at dpn1. Subsequently, most of the glucose-6-phosphate should be stored as muscle glycogen, which is mainly catalysed by GS, an enzyme that is rate limiting for glycogen synthesis( Reference Bouskila, Hunter and Ibrahim 55 ). It has been shown that impaired glycogen synthesis is the key feature of muscle insulin resistance in patients with type 2 diabetes mellitus( Reference Petersen and Shulman 56 ). Consistently, our present study showed that impaired glucose tolerance was associated with decreased muscle glycogen synthesis in UN pigs, as demonstrated by the reduction in muscle GS expression and glycogen content at dpn28 and dpn189.
Beside glycogen synthesis, a fraction of glucose-6-phosphate is further processed in glycolysis( Reference Kruszynska, Ciaraldi and Henry 11 ). In particular, PK is a key glycolytic enzyme that catalyses the final step of glycolysis with the generation of pyruvate( Reference Chaneton and Gottlieb 57 ). Further, pyruvate can be catalysed to coenzyme A, which is the metabolic substrate for the tricarboxylic acid cycle (TCA)( Reference Schroeder, Atherton and Dodd 58 ). Consequently, the altered PK expression would be expected to influence glucose oxidation and energy production. Our present study provides the first evidence that muscle PK mRNA level was reduced in UN pigs at dnp28, indicating that maternal undernutrition may impair offspring glucose oxidation in the skeletal muscle. As expected, CS, an enzyme that is the first rate limiting for TCA( Reference Pan-Zhou, Cui and Zhou 59 ), was reduced in UN pigs at dnp28, and PDK4, an enzyme that participates in the suppression of glucose oxidation through inhibition of pyruvate dehydrogenase( Reference Long, Kostovski and Boon 60 ), was observed to be increased in UN pigs at dpn189. In addition, in glycolytic muscles with a low oxidative capacity, most of the pyruvate can be catalysed to lactate by LDH with the generation of ATP( Reference Kruszynska, Ciaraldi and Henry 11 ). Our results showed that the mRNA level of muscle LDH was increased in UN pigs at dnp1 and dnp28; this indicated an adaptation to help UN offspring stimulate ATP production to promote muscle growth. We also found that increased LDH expression is associated with increased lactate content in the skeletal muscle of UN pig at dpn1. This alteration would be expected to weaken muscle insulin sensitivity, as increased lactate leads to induction of muscle insulin resistance( Reference Choi, Kim and Lee 61 ). Besides the effects of maternal diet, PK expression was up-regulated at day 28 compared with day 1, suggesting a higher nutrient supply at day 28 than at day 1, as PK is sensitive to nutrient supply( Reference Spoden, Rostek and Lechner 62 ). Therefore, we assume that the differences in PK expression were obvious at day 28, as the UN fetuses were not adapted to cope with improved nutritional environment after birth. In addition, LDH expression in UN pigs was lower at day 189 than at days 1 and 28. This suggested a deficiency of energy at days 1 and 28, as LDH stimulates ATP production( Reference Kruszynska, Ciaraldi and Henry 11 ). Therefore, we assume that the differences in LDH expression were significant at days 1 and 28 because the fetuses in the UN group were not able to meet their energy requirements completely. However, as these offspring grew with an improved energy supply, changes in LDH expression were not obvious during adulthood.
Notably, insulin signalling plays a major role in controlling glucose homoeostasis in almost all the body tissues, and impaired insulin signalling is associated with insulin resistance( Reference Saltiel and Kahn 63 ). The major signal proteins in this cascade include IR, IRS1/IRS2, PI3K and AKT1/AKT2( Reference Samuel and Shulman 7 ). Impaired insulin signalling can result in two insulin responses in the skeletal muscle: decreased glycogen synthesis via phosphorylation of GSK3β or limited glucose transfer via translocation of GLUT4( Reference Saltiel and Kahn 63 ). Therefore, in this study, UN pigs exhibited decreased muscle insulin sensitivity as confirmed by decreased expressions of IR, IRS1, PI3K and AKT1 at different postnatal ages. These changes would be expected to impair GLUT4 and GS expressions. However, the effects of maternal malnutrition on insulin signalling vary in different stages. During fetal life, IR expression was improved in the skeletal muscle of sheep subjected to placental insufficiency( Reference Muhlhausler, Duffield and Ozanne 16 , Reference Thorn, Regnault and Brown 64 ). In early postnatal age, the responses to insulin signalling are shown to differ in previous studies, with reports of decrease at 42 d in sheep from placentally restricted dams( Reference De Blasio, Gatford and Harland 14 ), increase at 21 d in sheep from placentally restricted dams( Reference Muhlhausler, Duffield and Ozanne 16 ) and at 60 d in rats from under-nourished dams( Reference Gavete, Martín and Alvarez 17 , Reference Freitas, Souza and Silva 41 ), or unchanged at 60 d in rats from under-nourished dams( Reference Oak, Tran and Pan 65 ). As insulin signalling is strongly related to the insulin content, up-regulation of insulin signalling is considered as a natural compensatory response to low insulin levels in all insulin-responsive cells and organisms with an under-nourished fetus. Therefore, the inconsistent response of insulin signalling in our study may be due to the unchanged insulin content at birth. In later life, low birth weight subjects showed reduced expressions of several proteins related to insulin signalling in the muscle( Reference Ozanne, Jensen and Tingey 43 , Reference Jensen, Martin-Gronert and Storgaard 44 ), which is in agreement with our result. A similar response was observed in rats as well( Reference Ozanne, Jensen and Tingey 43 ). These changes help in the development of age-associated glucose intolerance during adulthood.
Conclusion
In conclusion, our results indicate that maternal undernutrition during pregnancy decreases GLUT4 gene and protein expressions in the muscle of offspring likely by favouring methylation of the muscle GLUT4 promoter. Further, these alterations in methylation can persist into adulthood with long-term consequences on glucose homoeostasis and insulin sensitivity in the skeletal muscle, possibly contributing to subsequent pathogenesis of glucose intolerance in adult life. In addition, ageing can progressively interact with maternal diet to influence methylation of the muscle GLUT4 promoter, which may help in the amplification of age-associated glucose intolerance induced by the maternal diet.
Acknowledgements
The authors thank Beijing Yophgene Technology Co Ltd for their help in determining the methylation levels.
This work was supported by National Natural Science Foundation of China (30471257), the non-profit sector (agriculture) (201203015), the Academy of Kechuang Feed Industry in Sichuan (2013NZ0056), the Research Team of Youth Scientific and Technical Innovation of Sichuan (13CXTD0004), and the Program for Changjiang Scholars and Innovative Research Team in University (IRT13083).
The authors’ contributions are as follows: D. W. and J. W. designed the study; J. W. wrote the paper; J. W., M. C., M. Y. and J. L. carried out the animal study; J. W. and Y. L. performed the analysis of biochemical parameters; L. C., B. F. and Z. F. determined the gene and protein expressions; D. W., J. W. and M. C. carried out data analyses; D. W., S. X. and B. F. made modifications to the manuscript. All the authors read and approved the final version of the manuscript.
The authors declare that there are no conflicts of interest.
Supplementary Material
For supplementary material/s referred to in this article, please visit http://dx.doi.org/doi:10.1017/S0007114516002166


