


In all monogastric mammalian species so far studied, soluble dietary fibres escape digestion in the small intestine, and are broken down in the large bowel by anaerobic bacteria. Yet, compared with dogs and human beings, healthy cats, being strict carnivores, carry higher numbers of bacteria in the proximal part of the small intestine, suggesting the existence of microbial fermentation in their small intestine as well(Reference Johnston, Lamport and Batt1–Reference Sparkes, Papasouliotis and Sunvold3). However, further research is needed to confirm this hypothesis. Fermentation leads to the production of SCFA, mainly acetate, propionate, butyrate and lactate, along with gases(Reference Cummings, Pomare and Branch4, Reference Roberfroid and Delzenne5). SCFA are promptly absorbed from the colonic lumen. Whereas butyrate is to a large extent metabolised by colonocytes, propionate and acetate reach the liver via the portal vein(Reference von Engelhardt, Cummings, Rombeau and Sakata6, Reference Rémésy, Demigné, Morand, Cummings, Rombeau and Sakata7). Hepatic metabolism of propionate contributes, after entering the citric acid cycle at the level of succinyl CoA, to the synthesis of oxaloacetate, which may enter the gluconeogenic pathway(Reference Rémésy, Demigné, Morand, Cummings, Rombeau and Sakata7). Therefore, it is reasonable that whenever this pathway is active in liver cells, propionate, when available, may interfere with the utilisation of various gluconeogenic substrates, such as lactate and amino acids(Reference Anderson and Bridges8–Reference Petitet, Morand and Besson10). Although the gluconeogenic pathway is only poorly active in fed monogastric species such as dogs and omnivores, the feline liver is most likely to produce glucose by gluconeogenesis rather than to remove glucose rapidly from the blood, as shown by the high activity of rate-limiting enzymes of gluconeogenesis such as pyruvate carboxylase, fructose-1,6-biphosphatase and glucose-6-phosphatase(Reference Washizu, Tanaka and Sako11, Reference Tanaka, Inoue and Takeguchi12) and minimal to absent hepatic glucokinase activity(Reference Washizu, Tanaka and Sako11–Reference Ballard13), as well as by considerably low d-glucose transport activities in feline hepatocytes(Reference Arai, Washizu and Sako14) and minimal activity of hepatic glycogen synthetase(Reference Ballard13).
Two previous trials hypothesised that soluble dietary fibres and propionate evoke amino acid-sparing conditions in domestic cats as oligofructose and inulin supplementation did not only increase fasting plasma propionylcarnitine concentrations, but it also tended to reduce fasting plasma methylmalonylcarnitine concentrations and decreased aspartate aminotransferase activity(Reference Verbrugghe, Hesta and Gommeren15). Plasma propionylcarnitine concentrations were also raised; still, plasma acetylcarnitine tended to be reduced, and 3-hydroxy-3-methylglutarylcarnitine concentrations were decreased following colonic propionate infusion (A Verbrugghe, M Hesta, S Daminet, et al. unpublished results). Therefore, soluble dietary fibre and especially fermentation products such as propionate were postulated to reduce the utilisation of amino acids as substrates for gluconeogenesis by using propionate instead. This might reduce protein mobilisation, and stimulate the use of amino acids in other metabolic processes such as tissue preservation and immunity. Nevertheless, in both the earlier studies, cats were fasted and no dietary energy source was available, and thus gluconeogenesis had to originate from tissue protein mobilisation.
Therefore, the aim of the present trial was to evaluate postprandial metabolic effects and especially a possible protein-sparing effect of adding soluble dietary fibre to a high-protein diet in healthy cats. Hence, N balance was investigated, and plasma acylcarnitine profile (free carnitine, and acetyl-, propionyl-, butyryl-, methylmalonyl- and 3-hydroxy-3-methylglutaryl-carnitine) and selected indices of carbohydrate (plasma glucose concentrations) and protein metabolism (plasma urea and amino acid concentrations) were scrutinised before and after feeding. Plasma acylcarnitines mirror the mitochondrial acyl-CoA pool, and are therefore a reflection of metabolites available for citric acid cycle(Reference Bremer16, Reference Brass and Hoppel17). The analysis of the plasma acylcarnitine profile is the current standard for the diagnosis of genetic defects in mitochondrial fatty acid oxidation and defects in the catabolism of branched-chain amino acids(Reference Vreken, van Lint, Bootsma, Quant and Eaton18).
Materials and methods
Animals and housing
Eight domestic shorthair cats, four females and four males, were included in the study. All male and female cats were spayed. All the cats were adults and aged between 2 and 7 years. All the cats were healthy and were not given any medication at the time of the study; none had prior medical problems. During the trial, cats were housed in their usual group cages, and they had no access to food, but water was available ad libitum. Two hours a day, starting at 07.00 and 19.00 hours, respectively, cats were allowed to eat in individual indoor cages. At the end of each testing period, cats were housed individually for 10 d. The first 5 d were essential to make the cats used to the individual cages. During these days, blood samples were collected as well. Another 5 d were required to collect faecal and urine samples.
Diets and feeding
A commercial canned cat food (Hill's Prescription Diet® A/D®, Hill's Pet Nutrition Inc., Topeka, KS, USA) containing no prebiotics and other soluble or insoluble fibres added, except for 0·6 % guar gum on DM basis as a gelling agent (Table 1), was used as the basis to formulate both the test diets. To prepare the high-fermentable fibre (HFF) diet, the commercial diet was supplemented with 4 % of a mixture of oligofructose and inulin on DM basis. Therefore, Orafti HSI® (Beneo-Group, Tienen, Belgium) containing 86 % of oligofructose and inulin and 14 % of a mixture of fructose, glucose and sucrose was used. According to the producer, the mean total number of fructose or glucose units (degree of polymerisation) of this soluble fibre mixture was less than 10 (degree of polymerisation 2–10: 60 (se 5) % DM; degree of polymerisation >10: 28 (se 5) % DM). To prepare the low-fermentable fibre (LFF) diet, a mixture of 86 % cellulose (Arbocel® BWW 40; J. Rettenmaier & Söhne, Rosenberg, Germany) and 14 % of a mixture of fructose, glucose and sucrose was added, resulting in a 4 % supplementation of cellulose on DM basis. The proximate analysis of the two test diets is also shown in Table 1.
Table 1 Nutrient composition of the low-fermentable fibre (LFF) diet and the high-fermentable fibre (HFF) diet
NFE, nitrogen-free extract; NSP, non-starch polysaccharides; NDF, neutral detergent fibre; TDF, total dietary fibre; ME, metabolisable energy.
* Basal diet: Hill's Prescription Diet® A/D®, ingredients: pork liver, chicken, maize flour, pork meat, fish oil, hydrolysed protein, guar gum, potassium chloride, taurine, magnesium oxide, vitamins and trace elements; LFF diet: Hill's A/D®+cellulose mixture, consisting of 86 % Arbocel® BWW 40 and 14 % mixture of glucose, fructose and sucrose, in order to add 4 % cellulose on DM; HFF diet: Hill's A/D®+Orafti® HSI, consisting of 86 % oligofructose and inulin and 14 % mixture of glucose, fructose and sucrose, in order to add 4 % oligofructose and inulin on DM.
† Derived by subtracting crude protein, ether extract, crude ash and crude fibre content from the DM content.
‡ Derived by subtracting starch and sugar content from the NFE content.
§ Estimated using a four-step calculation(Reference Vreken, van Lint, Bootsma, Quant and Eaton18).
Cats were offered two meals daily (07.00 and 19.00 hours). The daily amount of food given corresponded with the maintenance energy requirement (418·4 kJ/kg0·67 and 100 kcal/kg0·67)(19), and was adapted to maintain a constant body weight. Fresh water was available at all times.
Experimental design
Before the start of the study, the cats were subjected to a physical examination; a fasted blood sample was drawn from the jugular vein for complete blood count and serum biochemistry. Measurements of body weight and body condition score were performed. Body condition score was determined using a five-point body condition scoring system(Reference Scarlett, Donoghue and Saidla20). Cats with an ideal body weight (mean body weight of 4·5 (se 0·3) kg) and a body condition score of 3/5 to 3·5/5 were used in the study.
Cats were randomly divided into two groups. Each group of cats was assigned to each of the two diets (LFF diet and HFF diet) in a random order at intervals of 4 weeks. In this way, diets were examined in a crossover design. Food intake was measured daily throughout the study. Body weight and body condition score were recorded twice weekly.
Sampling procedure
To determine the postprandial metabolic effects of soluble dietary fibre, a meal response test was performed in each cat at the end of each testing period. Hence, to allow blood sampling, a central venous catheter was placed into a jugular vein. At least 20 h before the blood sampling procedure, after an overnight fast, cats were anaesthetised with buprenorphine (Temgesic®; Schering-Plough NV, Heist-Op-Den-Berg, Belgium), 10 μg/kg intravenously, and then with propofol (Propovet®, Abbott Lab, Leuven, Belgium), 6–7 mg/kg to effect, intravenously, and a 20 G, 8 cm intra venous catheter (Leaderflex®, Vygon, Écouen, France) was placed in a jugular vein. Catheters were flushed twice daily with 1 ml heparinised saline (50 IU of heparin/ml in saline (0·9 % NaCl) solution) to maintain patency. Amoxicillin (Clamoxyl LA®, GlaxoSmithKline n.v., Genval, Belgium), 15 mg/kg subcutaneously, was administered once at the time of catheter placement. The meal response test was performed between 06·30 and 13.00 hours. During the meal response test, cats were allowed to eat for 1 h (07.00 hours until 08.00 hours). Blood samples were collected from the jugular catheter as described by Martin & Rand(Reference Martin and Rand21) before the meal (06.30 hours) and 60, 90, 120, 150, 180, 210, 240, 270 and 330 min after starting the meal. Whole blood was collected in vacutainer tubes containing lithium heparin for the determination of plasma glucose and urea concentrations, and for the determination of the acylcarnitine and amino acid profile. Serum vacutainer tubes were used to determine serum insulin concentrations. Plasma and serum were obtained after centrifugation, and were stored at − 20°C until assayed.
At the end of each testing period, cats were housed individually in the metabolic cages to enable the collection of all faeces and urine over a 5-d period. During each collection period, fresh faeces were collected once from each cat for immediate determination of faecal pH, and were stored at − 80°C until assayed. Urine was stored immediately at − 20°C until assayed.
The experimental protocol of the present trial was approved by the Ethical Committee of the Faculty of Veterinary Medicine, Ghent University, Belgium (EC 2008/014), and was in accordance with the institutional and national guidelines for the care and use of animals.
Analytical methods
Diets were analysed for DM, ash, crude protein, diethyl ether extract, starch, crude fibre, neutral detergent fibre and total dietary fibre. DM and ash content were determined by drying to a constant weight at 103°C and combustion at 550°C, respectively. Crude protein (6·25 × N) was determined using the Kjeldahl method (ISO, 2005), and diethyl ether extract was analysed with the Soxhlet method (ISO, 1973). Starch, crude fibre, neutral detergent fibre and total dietary fibre were determined using the Association of Official Analytical Chemists methods(Reference Cunniff22–Reference Cunniff25). Only a small fraction of inulin was recovered, and oligofructose was not recovered by this total dietary fibre method(Reference Prosky and Hoebregs26). Metabolisable energy was estimated using predictive equations according to a four-step calculation based on the calculation of gross energy and digestibility of energy(Reference Scarlett, Donoghue and Saidla20). Faecal pH was measured with a glass electrode immediately after the collection of faeces and after diluting the fresh faeces with 10 % deionised water. Faecal DM content was determined by drying the frozen samples to a constant weight at 103°C. The method for the estimation of faecal bacterial nitrogen, adapted from Mason(Reference Mason27), has been described by Hesta et al. (Reference Hesta, Roosen and Janssens28). For SCFA analysis, frozen faecal samples were thawed, and 1 g of fresh material was transferred into a centrifuge tube together with 5 ml of water–phosphoric acid–formic acid (550:10:1, by vol.). Samples were shaken manually before centrifugation (15 min at 22 000 g and at 4°C; Beckman J2-HS, Woerden, The Netherlands), after which, the supernatant was filtered through glass wool before GC analysis according to Van Nevel & Demeyer(Reference Van Nevel and Demeyer29). Phenol, indole and p-cresol were extracted from faecal samples by mixing the freeze-dried samples with 250 μl of the internal standard (100 μg/ml 5-methylindole) and 15 ml of hexane, followed by incubation at 4°C and 10 min of ultrasonic vibration, 10 min of rotation (130 turns per min) and ultrasonic vibration once again for 10 min. Samples were then centrifuged at 14 000 g for 10 min at 4°C. Supernatant was collected, and the remaining pellet was mixed with 15 ml of hexane and extracted as described above. The two supernatant fractions were combined before analysis by GC. Therefore, a Trace gas chromatograph coupled to a PolarisQ quadrupole ion trap mass spectrometer and a Finnigan MAT A200S autosampler (ThermoFinnigan, Austin, TX, USA) and a BPX-5 fused silica capillary column (25 m × 0·22 μm internal diameter; 0·25 μm film thickness and 5 % phenyl polysilphenylene–siloxane liquid phase) (SGE, Inc., Austin, TX, USA) were used. Helium was used as a carrier gas at a flow rate of 3 ml/min. Perfluorotributylamine was used as a calibration gas. Column temperature was 300°C, and the injector, ion source and transfer line temperatures were 290, 260 and 250°C, respectively. N concentrations were determined in faecal and urine samples as well using the Kjeldahl method (ISO, 2005) for the determination of N balance (N intake–faecal N excretion–urinary N excretion) and N digestibility ((N intake–faecal N excretion) × 100/N intake). Because total urine collection was incomplete, urine production was estimated with K as an indicator, and therefore calculated from urinary K concentration and excretion(Reference Hesta, Hoornaert and Sales30). Hence, dietary, faecal and urinary K concentrations were analysed with inductively coupled plasma atomic emission spectrometry, and urinary K excretion was calculated by the difference between K intake and faecal K excretion. Quantitative electrospray tandem MS was used to determine free carnitine, acylcarnitine and amino acid profile as described by Vreken et al. (Reference Vreken, van Lint, Bootsma, Quant and Eaton18). and Rizo et al. (Reference Rizzo, Boenzi and Wanders31). Plasma glucose (VetTest 9820369) and urea (VetTest 982062) concentrations were determined using the VetTest 8008 analyser (Idexx Laboratories Europe B.V., Hoofddorp, The Netherlands). The apparatus is based on dry chemical technology and colorimetric reaction. Sample analysis was carried out on selective testing discs (Idexx Laboratories Europe B.V.) by means of laser reading the bar codes. Areas under the curves (AUC) for all the data during the meal response test were calculated according to the trapezoidal method(Reference Rowland, Tozer, Balado, Klass, Stead, Forsyth and Magee32).
Statistical analysis
Statistical analyses were performed using the Superior Performing Software Systems version 16 (SPSS Belux, Brussels, Belgium). Data during the meal response test were statistically analysed by repeated-measures ANOVA with diet and time as within-subject factors. A paired sampled t test was used for statistical analyses of the AUC as well as for body weight, food intake, faecal indices and N balance. Statistical significance was accepted at P < 0·05. All data are expressed as means with their standard errors.
Results
All eight cats completed the trial; yet, catheter placement failed in one cat and no blood samples could be obtained. Both the test diets were well tolerated. None of the cats refused to eat any of the diets, and none showed signs of illness or maldigestion. No differences were observed for food intake between the test diets (LFF, 147 (se 17) g/d; HFF, 153 (se 19) g/d; P = 0·662). Body weight remained stable in all the cats during the study, and was not affected by the test diets.
Faecal characteristics
As shown in Table 2, total amount of faeces produced over a 5-d collection period, the percentage of faecal moisture and faecal pH were comparable between the diets. Also, the total excretion of SCFA, expressed as μmol/g faeces, as well as the amount of individual SCFA (acetic, propionic, butyric, valeric and isovaleric acids), expressed as the percentage of total excretion and as absolute amounts (μmol/d), did not reveal any diet effects. The crude protein content in the faeces was higher when the HFF diet was fed, when expressed as the percentage on DM (P = 0·005) and as the percentage on as-is basis (P = 0·033), but not when expressed as g/d. Faecal bacterial protein content, expressed as the percentage on DM, the percentage on as-is basis, g/d or the percentage of faecal crude protein content, did not differ between the diets. Faecal indole and p-cresol concentrations, when expressed as μg/g DM, μg/g faeces or mg/d, did not differ between the diets; yet, they were numerically lower when the HFF diet was fed. Phenol was below the detection limit ( < 25 μg/g DM) in all the faecal samples.
Table 2 Faecal characteristics, faecal excretion of SCFA and faecal crude protein and bacterial protein in eight healthy cats fed a low-fermentable fibre (LFF) diet and a high-fermentable fibre (HFF) diet
(Mean values with their standard errors)
* Collected over a 5-d period.
† Faecal moisture content and pH were determined in fresh faecal samples.
‡ The percentage of total SCFA.
Apparent nitrogen digestibility and nitrogen balance
No differences between test diets could be demonstrated for N intake, apparent N digestibility and daily faecal N excretion, when expressed as g/d, the percentage of N intake or the percentage of total N excretion. However, urinary N excretion, expressed as g/d, was 58 % lower in cats fed the HFF diet than in cats fed the LFF diet (P = 0·044). Also, urinary N excretion, expressed as the percentage of N intake, was lower in cats fed the HFF diet (P = 0·020), whereas when expressed as the percentage of total N excretion, no differences were observed. Net N balance, which was positive in all the cats, tended to be increased when the HFF diet was fed (P = 0·079), and is shown in Table 3.
Table 3 Nitrogen balance and nitrogen digestibility in eight healthy cats fed a low-fermentable fibre (LFF) diet and a high-fermentable fibre (HFF) diet
(Mean values with their standard errors)
Acylcarnitine profile
Plasma free carnitine and acetyl-, butyryl- and methylmalonyl-carnitine concentrations did not differ between the diets. These characteristics also revealed no time effects, except for acetylcarnitine (P = 0·006), nor diet–time interactions, and AUC did not differ between the diets (Table 4). As shown in Fig. 1, plasma propionylcarnitine concentrations changed over time (P = 0·004), and were higher at almost every time point after starting the meal in cats fed the HFF diet than in cats fed the LFF diet (P = 0·015). The AUC for propionylcarnitine was also higher in cats fed the HFF diet (P = 0·013) (Table 4). In contrast, plasma 3-hydroxy-3-methylglutarylcarnitine concentrations (Fig. 1) were lower in cats fed the HFF diet (P = 0·026); yet, no time effect nor diet–time interaction was observed. The AUC for 3-hydroxy-3-methylglutarylcarnitine was also lower when the HFF diet was fed (P = 0·028) (Table 4).
Table 4 Area under the curves (AUC) for selected acylcarnitines (μmol/l per 330 min) in seven healthy cats following a meal response test using a low-fermentable fibre (LFF) diet and a high-fermentable fibre (HFF) diet
(Mean values with their standard errors)

Fig. 1 Mean plasma acylcarnitine concentrations in seven healthy cats before and after starting the meal consisting of a low-fermentable fibre (–♦–) diet and a high-fermentable fibre (- -▲- -) diet. (a) Propionylcarnitine: diet effect, P = 0·015; time effect, P = 0·004; diet × time, P = 0·433; (b) 3-hydroxy-3-methylglutarylcarnitine: P = 0·026, P = 0·291 and P = 0·833, respectively.
Amino acids, urea and glucose
Plasma amino acid concentrations (leucine, methionine, phenylalanine, tyrosine, ornithine, citrulline, glycine, and alanine) showed no diet effects or diet–time interactions, except for methionine (P = 0·014); yet, time effects were observed. Plasma leucine, methionine, ornithine, citrulline (P < 0·001 for all) and glycine (P = 0·006) concentrations rose following the meal, in contrast to plasma phenylalanine and tyrosine concentrations, which fell over time (P < 0·001 for both). AUC for these amino acid concentrations also did not change between the diets (data not shown). Plasma urea concentrations (Fig. 2) showed no diet effect and no diet–time interaction, and the AUC for urea remained similar between the diets; yet, plasma urea concentrations rose over time, regardless of diet (P < 0·001). Plasma glucose concentrations (Fig. 2) did not differ between the diets and showed no time effect. Furthermore, the AUC for glucose remained equal between the diets.
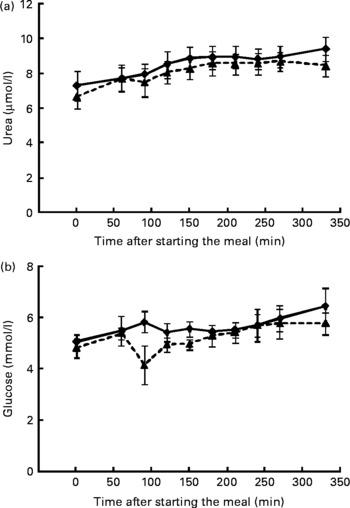
Fig. 2 Mean plasma urea and glucose concentrations in seven healthy cats before and after starting the meal consisting of a low-fermentable fibre (–♦–) diet and a high-fermentable fibre (- -▲- ) diet. (a) Urea: diet effect, P = 0·429; time effect, P < 0·001; diet × time, P = 0·218; (b) glucose: P = 0·221, P = 0·133 and P = 0·077, respectively.
Discussion
Soluble dietary fibres and their fermentation products are suggested to reduce protein catabolism and spare amino acids in true carnivorous species, such as domestic cats (Verbrugghe et al. (Reference Verbrugghe, Hesta and Gommeren15); A Verbrugghe, M Hesta, S Daminet, unpublished results). However, in both the earlier studies, cats were fasted for 12–24 h, and thus energy supply had to originate from tissue protein mobilisation by using the gluconeogenic pathway. Therefore, the present trial evaluated amino acid-sparing conditions in response to a high-protein, low-carbohydrate meal.
Differences in fermentability between fibre sources were based on in vitro studies showing that first, in comparison with canine, equine, porcine and human faecal inoculums, the greatest total SCFA production resulted when substrates were fermented by cat faecal inoculums(Reference Sunvold, Hussein and Fahey33). Secondly, soluble fibres, such as oligofructose, resulted in the highest organic matter disappearance, and total SCFA, propionate and acetate production, whereas cellulose, an insoluble fibre, was the least fermentable fibre source(Reference Sunvold, Fahey and Merchen34). However, to date, no data are available in cats on the fermentability of oligofructose and inulin with variable degree of polymerisation. The fermentability of oligofructose and inulin was also shown in vivo, as increased faecal excretion of SCFA, decreased faecal pH and increased faecal bacterial protein content were reported with increasing amounts of oligofructose or inulin added to the cats’ diet(Reference Hesta, Janssens and Debraekeleer35). The present trial showed indirect proof for fibre fermentability. Initially, total faecal production, faecal moisture content and faecal pH did not differ between the diets, which was consistent with the earlier observations. Hesta et al. (Reference Hesta, Janssens and Debraekeleer35) observed no differences for the amount of fresh faeces, and faecal pH was only reduced following ingestion of 6 % oligofructose, whereas lower levels did not change faecal pH(Reference Hesta, Janssens and Debraekeleer35). Faecal moisture content increased with 6 % oligofructose, but not with 3 %(Reference Hesta, Janssens and Debraekeleer35). In addition, the faecal excretion of SCFA was comparable between the diets. However, as up to 95 % of the produced SCFA are rapidly taken up and metabolised by colonic mucosal cells or absorbed to reach the systemic circulation, faecal amounts are only a very small proportion of the total SCFA production(Reference Roberfroid and Delzenne5, Reference Hesta, Debraekeleer, Janssens and Landlow36, Reference Roberfroid37). Furthermore, SCFA are only excreted in faeces due to an overload in the hindgut, when absorptive capacity is exceeded. Once again, the absence of an effect on SCFA excretion was also in line with the reports of Hesta et al. (Reference Hesta, Janssens and Debraekeleer35). Still, metabolic effects of oligofructose and inulin were investigated, without inducing unwanted negative effects on faecal characteristics due to the osmotic effect of SCFA(Reference Hesta, Debraekeleer, Janssens and Landlow36, Reference Roberfroid37). In addition, faecal crude protein content on DM basis and on as-is basis was higher in cats fed the HFF diet; yet, no differences were found in faecal bacterial protein and apparent N digestibility; which was in contrast with the reports of Hesta et al. (Reference Hesta, Hoornaert and Sales38). Consistent with the reports of Terada et al. (Reference Terada, Hara and Kato39), putrefactive compounds such as indole and p-cresol were reduced when the HFF diet was fed; yet, this reduction was NS. However, the higher plasma propionylcarnitine concentrations and their higher AUC when the HFF diet was fed, compared with the LFF diet, strongly suggest that oligofructose and inulin were indeed fermented in the feline intestine, leading to the production and absorption of propionate, which is consistent with the reports of Verbrugghe et al. (Reference Verbrugghe, Hesta and Gommeren15). Hence, faecal characteristics, faecal SCFA excretion and faecal bacterial protein have only limited reliability to produce evidence of SCFA production, whereas the analysis of the plasma acylcarnitine profile, especially propionylcarnitine concentrations, might be of much greater use to demonstrate the formation of absorbable SCFA. In the future, research on the relationship of the acylcarnitine profile with other techniques estimating bacterial mass, and with the classical method of bacterial culturing but also with novel molecular techniques which have been used as the golden standard, is warranted.
Plasma acylcarnitine profiles were also scrutinised as a reflection of the metabolites available for citric acid cycle. Metabolism of propionate generates propionyl CoA(Reference Rémésy, Demigné, Morand, Cummings, Rombeau and Sakata7). Since a rise of the concurrent acylcarnitine, i.e. propionylcarnitine, was observed before and following the meal and the AUC was also increased, increased propionyl CoA concentrations in cats fed the HFF diet were confirmed. Although propionyl CoA generates methylmalonyl CoA(Reference Rémésy, Demigné, Morand, Cummings, Rombeau and Sakata7), a concurrent rise of methylmalonylcarnitine was not observed in cats fed the HFF diet, compared with the LFF diet. Since catabolism of several amino acids, such as valine, methionine and isoleucine, also generates methylmalonyl CoA, the absence of increased methylmalonyl CoA levels might be due to a decreased catabolism of these amino acids. Both propionyl CoA and methylmalonyl CoA are specific inhibitors of pyruvate carboxylase, implying inhibited gluconeogenesis from pyruvate(Reference Anderson and Bridges8, Reference Blair, Cook and Lardy9). Inhibition of pyruvate carboxylase also occurs indirectly by depletion of acetyl CoA, a specific allosteric activator of this enzyme(Reference Anderson and Bridges8, Reference Blair, Cook and Lardy9). Yet, a decrease of acetylcarnitine, the corresponding acylcarnitine, in cats fed the HFF diet was not observed, most probably because acetyl CoA is generated from multiple sources, i.e. amino acids, lactate and fatty acids, and differences are thus not easy to discern. The lower plasma 3-hydroxy-3-methylglutarylcarnitine concentrations before and following the meal and decreased AUC for 3-hydroxy-3-methylglutarylcarnitine in cats fed the HFF diet corroborate the diminished amino acid-induced gluconeogenesis, since acylcarnitine is known to be a metabolite of branched-chain amino acid catabolism, especially that of leucine(Reference Roe, Millington and Maltby40).
Furthermore, N balance was evaluated. No differences in N intake, apparent N digestibility and faecal N excretion could be demonstrated, but urinary N excretion was lower when cats were fed the HFF diet. A possible explanation for this finding might be N trapping. Supplementation of fermentable substrate to the colon provides energy for colonic microflora, and in turn, the microflora utilise N for growth, thus trapping N in the form of bacterial protein. Furthermore, an osmotic effect in the small intestine might accelerate the transfer of urea into the distal ileum and the large intestine, leading to depressed urinary N excretion(Reference Howard, Kerley and Sunvold41, Reference Younes, Garleb and Behr42) and lower blood urea(Reference Younes, Garleb and Behr42, Reference Younes, Rémésy and Behr43). However, it has been suggested that when low-protein diets are fed, N will become the limiting factor for bacterial synthesis, and N trapping may be possible(Reference Howard, Kerley and Sunvold41, Reference Younes, Garleb and Behr42), whereas a high-protein diet when fed may exceed the capacity of oligofructose and inulin to trap N, thus disabling a reduction in urinary N excretion(Reference Howard, Kerley and Sunvold41). Yet, as no differences were demonstrated in apparent N digestibility, faecal N excretion and faecal bacterial protein content, N trapping is doubtful when adding fermentable fibre to a high-protein diet. As the net N balance was also higher in cats fed the HFF diet, more N was retained and therefore available for anabolism. However, since total urinary collection was not accurate, K was used as an internal marker for urinary production. Although the method was not validated with a reference method, the calculated urinary production was within normal limits ( < 50 ml/kg body weight per d)(Reference Grauer, Nelson and Couto44). The absence of any acidifying agent in the recipient for urinary collection might be a second limitation, as part of the N might have evaporated. Yet, we expect this evaporation to be similar between the diets. Furthermore, plasma urea and amino acid concentrations remained equal between the diets, suggesting the use of amino acids in other metabolic processes such as tissue preservation and immunity. At last, pre- and postprandial plasma glucose concentrations remained comparable between the diets as well, which is evident since the activity of the gluconeogenesis is suggested to be stable in cats, only the substrate for gluconeogenesis is altered.
In conclusion, addition of 4 % of a mixture of oligofructose and inulin to a high-protein diet resulted in a greater retention of N, and is suggested to diminish postprandial amino acid-induced gluconeogenesis by using propionate instead, which is generated from colonic fermentation. In this way, amino acids might be spared and used in other metabolic processes such as tissue preservation and immunity. However, demonstration of these effects by using stable isotope techniques is warranted.
Acknowledgements
The present study is within the scope of the postgraduate study of A. V., and was funded by the Institute for Promotion of Innovation through Science and Technology in Flanders (IWT-Vlaanderen), Belgium. Expenses for the laboratory analyses were covered by the Beneo-Group (Tienen, Belgium), which also provided the oligofructose and inulin mixture (Orafti HSI®). A. V. was responsible for the study design, study performance, characteristic analyses, data analyses and manuscript drafting. M. H., S. D. and G. P. J. J., all three promoters of A. V., contributed to the development of the study design and data analyses. K. P. was responsible for catheter placement and anaesthetising of the cats during catheter placement. L. V. was responsible for the analyses of putrefactive agents in faeces. B. W. and J. B. supervised the plasma analyses, and E. M. participated in the study performance. All authors contributed to manuscript drafting. The authors gratefully acknowledge Herman De Rycke for performing the proximate analyses of the foods, Inge Vaesen for the plasma analyses, and Sarah Depauw, Rebekka Hollebosch, Jantina Devylder and Steven Galle for animal care taking and technical assistance. It is declared by the corresponding author that no conflict of interest exists for the present paper.


