


Dietary fat plays an important role in healthy growth and development of children. It is a dense source of energy, which helps meet the high energy demands for rapid growth during childhood( Reference Butte 1 ). Dietary fat also provides PUFA, which are predominantly comprised of the n-6 fatty acid linoleic acid (LA; 18 : 2n-6) and the n-3 fatty acid α-linolenic acid (ALA; 18 : 3n-3). LA and ALA are essential fatty acids (EFA) because they cannot be synthesised by the body( 2 ). LA can be converted into the n-6 long-chain PUFA (LC-PUFA) arachidonic acid (20 : 4n-6), and ALA can be converted into the n-3 LC-PUFA EPA (20 : 5n-3) and DHA (22 : 6n-3). EFA and their LC-PUFA are important for numerous physiological processes in humans, such as the formation of new tissues and for visual and neural development and function( Reference Uauy, Hoffman and Peirano 3 ). Although LC-PUFA are not strictly essential, dietary intake of pre-formed n-3 LC-PUFA may be necessary to meet physiological requirements. This is because the conversion rate of ALA to EPA and DHA is generally limited in humans( Reference Brenna, Salem and Sinclair 4 ).
Besides the need of EFA and LC-PUFA for normal growth and development, they also play an important role in the prevention of CHD( Reference Mozaffarian, Micha and Wallace 5 ). Earlier reports have shown that dietary PUFA intakes of children in both developed and developing countries are suboptimal( Reference Harika, Cosgrove and Osendarp 6 , Reference Huffman, Harika and Eilander 7 ). A recent global review on fatty acid intake in adults reported that intakes of plant-based n-3 fatty acids (i.e. mainly ALA) are particularly low in Southeast Asia( Reference Micha, Khatibzadeh and Shi 8 ). However, reliable data on EFA intake are scarce. Yet, particularly in developing countries, where prevalence of undernutrition and of micronutrient deficiencies is high, children may have an increased risk of inadequate EFA intake. When total energy intake is low, EFA seem to be preferentially used for energy expenditure rather than for conversion to LC-PUFA( 9 ). Furthermore, deficiencies of Fe and Zn, which are needed as cofactors for the synthesis of LC-PUFA, may further limit the conversion rate of EFA( Reference Smuts, Tichelaar and van Jaarsveld 10 ).
Two cross-sectional studies among 300 and 1400 Indonesian adults from different Island groups and ethnicity reported mean PUFA intakes between 2·6 and 4·1 percentage of total daily energy (%E)( Reference Hanafiah, Karyadi and Lukito 11 ). This would mean that PUFA intake in Indonesian adults is 23–57 % below the WHO-recommended intake range of 6−11 %E( 2 ). No data on fatty acid intake in Indonesian children have been reported so far. Although dietary intake data are available from the recent Indonesian National Basic Health Survey (RISKESDAS 2010)( 12 ), the Indonesian food composition table lacks information on individual fatty acids( 13 ). Therefore, EFA intake could not be assessed before.
Therefore, the main objectives of this study were to investigate population intakes of fatty acids, particularly EFA in Indonesian children, and to compare these with FAO/WHO dietary reference intakes (DRI). A secondary objective was to determine the major dietary sources of fatty acids in this population.
Methods
Study design
Dietary intake data were derived from the most recent RISKESDAS conducted in 2010( 12 ). This cross-sectional study applied a random two-stage sampling approach based on election census blocks and households to ensure representativeness across the country’s thirty-three provinces. Informed consent to participate in the study for children younger than 15 years was obtained from their parent or guardian by means of a finger print or signature. Dietary intake was assessed using a single 24-h dietary recall, carried out by trained interviewers who queried parents about their children’s food and beverage intakes. The amount of food and beverages was assessed with the help of food models and using household measures. The protocol of the RISKESDAS study was approved by the Health Research Ethical Commission of the National Institute of Health Research and Development, Indonesia.
For the present secondary analysis, we used dietary intake data of 4–12-year-old children. Missing data on individual fatty acids in the Indonesian food composition table were complemented by chemical analyses of national representative food samples and by imputation of data from the US nutrient database.
Generation of fatty acid composition data by chemical analysis
On the basis of RISKESDAS 2010 intake data and the Indonesian food composition table, foods were rank-ordered according to their contribution to total PUFA intake across all children. Foods that cumulatively contributed to 95 % of total PUFA intake (n 118) as well as the reported two most-consumed fats (i.e. palm and coconut oil) were selected for chemical fatty acid analysis.
Food samples (i.e. prepared dishes, fresh foods or processed foods) were collected in August 2014 across thirteen provinces, representing geographical differences and 78 % of the population in Indonesia. For each food item, we collected samples in those provinces that contributed at least 5 % to the intake of that specific food. Per province, we collected multiple samples of a food item from different outlet sources and/or vendors, such as traditional markets, street vendors, canteens (at school), supermarkets or local mini-markets. For each food item, we then pooled the individual samples into one representative composite sample for chemical analysis. The composite samples were shipped on dry ice to the Netherlands, where SGS B.V. (Spijkenisse) analysed them.
Lipid extraction and quantification were performed by boiling a test portion with hydrochloric acid to free the occluded and bound lipids, filtrating the resulting mass, drying and extracting the fat retained on the filter with light petroleum according to ISO1443. Lipid trans-esterification and analysis of fatty acid methyl esters (FAME) were performed according to ISO 12966-2 (2011) and ISO 5508 (1990), respectively. FAME were separated by chain length and degree of unsaturation using a GC with flame ionization detection (Perkin Elmer clarus 500; PerkinElmer) with a 50-m column (Chrompack-Varian, type WCOT Fused Silica CP-SIL 88 for FAME; Agilent Technologies Netherlands B.V.) of 0·25-mm diameter and 0·20-µm film thickness. The temperature programme started at 80°C (1-min hold). The temperature was programmed first to 220°C, then to 240°C at a rate of 4°C/min and a 10-min hold. Injection was performed in the split mode with a split ratio of 1:50 and an injector temperature of 250°C. The injection volume was 1 μl. All measurements were conducted under ISO 17025-controlled conditions. Within- and between-assay precision was warranted by analysing one sample per series of ten in duplicate and by including three control samples in each assay (i.e. BCR 163, ICM 100 and ICM 79 (fish oil)), respectively. The quantification limit for individual fatty acids was approximately 0·001 mass per cent expressed as percentage of the extracted fat. When fatty acid values were converted to g/100 g of food, values of <0·005 were rounded to 0.
Data on total fat, total SFA, MUFA, PUFA and individual fatty acids derived from chemical analysis were included in the Indonesian food composition table. To ensure internal consistency of the nutrient data, we recalculated carbohydrate and energy content of these foods based on the new total fat values. Carbohydrate content was calculated by difference, and total energy was calculated as the sum of metabolisable energy from carbohydrates, protein and fat( 14 ). To distinguish major dietary sources of fatty acids, we split the nutrient composition of chemically analysed fried foods into nutrients from cooking oil and nutrients of the food itself. As the type of cooking oil was not specified in the RISKESDAS data, a standard nutrient composition for cooking oil was defined, as the weighted average of nutrients from palm oil and coconut oil, in a ratio of 82:18, according to the per capita supply of these oils in Indonesia( 15 ). The amount of cooking oil absorbed in fried foods was estimated based on local data( Reference Hardinsyah 16 ).
Imputation of fatty acid composition data from the US nutrient database
Another 151 foods, together contributing an additional 4 % to children’s cumulative PUFA intake, were matched to similar foods in the US nutrient database( 17 ), according to FAO/International Network of Food Data Systems (INFOODS) guidelines( 18 ). Values of individual fatty acid content, as well as for total PUFA, SFA and MUFA content of these matched foods, were imputed into the Indonesian food composition table. Where total fat content in the US and Indonesian nutrient database differed, fatty acid values from the US database were adjusted proportionally to match the original total fat content stated in the Indonesian database. The US nutrient database in many cases reports 18 : 2 and 18 : 3 fatty acids, but not specifically LA (cis-9,cis-12-18 : 2n-6) and ALA (cis-9,cis-12,cis-15-18 : 3n-3). In these cases, ALA and LA values were estimated based on the average ratio of LA: 18 : 2 (i.e. 0·99) and ALA: 18 : 3 (i.e. 0·92) in the chemically analysed Indonesian food samples.
For the remainder of the Indonesian foods, which together contributed <1 % to children’s total PUFA intake, values for LA, ALA, EPA and DHA contents were set to 0.
Data analysis
The food composition database was built using SAS software (version 9.4; SAS Institute Inc.); statistical analyses were performed using SAS and IBM Statistics for Windows (version 21.0; IBM Corp.). All the analyses were carried out using RISKESDAS 2010 sampling weights to adjust the data to the actual socio-economic and urban–rural distribution in the total Indonesian population. Total fat and fatty acid intakes were examined in g/d and as %E for all children, per sex, age group, parental education level and across Indonesia’s major island groups. As the distribution of intakes was skewed, we report median values and the 10th and 90th percentiles instead of means and standard deviations. Nutrient adequacy ratios of fat and fatty acid intakes were calculated by dividing median intakes by the lowest or upper (for SFA) intake level as recommended by the Food and Agriculture Organization & World Health Organization( 2 ). FAO/WHO recommends a minimum intake level for LA of 2·5 %E and for ALA of 0·5 %E to prevent EFA deficiencies for >95 % of the population. Recommended intake levels for total PUFA are higher – that is, 6−11 %E – because these are based on optimal intake to prevent chronic diseases (in particular CHD), as are the age-dependent minimum recommended intake levels for EPA+DHA of 150−250 mg/d( 2 ). Besides the recommended intake levels, Food and Agriculture Organization & World Health Organization( 2 ) also defined an adequate intake level (AI) for PUFA as the estimated minimum intake of total PUFA necessary to prevent EFA deficiency – that is, 2·5 %E.
In this study, we estimated the percentage of populations with intakes below or above FAO/WHO-recommended and adequate intake levels. For LA, we also estimated the prevalence of insufficient intake as the percentage of children with intakes below the estimated average requirement (EAR) of <2·0 %E( 2 , Reference Murphy and Poos 19 ). The percentage contribution of various food groups to the intake of total fat and fatty acids was calculated as population proportion – that is, by dividing the amount of fat or fatty acids provided by one food group by the total amount from all food groups across the total population( Reference Krebs-Smith, Kott and Guenther 20 ).
Results
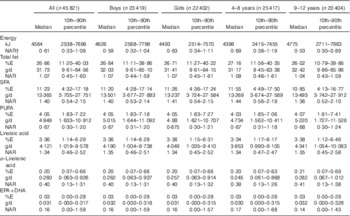
A total of 45 821 4–12-year-old children with available dietary intake data from the RISKESDAS 2010 survey were included in the secondary analysis. The study population had a mean age of 8·1 (sd 2·44) years and included stunted, overweight and underweight children (Table 1). The median household expenditure in the children’s families was 1 806 403 Indonesian Rupiah (approximately 123 US$) per month, of which 1 068 107 Indonesian Rupiah (approximately 73 US$) were spent on food. The median energy intake in this population was 4564 kJ/d (i.e. 1091 kcal/d) (Table 2). Carbohydrates provided most of the energy, that is, 59·7 %E, proteins provided 12·7 %E and median intake of total fat was 26·7 %E. With 4·05 %E from PUFA, the children’s median PUFA intake was 67 % of the lowest amount of intake recommended by FAO/WHO (i.e. 6 %E). In particular, median intake of n-3 fatty acids was low compared with FAO/WHO recommendations – that is, 40 % of the lowest recommended intake level for ALA and 16 % for EPA+DHA. The median SFA intake of 11·23 %E exceeded the upper recommended intake level of 8 %E for children by 40 %. Total fat and fatty acid intakes were similar in boys and girls, both in absolute amounts and as %E. Excess SFA intake was higher in 4–8-year-old children and children of highly educated parents than in 9–12-year-old children or children of low-educated parents. Total fat and fatty acid intakes (in g/d and as %E) varied considerably across geographical regions, with highest intakes (except for EPA+DHA) observed in Java and the lowest in Papua (online Supplementary Table S1). Additional information on children’s intakes per major Indonesian island and level of parental education is provided in online Supplementary Tables S1 and S2.
Table 1 Characteristics of the sample of children included in the study and as weighted towards the national Indonesian population (Percentages)
* Stunting is defined as height-for-age Z-score <−2sd compared with World Health Organization( 21 ) standard growth curves, data are based on children with available data on height (n 44 472).
† Thinness, overweight and obesity are defined as BMI-for-age Z-score <−2sd, >1sd and >2sd, respectively, compared with World Health Organization( 21 ) standard growth curves, data are based on children with available data on body weight (n 44 338).
Table 2 Energy, total fat and fatty acid intakes and nutrient adequacy ratio (NAR) in 4–12-year-old Indonesian childrenFootnote * (Medians and 10th–90th percentiles)
Although median total fat and LA intakes were largely in line with the FAO/WHO-recommended intake range, 44·2 % of children had a total fat intake below the lowest recommended intake level (i.e. <25 %E), and 31·0 % of children had an LA intake below the lowest recommended intake level (Fig. 1). The estimated prevalence of insufficient LA intake (below the EAR of 2·0 %E) was 21·4 %. ALA intakes were below the lowest recommended intake level in 84·0 % of children. For PUFA and EPA+DHA, intakes were below the lowest recommended intake levels for prevention of future heart disease (i.e. <6 %E) in 80·6 and 80·9 % of children, respectively. In addition, 18·8 % of children had a PUFA intake that was below the AI for prevention of EFA deficiency at the population level of <2·5 %E.
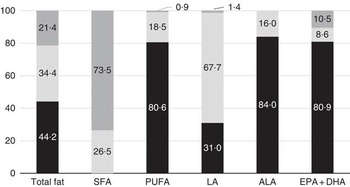
Fig. 1 Percentage of Indonesian children with total fat or fatty acid intakes below (![]() ), at (
), at (![]() ) or exceeding (
) or exceeding (![]() ) Food and Agriculture Organization/World Health Organization(
2
) recommendations. Data are based on a single 24-h recall. ALA, α-linolenic acid; LA, linoleic acid.
) Food and Agriculture Organization/World Health Organization(
2
) recommendations. Data are based on a single 24-h recall. ALA, α-linolenic acid; LA, linoleic acid.
The major dietary sources of total fat, SFA, PUFA and LA were oils and fats (Table 3). Vegetable dishes contributed the most to ALA intake, as did fish for EPA+DHA intake. In addition, legumes and cereals, especially tempeh, tofu and rice, were important sources of PUFA. The contribution of food groups to EFA intake was similar in boys and girls. In older children, legumes and vegetables contributed relatively more to LA and ALA intake, whereas in younger children snacks, eggs and milk contributed relatively more (data not shown). The contribution of different food groups to PUFA intake varied considerably between the different island groups. The largest variation was observed for the food groups legumes/nuts/seeds, vegetables and fish (online Supplementary Fig. S1).
Table 3 Percentage contribution of different food groups to fat and fatty acid intakes among Indonesian childrenFootnote *
LA, linoleic acid; ALA, α-linolenic acid.
* Data are based on a single 24-h recall.
Discussion
This study is the first to describe the intake of EFA in Indonesian children. It indicates that a majority of Indonesian children had intakes of PUFA and specifically ALA that were lower than FAO/WHO-recommended intake levels. Total fat and LA intakes may be suboptimal in a smaller but yet considerable proportion of children.
One of the strengths of this study is that it used intake data of a large sample of children from the most recent nationally representative dietary survey in Indonesia. In addition, data on the fatty acid composition of foods were based on chemical analyses of representative samples of a broad range of Indonesian foods, covering 95 % of children’s total PUFA intake. By imputing fatty acid values for another 151 Indonesian foods from the US nutrient database, we were able to conduct a more comprehensive assessment of children’s dietary EFA intake.
An important limitation of this study is that dietary intake data were based on a single 24-h recall. Although a single 24-h recall is suitable to provide a good estimate of mean or median intakes in large populations, multiple days of recalls are needed to estimate the distribution of usual intake in a population( Reference Thompson and Subar 22 ). Owing to day-to-day variation in dietary intake, the distributions of intakes based on a single day’s food measurement are wider than distributions of habitual average intake. This affects the estimate of the proportion of the population with intakes below or above a certain recommended level( Reference Murphy and Poos 19 ). As the observed median intakes of total PUFA, ALA and EPA+DHA were below FAO/WHO recommendations, and as the distribution of true average habitual intake will be more narrow (i.e. closer to the median) than intake measure on a single day, there will in reality be a higher percentage of children with intakes not meeting the recommended level for these fatty acids. Likewise, the percentage of children with habitual SFA intakes who exceed the recommended upper intake level of 8 %E can be expected to be underestimated in our study. Fig. 2 shows the observed intake distributions for total PUFA and SFA, based on a single 24-h recall, in the context of FAO/WHO recommendations.
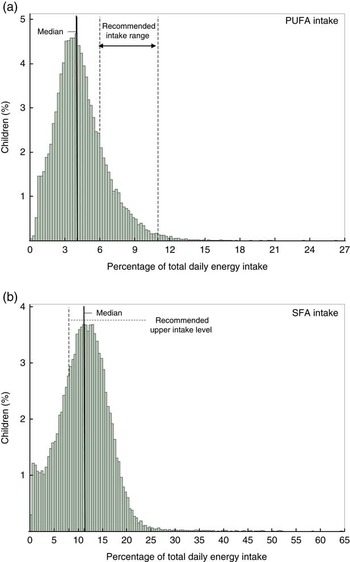
Fig. 2 Distribution of Indonesian children’s intake of (a) total PUFA and (b) SFA. Data are based on a single 24-h recall in the context of Food and Agriculture Organization/World Health Organization( 2 )-recommended intake levels.
Another general limitation of self-reported intake of dietary fat is under-reporting( Reference Thompson and Subar 22 , Reference Scagliusi, Ferriolli and Lancha 23 ). The degree of under-reporting seems less in developing countries than in developed countries, and under-reporting increases in parallel with westernisation and the current nutritional transition in developing countries( Reference Scagliusi, Ferriolli and Lancha 23 ). In our study population, the median reported energy intake was 4564 kJ/d – that is, 61 % of the age-and sex-specific FAO/WHO intake recommendation for these children( 24 ). This is similar to what other studies in Indonesian children and adults have reported( Reference Jati, Widmer and Purwestri 25 , Reference Sekiyama, Roosita and Ohtsuka 26 ). Furthermore, we expressed the intake of total fat and fatty acids as %E, which reduced potential bias from unselective under-reporting( Reference Thompson and Subar 22 ).
The present study did not take into account potential seasonal variation in dietary intake, as data on both dietary intake and food samples for chemical analysis were collected in the dry season only. Although in Indonesia little seasonal variation in dietary intake patterns is expected, the fatty acid composition of the foods vary per season, depending on, for example, environmental conditions or maturity( Reference Greenfield and Southgate 27 ).
As the RISKESDAS survey did not provide dietary intake data at the ingredient level of mixed dishes, it was not possible to split nutrient intake from such dishes into nutrient intake from their constituting food ingredients. The food group vegetable dishes and soups that consisted mainly of mixed dishes had a high contribution to PUFA intake. Conceivably, non-vegetable ingredients such as cooking oil, soya or meat may be the major PUFA sources in these mixed dishes.
Our findings on fatty acid intake are in line with studies from other developing and developed countries that indicate poor quality of fat and fatty acid intakes in children( Reference Harika, Cosgrove and Osendarp 6 , Reference Huffman, Harika and Eilander 7 ). A global review reported that mean PUFA intakes are in most countries below recommendations, whereas mean SFA intake mostly exceed the recommended maximum level( Reference Harika, Cosgrove and Osendarp 6 ). Another review on EFA intake in children in developing countries found that ALA intake in particular was lower than the recommended levels, although available data were scarce( Reference Huffman, Harika and Eilander 7 ). Similar to our findings, in many low-income countries, vegetable fats and oils, as well as cereals, are the most important sources of PUFA( Reference Michaelsen, Dewey and Perez-Exposito 28 ).
EFA are necessary for normal growth and development of children; EFA deficiency results in clinical visual and neurological abnormalities and poor growth( 2 , 29 ). Our study shows that many Indonesian children have ALA and LA intakes below the recommended levels that are set to prevent EFA deficiencies. Nevertheless, part of these children may still satisfy their individual EFA requirements and not necessarily suffer from clinical EFA deficiency. To assess the prevalence of inadequate nutrient intake in a population, the EAR rather than the recommend intake level, which by definition exceeds the requirements of most individuals, is the appropriate DRI to use( Reference Murphy and Poos 19 ). However, little data are available to determine the precise requirements of EFA in healthy people. Although an EAR of 0.2 %E is set for LA by Food and Agriculture Organization & World Health Organization( 2 ), an EAR is not available for ALA, and consensus about defining EAR values for EFA is lacking( 2 , 29 ).
Once requirements are met, there is little evidence that higher intakes of EFA or pre-formed EPA+DHA in children older than two years of age have additional benefits for improved growth or mental development( 2 , 29 ). Regardless, a higher intake of PUFA does have beneficial effects on blood lipids( Reference Mensink, Zock and Kester 30 ), and replacing dietary SFA with PUFA reduces the risk of CHD( Reference Mozaffarian, Micha and Wallace 5 ). In this light, it is worrisome that the vast majority of Indonesian children had intakes of PUFA and SFA that were not in line with recommendations to prevent future heart disease. Eating patterns and CHD risk factors are established in childhood and adolescence and tend to track through to adulthood. Therefore, a life-course approach is most effective for the prevention of non-communicable chronic diseases( Reference Aboderin, Kalache and Ben-Shlomo 31 ). Public health authorities should provide practical and understandable food-based dietary guidelines, stimulating production and consumption of local foods high in PUFA, and particularly those that are high in n-3 fatty acids. Soyabean and rapeseed oil are common vegetable oils with high PUFA and relatively high ALA contents. Partial replacement of palm and coconut oil in the Indonesian kitchen by soyabean oil could have a large impact on PUFA intake and improve dietary fat quality of Indonesian children as well as adults. Considering affordability and taste, soyabean oil seems to be a realistic option, because it is also a major accepted edible oil in other Asian low-income countries( Reference Michaelsen, Dewey and Perez-Exposito 28 ).
In our study, 44·2 % of Indonesian children had total fat intakes below the recommended intake range, whereas at the same time 21·4 % of children exceeded this range. A too low total fat intake may be associated with risk of poor growth as well as with inadequate fat-soluble vitamin and mineral intakes( Reference Butte 1 , 2 ). Unlike for fatty acid composition, there is no evidence for a relationship between total amount of dietary fat intake and risk of CHD( 2 ). Thus, public health measures should give priority to promoting the intake of foods rich in PUFA and limiting the intake of SFA.
In conclusion, this study indicates that a majority of Indonesian children has intakes of PUFA and specifically ALA that are lower than the recommended intake levels. Total fat and LA intakes may be suboptimal for a smaller yet considerable proportion of children. Public health initiatives should provide practical guidelines to promote consumption of PUFA-rich foods.
Acknowledgements
The authors thank the Indonesian Ministry of Health for providing the dietary intake data of the RISKESDAS 2010 survey, the students and staff from Bogor Agricultural University, who collected the food samples and prepared them for chemical analysis, as well as SGS Netherland B.V., who carried out the chemical analysis of the food samples. The authors also thank Wagianto Andriyani and Nur Azizah Rachman from Unilever Indonesia, who provided local nutritional support.
Unilever R&D Vlaardingen, the Netherlands, funded this study. Researchers employed by Unilever R&D were involved in the design of the study, supervised the food sampling and food-matching activities, led the statistical analysis, the interpretation of the findings and the preparation of the manuscript.
N. N., A. O.-H., U. G., P. L. Z. and A. E. are employees of Unilever R&D. Unilever markets food products including margarines and other fat-based foods containing PUFA as well as SFA. R. D., R. N. and A. S. via the University of Indonesia, and the Agricultural University of Bogor received general honoraria/consultancy fees for their work related to this study paid by Unilever R&D.
The author contributions were as follows: R. D. and A. E. formulated research questions; N. N., R. D., A. S., U. G. and A. E. designed the study; R. N. and A. S. coordinated and carried out food sampling; A. O.-H. managed the databases; N. N., A. O.-H. and U. G. performed the statistical analyses; N. N., R. D., U. G., P. L. Z. and A. E. interpreted the results; and N. N. wrote the article.
Supplementary material
For supplementary material/s referred to in this article, please visit http://dx.doi.org/doi:10.1017/S0007114515004845


