


Type 2 diabetes mellitus (T2DM) is a complex, chronic illness requiring continuous care with multifactorial risk-reduction strategies beyond glycaemic control. Ongoing patient self-management education and support are critical to prevent acute complications and reduce the risk of long-term complications. Significant evidence exists that supports a range of interventions to improve diabetes outcomes(1).
Persistent hyperglycaemia can cause toxicity by three distinct mechanisms: protein glycation, hyperosmolality and increased intracellular sorbitol levels. These events in the long term are responsible for complications such as diabetic retinopathy, renal failure, hypertension, stroke, acute myocardial infarction, peripheral vascular disease, lower limb amputations, etc. The goal for good glycaemic control is based on fasting blood glucose <110–130 mg/dl and postprandial glycaemia <140–180 mg/dl of blood associated with HbA1c <7 %. Glycaemic control can be assessed through HbA1c, since it reflects the mean glucose concentrations in the previous 2–4 months(2).
Body weight loss favours glycaemic control and metabolic profile improvement(2). The traditional treatment for weight loss is based on the ingestion of energy-restricted diets(2). Apparently, a successful treatment depends on the incorporation of educational practices capable of empowering individuals with diabetes to adopt a nutritionally adequate diet(Reference Reis, von Muhlen and Miller3,Reference Alvarez and Zanella4) and healthy lifestyle habits(2,Reference Oliveira, Júnior and Vencio5) .
The Brazilian Diabetes Society and the American Diabetes Association emphasise the role of dietary macronutrients in T2DM glycaemic control, giving little prominence to micronutrients(2,Reference Oliveira, Júnior and Vencio5) . Among the micronutrients, Ca seems to favour T2DM prevention and treatment(Reference Tremblay and Gilbert6). However, Ca consumption is lower than the Institute of Medicine recommendations (1000 mg/d)(7). In a systematic review, across the seventy-four countries with data, average national dietary Ca intake ranges from 175 to 1233 mg/d. Many countries in Asia have average dietary Ca intake lower than 500 mg/d. Countries in Africa and South America mostly have low Ca intake between about 400 and 700 mg/d. Only Northern European countries have national Ca intake higher than 1000 mg/d. The global Ca map reveals that many countries have low average Ca intake(Reference Balk, Adam and Langberg8). Results from epidemiological studies demonstrate an inverse association between dietary Ca v. body adiposity, insulin resistance (IR), T2DM and systemic arterial hypertension(Reference Marques-Vidal, Gonçalves and Dias9,Reference Eilat-Adar, Xu and Loria10) . On the other hand, the results of randomised clinical trials(Reference Thompson, Holdman and Janzow11–Reference Jones, Eller and Parnell13) and of a systematic review that includes clinical trial and observational studies(Reference Pittas, Lau and Hu14) are controversial. Therefore, the objective of the present study was to evaluate the effect of increased consumption of Ca from fat-free milk, combined with an energy-restricted diet and the implementation of education activities in the metabolic control.
Methods
Subjects
Subjects were recruited after contacting the local public health care users by phone, as well as through announcements in the local radio, newspapers, sound car, besides distribution of pamphlets and informative posters fixed in pharmacies, health care units, among other places of interest. Twenty overweight subjects with T2DM, of both sex, and with low habitual Ca intake were eligible for the study.
The present study was conducted according to the Declaration of Helsinki guidelines, and all procedures involving human participants were approved by the Committee of Ethics in Human Research of the Federal University of Viçosa/Brazil. Written informed consent was obtained from all subjects. The present trial was registered at www.clinicaltrials.gov (ID NCT02377076).
Inclusion and exclusion criteria
We included overweight T2DM individuals who had clinical signs of the metabolic syndrome(Reference Alberti, Eckel and Grundy15); Ca intake <600 mg/d; mild-to-moderate physical activity (PA) level; dietary restraint <14(Reference Stunkard and Messick16); were pursuing a diet and taking oral hypoglycaemic (Metformin) for glycaemic control and were between 20 and 60 years old. Individuals who were smokers; using Ca, vitamin D and Mg supplements or medications that affect these micronutrient metabolism in the previous 6 months; using insulin or medications, herbs or diets for body weight reduction; on oestrogen replacement therapy; gained or lost at least 5 kg or changed their level of PA (LPA) in the previous 3 months; had aversion or intolerance to the foods provided in the study; consumed more than two doses of alcohol/d; reported to have eating disorders; had endocrine, renal or hepatic diseases or to have recurrent renal lithiasis history; consumed >1250 mg of caffeine/d; were pregnant or lactating and were anaemic were excluded from the study.
Experimental design
This was a twelve consecutive week crossover study, with a 60-d washout between groups. Subjects were allocated in random order in one of the two experimental groups: control (CONT) or dairy (DAIR). Energy-restricted diets (–500 kcal/d; –2092 kJ/d) containing 800 mg of dietary Ca/d were prescribed. The prescribed diets had similar proportion of macronutrients, besides vitamin D, Mg and fibre contents. During the intervention, breakfast drinks (CONT – without the addition of Ca sources or DAIR – 700 mg of Ca originated from fat-free milk) were consumed in laboratory. The other meals were consumed under free-living conditions. To increase the subjects’ awareness about the importance of eating a nutritionally adequate diet and to encourage adherence to the prescribed diet, group education activities were conducted during the study. The education activities’ contents were similar for both groups. Subjects were instructed to maintain the LPA constant throughout the study.
Before the beginning of the educational activities and at the end of the study, questionnaires were applied. Biochemical variables (blood concentrations of Arsenazo Ca, ionised Ca, P, glucose, uric acid, TAG, total cholesterol and fractions, total proteins, γ-glutamyl transferase, alanine aminotransferase (ALT) and aspartate aminotransferase, Mg, alkaline phosphatase, Hb1Ac, insulin, vitamin D and parathyroid hormone (PTH), besides homeostasis model assessment of IR) were also assessed at baseline and at the end of the study. Habitual food intake (FI) was evaluated before the beginning of the study. Blood pressure, FI, LPA, body composition (body fat % and fat free mass) and anthropometry (body weight, waist and hip circumference (WC and HC), sagittal abdominal diameter, waist:hip ratio) were evaluated at baseline and on days 45 and 90 (Fig. 1). All evaluations were performed by trained nutritionists, according to recommended techniques, using standardised and validated tools.

Fig. 1. Flow chart of the assessments conducted during the crossover study. Habitual food intake (HFI) was assessed before random allocation of the subjects to control (CONT) and dairy (DAIR) groups. Biochemical variables (BV), physical activity (PA) level, anthropometry (ANT), body composition (BC), food intake (FI), Diabetes Knowledge Assessment (DKN-A) and diabetes self-care (Diabetes Self-Care Activities Questionnaire (DSCQ)) were assessed at baseline, and on day 90. BV, ANT, BC and FI were also assessed on day 45. There was a 60 d washout period between the study groups.
Food intake assessment
Habitual FI was assessed using a validated quali-quantitative FFQ(Reference Ribeiro and Cardoso17). For each item in the questionnaire, subjects reported their habitual frequency of consumption (daily, weekly or monthly) and the portion size consumed in the previous 6 months. FI was assessed at baseline and after 12 weeks of each experimental session by 3-d dietary records (two week days and on a weekend day)(Reference Cintra, Von der Heyde and Schmitz18). Dietary recording days were not predefined by the investigators.
Subjects were trained to keep free-feeding dietary records. To improve the quality of the information collected, a photographic album containing photos of different food portions was used(Reference Monteiro and Chiarello19). Each dietary record was reviewed with the subjects to ensure accuracy and completeness. Household measures registered in the dietary records were converted to grams and energy; Ca and dietary fibre intakes were analysed using Diet Pro software (version 5.5i®). The software database was based on the 4th edition of the Brazilian food composition table and the United States Department of Agriculture National Nutrient Database National Reference Standard(20,21) .
Energy-restricted diets prescription
An energy-restricted diet (–500 kcal/d; –2092 kJ/d) containing 800 mg of dietary Ca/d was prescribed. Diets were prescribed according to the American Diabetes Association nutrition recommendations(1) and considering the nutritional composition of the breakfast shakes provided during the study.
Breakfast drinks
Six different types of drinks, containing frozen fruit pulps of various flavours or chocolate powder, were created to offer the lowest Ca content (CONT) or 700 mg of Ca from fat-free milk (DAIR). DAIR drinks were prepared adding water to fat-free milk powder. Water, whey protein, vitamins D, C, A, Fe and sodium chloride were added to prepare CONT drinks, so that it would present similar macronutrients, vitamins and sodium content as the DAIR drink. The order of the flavours offered was the same in both groups. The drinks provided in both groups did not differ in terms of energy, carbohydrate, protein, fat, dietary fibre or vitamin D contents. They differed only in terms of Ca, Mg and P contents (Table 1).
Table 1. Nutritional composition of the breakfast drinks daily consumed by the subjects, according to the experimental groups (Mean values and standard deviations)

* P < 0·05 by Student’s t test or Wilcoxon test.
† To convert kcal to kJ, multiply by 4·184.
Nutrition education activities
Validated questionnaires were applied to assess the subjects’ knowledge about diabetes and self-care, besides assessing their basic knowledge regarding the role of the ingested diet for glycaemic control(Reference Michels, César Coral and Sakae22,Reference Torres, Virginia and Schall23) . Subjects were also asked about their history of overweight, behaviours adopted for glycaemic control and difficulties encountered. This information was used to guide the topics covered in the education activities and the types of education materials used in educational activities.
The nutrition activities were held in weekly meetings lasting one and a half hour, with an interval of 7 d between each meeting, in which participatory lectures, group dynamic techniques and ludic activities took place. Explanatory folders about different topics were created and distributed in each meeting:
Topic 1 – Food digestion and absorption. Transportation of nutrients in the blood;
Topic 2 – Diabetes dietary treatment, and control;
Topic 3 – Diet: How to have a better life if you have diabetes;
Topic 4 – Importance of Ca and vitamin D in type 2 diabetes control;
Topic 5 – Food labelling, diet and light foods;
Topic 6 – Self-care, medication, diabetes monitoring, and signs of complications.
The activities were conducted according to the Brazilian diabetic education guidelines and were based on the following results:
Immediate: increase knowledge;
Intermediate: developing approaches that lead to behavioural change;
Post-intermediate: clinical and metabolic improvement;
Long-term: health status and quality of life improvement, reducing chronic complications.
During the education activities, subjects were encouraged to participate actively through discussions/debates and to ask questions on the topics discussed. Each meeting was repeated one more time during the study, so that everyone could participate. At the end of each meeting, the subjects were individually invited to evaluate the quality of the discussed content. This evaluation was conducted using illustrative faces that represented each subjects’ feelings (satisfied, dissatisfied or with doubts) towards these activities, which were deposited in a box. The topic discussed in the following meetings was adjusted based on that evaluation. Attendance of subjects to education activities was controlled through an attendance sheet. At the end of the six meetings, all the subjects were presented with a book titled: Diabetes, diet and special recipes(Reference Alfenas, Queiroz and Bittencourt24), to stimulate the consumption of a healthy diet and to stimulate the adoption of adequate life habits.
Learning assessment
Learning in response to the education activities was quantified by comparing the data obtained before (baseline) and after each session period (3, 8 months) using the Diabetes Knowledge Assessment(Reference Torres, Virginia and Schall23) and Diabetes Self-Care Activities Questionnaire translated and adapted for the Brazilian culture(Reference Michels, César Coral and Sakae22).
Physical activity assessment
The LPA was assessed using the long format of the International Physical Activity Questionnaire, validated for the Brazilian population(Reference Pardini, Matsudo and Araújo25), considering the habitual time spent on daily PA. Subjects who scored ≥150 min in 1 week were classified as physically active. Those with scores <150 min were classified as irregularly active. These scores were calculated using the equation: LPA = moderate PA + (vigorous PA × 2). The LPA was classified according to the recommendations of Haskell et al.(Reference Haskell, Lee and Pate26).
Anthropometry and body composition
Body weight was assessed on a digital platform scale, with a resolution of 0·5 kg (Toledo®, Model 2096PP/2), while subjects were barefoot and wearing lightweight clothing. Height was measured to the nearest 0·1 cm, using a wall-mounted stadiometer (Wiso). Both were assessed according to Jelliffe(Reference Jelliffe27).
WC and HC were assessed using a flexible and inelastic measuring tape. WC was evaluated in the standing position in four distinct anatomical regions: immediately below the last rib, smallest WC, midpoint between the last rib and the iliac crest and just before the iliac crest(Reference Wang, Thornton and Bari28). HC was measured in the largest prominence between the waist and the thighs(29).
Neck circumference was measured at the midpoint of the neck(Reference Ben-Noun and Laor30). Sagittal abdominal diameter was measured with an abdominal caliper (Holtain Kahn Abdominal Caliper®) in the same four distinct anatomical regions where WC was evaluated(Reference Wang, Thornton and Bari28). During the evaluation, the participant remained in the supine position, with knees bent(Reference Richelsen and Pedersen31).
Body composition (body fat %, and lean mass) was evaluated using the Electric Bioimpedance method (Biodynamics model 310). All procedures were followed according to the manufacturer’s instructions.
Blood pressure
Blood pressure was assessed in both arms, using an automatic Omron HEM-7200 device (Omron Inc.), in duplicate. The first assessment was conducted after 5 min of rest; the second, 20 min after the first. For these assessments, subjects were sitting with their legs uncrossed and feet resting on the floor, with back resting on the chair and relaxed, the arm distended at the level of the heart, with palm facing up and elbow slightly flexed(32). A systolic blood pressure (SBP) higher than 130 mmHg and/or a diastolic blood pressure (DBP) higher than 85 mmHg was classified as high, according to the 6th Brazilian Guidelines on Hypertension(32). Subjects with a SBP >130 mmHg and/or a DBP > 85mmHg or under drug treatment to control blood pressure were considered hypertensive(Reference Alberti, Eckel and Grundy15).
Biochemical assessments
After 10–12 h of fasting, the subjects reported to the laboratory to assess the concentrations of PTH, vitamin D, calcium Arsenazo III, fasting blood glucose and insulin, HbA1c, uric acid, TAG, total cholesterol and fractions, albumin, P, total proteins, ALT, aspartate aminotransferase, γ-glutamyl transferase, Mg and alkaline phosphatase. Blood was collected by a nursing technician using disposable materials.
PTH concentrations were evaluated by the electrochemiluminescence method (Elecsys-Modular E-170, Roche Diagnostics Systems). Vitamin D concentrations were determined by CMIA Chemiluminescent Microparticle Assay (Architect i2000, Abbott Diagnostics). Total Ca concentrations were evaluated by the arsenazo III method (Mira Plus, Roche Diagnostic Systems), and ionic Ca was estimated by the equation: ionised Ca (mg/dl) = 6 × total Ca (mg/dl) – (albumin (g/dl) + (0·19 × total protein)/3)/(albumin (g/dl) + (0·19 × total protein (g/dl)) + 6)(Reference Pottgen33).
Glycaemia was assessed by the glucose oxidase method in the automated device Glucose Analyzer 2 (Beckman Instruments, Inc.). Insulinaemia was assessed using the solid-phase RIA method and Coat-a-Count® kits from Diagnostic Products Corporation. IR was determined according to Matthews et al.(Reference Matthews, Hosker and Rudenski34): homeostasis model assessment of IR = fasting insulinaemia (mU/l) × fasting glycaemia (mmol/l)/22·5, considering homeostasis model assessment of IR values lower than 2·71 as adequate(Reference Geloneze and Tambascia35).
Plasma TAG, total cholesterol and fractions, P, total proteins, ALT, aspartate aminotransferase, γ-glutamyl transferase and Mg concentrations were assessed by the colorimetric enzymatic method. Alkaline phosphatase was assessed by the kinetic method and albumin by the bromocresol green method. HbA1c was assessed based on the differences in the ionic load HPLC. Uric acid was dosed using the colorimetric assay.
Statistical analyses
Statistical analyses were conducted using SPSS software (SPSS Inc., 2008), version 20.0. Descriptive statistics were presented as mean values and standard deviation. The Shapiro–Wilk test, at 5 % of significance, was applied to evaluate data normality. Statistical analyses of the data within each session were conducted using the paired t test for the variables with normal distribution and the Wilcoxon test for the variables that did not have normal distribution. We used one-factor ANOVA test for repeated measures with Bonferroni post hoc to detect differences in the anthropometry and body composition data of the subject within each session (pre-intervention, 45 and 90 d after the intervention). Paired t test (parametric) or Wilcoxon rank sum (non-parametric) test was used to detect differences between treatment deltas at the times evaluated, with Bonferroni correction for two comparisons (0·05/2 = 0·025 to consider statistical significance). The education activities questionnaires data were analysed by the Friedman test for intra-session comparison at baseline, 3 and 8 months after the intervention. Wilcoxon test with Bonferroni correction for multiple comparisons was used for post hoc analysis, adopting a P < 0·025. For the other analyses, P < 0·05 was considered as statistically significant.
Results
Of the twenty subjects who were initially eligible to participate in the study, six dropped out or were excluded for several reasons (difficulty to daily attend the laboratory for breakfast, medication change, moved to another town, increased LPA, lack of motivation to continue in the study after the 2-month washout period). Therefore, a total of fourteen subjects completed all study groups. The present study had a statistical power equivalent to 80 % to result in a 7 % reduction in our subjects’ baseline mean WC value(Reference Mera, Thompson and Prasad36).
Characteristics presented by the subjects at baseline
Seven of the subjects were pre-obese, three had class I obesity and two had class II obesity. Only two subjects were eutrophic. However, all subjects had the metabolic syndrome. The majority of them (n 10) were women, were 49·5 (sd 8·6) years old and had a BMI of 29·9 (sd 4·4) kg/m2. The majority of them (n 9) were married, had 2·2 children (n 10) and complete high school (n 6). The baseline characteristics of the study subjects are presented in Table 2. The characteristics did not differ between groups.
Table 2. Anthropometry, body composition and biochemical data at baseline, according to experimental group* (Mean values and standard deviations)
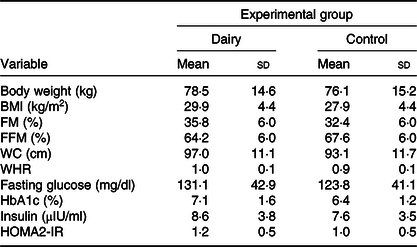
FM, fat mass; FFM, free-fat mass; WC, waist circumference; WHR, waist:hip ratio; HbA1c, glycated Hb; HOMA2-IR, homeostasis model assessment-2 of insulin resistance.
* Calculated from simple Student’s t test (or Mann–Whitney) for comparing baseline in each experimental group.
Food intake
Subjects habitually consumed less than 390 mg of Ca/d in the DAIR group. Ca and dietary fibre intake increased in DAIR. There was an increase in energy intake and a reduction in dietary fibre intake in CONT on day 90 compared with baseline. When the inter-group deltas were compared, DAIR had a higher Ca and dietary fibre consumption in the intervals between 0–45 and 0–90 d than CONT. There were no inter-groups statistical differences in the deltas obtained in the interval between 45 and 90 d analyses (Table 3).
Table 3. Calcium, energy and dietary fibre consumption for the dairy (n 14) and control (n 14) groups* (Mean values and standard deviations)

a P < 0·05 compared with baseline (intra-groups).
b P < 0·025 compared with dairy group (inter-groups).
* Vitamin D consumption is not described above because its content in foods was not available in DietPro® software or in food labels. However, vitamin D intake between groups was probably similar, since we added vitamin D to the control drink so that it would have the same amount present in the dairy drink. Data obtained on days 0, 45 and 90 of the intervention were analysed by repeated-measures one-factor ANOVA with post hoc Bonferroni (variables with normal distribution). Data between groups were analysed using t test, considering the delta values (final value − initial value) obtained between the times with Bonferroni correction for multiple comparisons.
† To convert kcal to kJ, multiply by 4·184.
Learning through nutrition education activities
There was an increase in the score obtained in the second (3 months) and third (8 months) evaluations using the Diabetes Knowledge Assessment and the Diabetes Self-Care Activities Questionnaire (Table 4).
Table 4. Scores obtained in the questionnaires at baseline, 3 and 8 months of nutrition education activities involving type 2 diabetics (n 14) (Mean values and standard deviations)

DKN-A, Diabetes Knowledge Assessment; QAD, Diabetes Self-Care Activities Questionnaire.
The Friedman test was applied for intra-groups comparison at baseline, 3 and 8 months after nutrition education activities. Wilcoxon test with Bonferroni correction for multiple comparisons was used for post hoc analysis (P = 0·05/2 = 0·025).
* After 3 months compared with baseline (P < 0·025).
† After 8 months compared with baseline (P < 0·025).
Medication and physical activity
The LPA and the medication used during the study remained constant.
Anthropometry and body composition
The results of the intra-group analyses pointed out that body fat % increased and fat-free mass % decreased in CONT comparing days 45–90 and 0–90. While body weight decreased comparing days 0–45; there was a decrease in body fat %, WC and sagittal abdominal diameter in the four points assessed, neck circumference, SBP and DBP; fat-free mass increased comparing days 0–45 and 0–90; HC decreased in all evaluation intervals 0–45, 45–90 and 0–90 d and waist:hip ratio decreased in the 0–90 d evaluation in DAIR (Table 5).
Table 5. Anthropometric variables, body composition and blood pressure during the study, according to experimental group (n 14 in each group)* (Mean values and standard deviations)

a P < 0·05 compared with baseline (intra-session).
b P < 0·05 compared with 45–90 d (intra-groups).
c P < 0·025 compared with dairy session (inter-groups).
* Data obtained in different times (0, 45 and 90 d of intervention) were analysed through repeated-measures one-factor ANOVA with Bonferroni post hoc (variables with normal distribution) or Friedman’s test (variables without normal distribution). Data between groups were analysed using t test considering the delta values (final value – initial value) between Bonferroni correction times for multiple comparisons (variables with normal distribution) or the Mann–Whitney U test with Bonferroni correction for comparisons (variables without normal distribution).
The results of the inter-group analyses indicated a reduction in DAIR than in CONT in the following variables: body fat %, WC, HC, neck circumference (0–45 d), WHR, sagittal abdominal diameter in the four points measured, DBP (0–90 d) and SBP, besides an increase in fat-free mass % (0–45 and 0–90 d) (Table 5).
Biochemical assessments
Serum concentrations of total cholesterol, LDL-cholesterol, ALT, uric acid, Hb1Ac and PTH reduced, and vitamin D concentrations increased after 90 d in DAIR. On the other hand, the concentrations of uric acid, alkaline phosphatase and total proteins increased, while vitamin D concentrations decreased after 90 d in CONT (Table 6). In the inter-step evaluation, the DAIR uric acid, fasting glucose, Hb1Ac, PTH and ALT concentrations reduced and vitamin D concentration increased after 90 d in DAIR compared with CONT (Table 6).
Table 6. Biochemical variables, according to experimental group session (n 14 in each group session)* (Mean values and standard deviations)
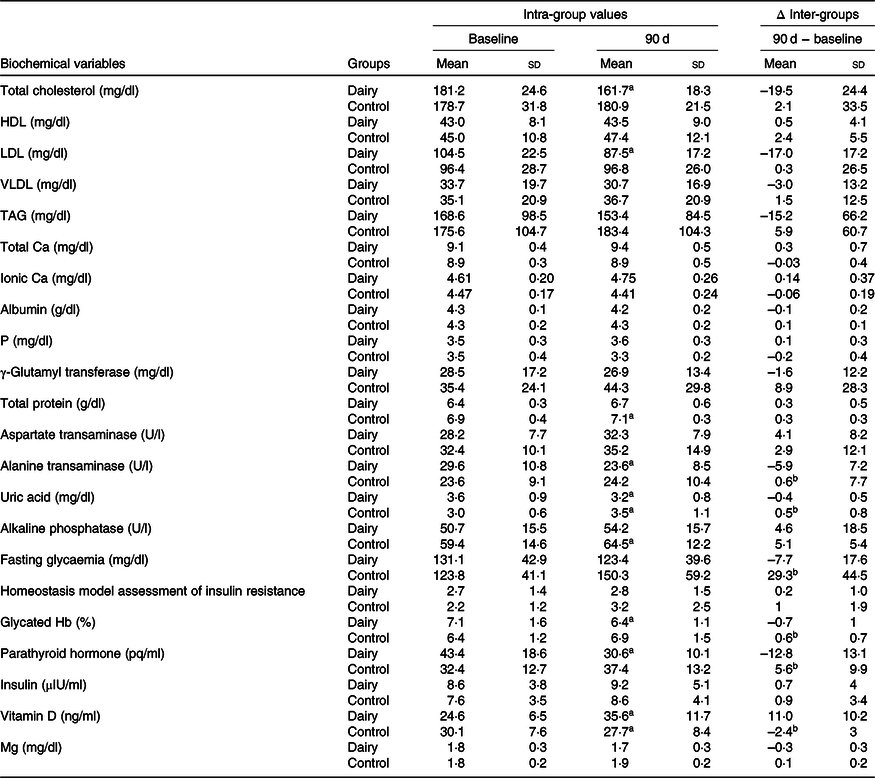
a Statistically significant compared with baseline (intra-groups) (P < 0·05).
b Difference compared with DAIR session (inter-groups).
* Data at baseline and after 90 d of intervention were analysed by paired t test (variables with normal distribution) or Wilcoxon test (variables without normal distribution) (P < 0·05). Data between sessions were analysed through deltas using Bonferroni correction for multiple comparisons using Student’s t test (variables with normal distribution) or Mann–Whitney U test (variables without normal distribution) (P < 0·025).
Discussion
At baseline, our subjects had a mean Ca intake equivalent to 431·4 (sd 182·7) mg/d. Ca consumption is lower than the Institute of Medicine recommendations (1000 mg/d)(7). The global Ca map reveals that many countries have low average Ca intake(Reference Balk, Adam and Langberg8). Low Ca consumption may favour increased body adiposity mainly in the abdominal region, which in turn affects glucose metabolism, causing IR, T2DM and high blood pressure(Reference Heaney37,Reference Torres, Francischetti and Genelhu38) . The consumption of 1000–1200 mg of Ca/d may be an useful strategy to prevent chronic non-communicable diseases(Reference Crispim, Ribeiro and Panato39), by reducing lipogenesis and increasing lipolysis(Reference Zemel, Shi and Greer40).
In addition to reducing abdominal fat (WC, sagittal abdominal diameter, HC), a mean ingestion of about 1200 mg Ca/d (DAIR) for 90 d in the present study was able to reduce body fat % and increase fat-free mass % compared with the ingestion of about 500 mg/d (CONT). The role of Ca consumption on body composition was assessed in 186 African American female adolescents, 11–18 years old and a BMI greater than or equal to the 85th percentile for age and sex. A higher percentage of body fat was observed in those with a lower habitual Ca intake (<314 mg/d) compared with those that had higher Ca intake (≥634 mg/d)(Reference Tylavsky, Cowan and Terrell41).
Body fat % and lean body mass reductions are usually observed in response to the consumption of energy-restricted diets, which occurs because body fat and lean mass are used as energy source in response to the energetic deficit(Reference Savi, de Salles and Zeni42,Reference Triffoni-Melo, Suen and Resende43) . Higher serum total protein concentrations were observed in response to CONT, reinforcing the hypothesis of fat-free mass use as energy source. However, in our study, body fat increased in response to CONT. The reason for that body fat increase is not clear and should be further investigated. On the other hand, there was an increase in lean mass and a reduction in fat percentage in response to DAIR. Considering that muscle tissue is metabolically more active than adipose tissue, the preservation of lean mass may favour the maintenance of the lost weight(Reference Triffoni-Melo, Suen and Resende43) by the study participants. Therefore, we can hypothesise that the energy restriction associated with increased fat-free milk consumption may be a useful strategy to avoid weight regain after traditional dietary treatments for weight loss.
Even though the energy intake did not differ between groups, DAIR led to a higher weight loss than CONT that may have occurred as a result of Ca binding to the fat consumed, causing the formation of insoluble Ca soaps(Reference Jacobsen, Lorenzen and Toubro44), thus reducing the energy source from fat ingested in DAIR. Lower total cholesterol and LDL serum concentrations were also observed in that group, which may also reflect the effect of Ca binding to the consumed fat. It is also worth noting that the increase in dietary fibre intake may favour satiety increase, FI reduction and consequently body weight reduction. A 10 g increase in dietary fibre consumption per d may lead to a body weight reduction of only about 39 g/year(Reference Du, Van Der and Boshuizen45). Thus, despite a higher mean dietary fibre consumption at the end of DAIR compared with CONT (increase of about 7 g/d after DAIR and reduction of about 4 g/d after CONT), the significant difference in weight loss after these two groups (5 kg after DAIR and 1·2 kg after CONT) excludes the possibility that this difference in dietary fibre consumption is the only one responsible for the effect verified.
The results of the studies demonstrate that a low Ca intake (<600 mg) may cause a greater influx of Ca into the adipocytes. This increase would be mediated by the increase in serum PTH and vitamin D concentrations in order to increase the intestinal absorption of that mineral(Reference Da Silva, Torres and Sanjuliani12,Reference Torres, Francischetti and Genelhu38) . Excess Ca within the adipocytes activates the enzyme fatty acid synthase and inhibits hormone-sensitive lipase, stimulating lipogenesis, inducing body fat accumulation, increasing body weight and causing IR, T2DM and high blood pressure in the long term(Reference Da Silva, Torres and Sanjuliani12,Reference Zemel, Shi and Greer40,Reference Torres and Sanjuliani46) .
Vitamin D insufficiency in the body is also considered a risk factor for obesity. Vitamin D is also responsible for stimulating pancreatic cells’ insulin secretion. Its deficiency is associated with increased IR and the metabolic syndrome(Reference Holick, Binkley and Bischoff-Ferrari47–Reference Loya-López, Godínez-Gutiérrez and Chiquete49). In the present study, serum PTH concentrations decreased after DAIR compared with CONT. However, most subjects had insufficient serum vitamin D concentrations (21–29 ng/ml) when they were allocated in DAIR. After DAIR, these concentrations reached adequate concentrations(Reference Loya-López, Godínez-Gutiérrez and Chiquete49) that may explain the observed differences in body fat and glycaemic control after each session.
In the present study, Hb1Ac and fasting glycaemia reduced in DAIR compared with CONT that effect may prevent the manifestation of diabetes-associated complications(2). While Hb1Ac reduced 0·7 % in DAIR, it increased 0·6 % in CONT. According to the Diabetes Control and Complications Trial, and UK Prospective Diabetes Study, a reduction of 1 % in Hb1Ac reduces the chances of any outcome related to diabetes complications(50,51) . Since Hb half-life ranges from 2 to 4 months, Hb1Ac concentration should be evaluated at every 4 months(2). Therefore, if our study lasted more than 90 d, the observed reduction in Hb1Ac concentration would probably be even lower.
It is possible that the glycaemic profile improvement verified in our study was due to the fact that DAIR significantly reduced adiposity, especially in the abdomen (WC and SAD reductions), leading to a reduction in IR. However, although serum insulin concentrations and homeostasis model assessment of IR were numerically lower in DAIR, the values obtained did not reduce significantly.
In the study by Nikooyeh et al.(Reference Nikooyeh, Neyestani and Farvid52), ninety excess body weight subjects with diabetes, 30–60 years old, were allocated in three groups for 12 weeks: (1) yogurt without vitamin D + 150 mg of Ca; (2) yogurt 12·50 μg of vitamin D + 150 mg of Ca; (3) yogurt 12·50 μg of vitamin D + 250 mg of Ca. There was a decrease in WC, glycated Hb, glycaemia and BMI in the groups fortified with vitamin D. Thus, the beneficial effects verified in the study were attributed to vitamin D and not to Ca. However, considering that vitamin D is required for proper intestinal Ca absorption, it is possible that the beneficial effects of Ca were only evidenced when that vitamin deficiency was reversed. These results also suggest that in subjects with diabetes that present low habitual Ca consumption (<700 mg/d) receiving vitamin D supplementation (12·50 μg/d), 150 mg of Ca/d may be as effective as 250 mg/d in the glycaemic control.
In our study, subjects consumed about 500 mg of Ca at baseline. Our test drinks contained 3·50 μg of vitamin D. However, the addition of 700 mg/d of Ca derived from fat-free milk in the DAIR session led to better glycaemia, Hb1Ac concentration and anthropometric variables (weight, SAD, HP, WC and WHR). Vitamin D plays a central role in several mechanisms such as increased insulin secretion(Reference Nikooyeh, Neyestani and Farvid52) and increased intestinal Ca absorption(Reference Holick, Binkley and Bischoff-Ferrari47). However, Ca is involved in other metabolic mechanisms such as increased lipolysis(Reference Zemel, Shi and Greer40), decreased intestinal absorption of fat(Reference Jacobsen, Lorenzen and Toubro44) and decreased hyperuricaemia(Reference Barbosa, Brandão and Pozzan53). Therefore, considering that vitamin D deficiency is quite common in the general population(Reference Schuch, Garcia and Martini54), it is important to guarantee vitamin D supplementation in adequate quantities to the subjects of studies of that nature.
Blood pressure decreased significantly during the DAIR compared with CONT. Similar results were observed in other studies, where the higher consumption of Ca (>1200 mg/d) derived predominantly from fat-free milk products resulted in lower blood pressure(Reference Torres, Francischetti and Genelhu38,Reference Stancliffe, Thorpe and Zemel55) . That effect may be associated with a decrease in serum uric acid concentrations(Reference Pinheiro56) after DAIR. Increased uric acid in the bloodstream may lead to decreased nitric oxide synthase production, which is responsible for vasodilation(Reference Choi and Ford57). There is a close relationship between dairy consumption and decreased uricaemia(Reference Barbosa, Brandão and Pozzan53,Reference Choi and Ford57) . Some components present in fat-free milk products (Ca, protein and lactose) can both decrease uric acid production and increase its urinary excretion(Reference Penido, Diniz and Guimarães59). Although our subjects had uric acid concentrations within the normal range, DAIR resulted in lower serum concentrations than CONT. Thus, the increase in fat-free milk consumption may prevent the manifestation of metabolic changes related to uric acid concentrations increase such as cardiometabolic accidents, IR, high blood pressure and the metabolic syndrome(Reference Barbosa, Brandão and Pozzan53).
It is estimated that a reduction of 3 mmHg in systolic pressure can reduce mortality from stroke by up to 8 % and mortality from coronary diseases by 5 %(Reference Whelton, He and Appel60). After 90 d of DAIR, SBP and DBP reduced 16·0 and 10·8 mmHg, respectively. According to the UK Prospective Diabetes Study a reduction of 10 mmHg in SBP may promote a 13 % decrease in the risk of progression to any microvascular complications related to type 2 diabetes(Reference Adler, Stratton and Neil61).
At baseline, our subjects had aspartate aminotransferase, γ-glutamyl transferase, ALT, alkaline phosphatase and albumin concentrations within the normal range. These enzymes can be used to assess hepatic function(Reference Lira, Oliveira and Escrivão62). While DAIR resulted in lower serum ALT values, CONT led to increased alkaline phosphatase in the intra-groups analyses. Hepatic steatosis, diabetes and obesity are the most common causes of moderate elevations of the previously mentioned enzymes in the bloodstream(Reference Lira, Oliveira and Escrivão62). Although we did not evaluate the occurrence of hepatic steatosis, we believe that, in addition to having favoured a better glycaemic control, the higher fat-free milk consumption may have contributed to reduce fat content in the liver, since we observed body fat reduction, mainly in abdominal region of our subjects.
The higher consumption of dairy products did not increase serum P concentrations nor PTH concentrations(Reference Kemi, Kärkkäinen and Rita63). In contrast, PTH concentrations decreased in DAIR compared with CONT, demonstrating a beneficial effect in response to the increased fat-free dairy products consumption, but did not affect serum total Ca, ionic Ca and Mg concentrations.
In the present study, the education activities improved our subjects’ life habits, besides favouring the consumption of a better quality diet, and the fixation of the transmitted knowledge. The presence and active participation of our subjects in the group education activities increased their awareness about the quality of the consumed diet on type 2 diabetes control. That fact was demonstrated by the results obtained after the application of the knowledge (Diabetes Knowledge Assessment) and self-care (Diabetes Self-Care Activities Questionnaire) questionnaires, which were reapplied at 3 and 8 months (considering the 2 months of washout) after the beginning of the study, in order to verify knowledge fixation. There was an increase in the score obtained in the Diabetes Knowledge Assessment after the intervention and in the Diabetes Self-Care Activities Questionnaire after 3 and 8 months. The increase in these scores demonstrated an increase in knowledge about the disease and fixation of that knowledge by the subjects, besides the increase in the awareness about the beneficial effects of the consumption of a healthy diet, of frequent feet examination to check for abnormalities and of frequently checking inside the shoes before putting them on to make sure there are no insects or poisonous animals. It has been suggested that the conduction of nutrition education activities favours dietary adequacy(Reference Reis, von Muhlen and Miller3,Reference Alvarez and Zanella4) . The nutritional education of people with diabetes is essential to treat the disease and to prevent the occurrence of associated complications. Therefore, education activities adherence and learning the acquired knowledge is one of the challenges for a successful treatment(2).
Conclusion
The results obtained in the present study suggest that the increase in the Ca consumption derived from fat-free milk associated with energy restriction may favour T2DM metabolic control. We verified that compared with a habitual consumption of about 500 mg of Ca/d, the consumption of about 1200 mg of Ca/d (about three to four servings of fat-free milk) resulted in decreased body fat %, WC, HC, sagittal abdominal diameter, neck circumference, blood pressure, fasting glycaemia, besides serum uric acid, Hb1Ac, PTH and ALT concentrations, and in increased fat-free mass and vitamin D concentrations. The implementation of education activities resulted in better knowledge about care regarding the disease, which may be useful to prevent T2DM complications.
Acknowledgements
The authors thank Fundação de Amparo à Pesquisa do Estado de Minas Gerais (FAPEMIG, Brazil), Coordenação de Aperfeiçoamento de Pessoal de Ensino Superior (CAPES, Brazil) and Conselho Nacional de Desenvolvimento Científico e Tecnológico (CNPq, Brazil) for the RCGA’s Research Productivity Grant.
J. A. C., J. M. G. G. and R. C. G. A. formulated the research question, designed the study, carried it out, analysed the data and wrote the article. P. V. M. R. assisted in the article writing.
The authors declare that there are no conflicts of interest.


