


Epidemiological studies clearly show that a high intake of insoluble fibre is associated with a low risk for CVD and diabetesReference Jenkins, Kendall, Axelsen, Augustin and Vuksan1–Reference Schulze, Liu, Rimm, Manson, Willett and Hu3. Beneficial effects of insoluble dietary fibre are also discussed in the context of consumption of whole grain, containing further bioactive compounds such as polyphenols, antioxidants or vitamins. As another potential mechanism for the beneficial effects of dietary fibre, fermentation processes in the colon are discussed resulting in the production of SCFAReference Venter, Vorster and Cummings4, Reference Thorburn, Muir and Proietto5. Polyphenols have been shown to reduce food intake, to lower leptin concentrationsReference Kao, Hiipakka and Liao6 and to promote fat oxidation in ratsReference Klaus, Pultz, Thone-Reineke and Wolfram7. Recently, we showed that the consumption of a polyphenol-rich insoluble dietary fibre preparation from carob pulp (Ceratonia siliqua L; carob fibre) acutely decreased postprandial TAG and NEFA concentrations, while increasing fat oxidation during a liquid meal challenge testReference Gruendel, Garcia, Otto, Mueller, Steiniger, Weickert, Speth, Katz and Koebnick8. Elevated circulating TAG and NEFA play a key role in the development of insulin resistanceReference Blaak9. Impaired whole body insulin resistance is characterized by a lowered ability of skeletal muscle to oxidize fatty acidsReference Blaak9. Therefore, functional foods lowering circulating NEFA by increasing fat oxidation might be of interest for the prevention and treatment of diabetes and obesity.
Obesity is the result of a positive energy balance. Among peripheral hormones regulating energy balance, the orexigenic ghrelin and the anorexigenic leptin are of special interestReference Ahima, Prabakaran, Mantzoros, Qu, Lowell, Maratos-Flier and Flier10–Reference Gil-Campos, Aguilera, Canete and Gil15. Ghrelin is synthesized and secreted mainly from the fundic region of the stomach and stimulates food intakeReference Korbonits, Goldstone, Gueorguiev and Grossman16. It has been proposed that ghrelin secretion in man is directly regulated by leptin restraintReference Kalra, Ueno and Kalra17. Leptin is a hormone that is predominantly secreted by adipose tissueReference Zhang, Proenca, Maffei, Barone, Leopold and Friedman18, Reference Friedman and Halaas19, but it is also synthesized and secreted in the stomach by fundic glandsReference Bado, Levasseur and Attoub20. Approximately 25 % of circulating leptin is originated from the stomachReference Sobhani, Bado and Vissuzaine21. Leptin is primarily involved in energy homeostasis and satiety. Leptin concentrations in the circulation are increased in proportion to fat mass and circulating leptin conveys information to the hypothalamus regarding the amount of energy stored in adipose tissue, suppressing appetite and affecting energy expenditureReference Kalra, Bagnasco, Otukonyong, Dube and Kalra12. Recently, we reported that the consumption of carob fibre was associated with an acute decrease in acylated plasma ghrelin during a liquid meal challenge testReference Gruendel, Garcia, Otto, Mueller, Steiniger, Weickert, Speth, Katz and Koebnick8. However, no information is available about delayed effects of carob fibre on acylated and total ghrelin and its effects on leptin secretion.
The aim of the study was to investigate delayed effects of carob fibre consumption on: (1) fasting levels; (2) postprandial response of glucose, insulin, NEFA, TAG, leptin and total and acylated ghrelin concentration. We also investigated whether carob consumption is associated with fermentation processes in the colon resulting in the production of SCFA.
Methods
Study design and subjects
This was a randomized crossover trial with two sessions lasting 300 min each, separated by intervals of at least 1 week. Nineteen healthy adults were recruited. Exclusion criteria were history of chronic diseases, dyslipidaemia, impaired glucose tolerance, intentional weight loss within 3 months prior to the study, extreme sports, history of chronic alcohol abuse and any medication influencing glucose or lipid metabolism. The Ethics Committee of the University of Potsdam approved the study protocol. Written informed consent was obtained from all participants before starting the study.
Habitual alcohol intake
A semi-quantitative, self-administered 4-d food record was used to assess alcohol intake of the study participants. The assessment was conducted three times and the results of the three food records (three × 4 d) were averaged. Trained staff delivered the record and subjects were instructed to record their entire food intake at the time of consumption. Alcohol intake was coded on the basis of the German Food Code and Nutrient Data Base BLS II.322. The accuracy and validity of energy intake estimated by the food record was validated against total energy expenditure estimated by doubly labelled water techniqueReference Koebnick, Wagner and Thielecke23.
Body composition
Anthropometric data of the participants were collected at the beginning of the study. Body weight was assessed using an electronic calibrated scale to the nearest 0·1 kg (Soehnle, Murrhardt, Germany). Body height was determined with a GPM anthropometer (Siber & Hegner, Zurich, Switzerland) to the nearest 0·1 cm. BMI was calculated as body weight (kg)/ height (m)2.
Dietary intervention
On the day preceding the blood sampling sessions (day 1), foods with or without a total of 50 g carob fibre were provided in a randomized order containing a total energy of 6228 v. 6279 kJ (Table 1). Carob fibre, a preparation from carob pulp (Caromax, Nutrinova, Frankfurt, Germany), contained (g/100 g): 5·8 simple carbohydrates; 5·2 protein; 0·2 fat. The total fibre content was 74·6 g per 100 g carob fibre preparation corresponding to 68·4 g insoluble and 6·2 g soluble fibre. The content of water-soluble polyphenols of the preparation was 2·84 g per 100 g; the content of extractable polyphenols by organic solvents was 0·39 g per 100 gReference Owen, Haubner, Hull, Erben, Spiegelhalder, Bartsch and Haber24. The major polyphenol compounds of carob fibre were gallic acid, gallotannins and flavonol glycosidesReference Owen, Haubner, Hull, Erben, Spiegelhalder, Bartsch and Haber24.
Table 1 Composition of the dietary intervention and total dietary intake of the day preceding the blood sampling‡
(Mean values with their standard errors)
* P < 0·05 between treatments.
† Including all foods consumed (i.e. standardized foods provided and additional free-choice foods).
‡ For details of subjects and procedures, see Methods.
The participants were able to distinguish between meals containing carob fibre v. placebo by taste and colour. However, laboratory staff were not informed about the treatments of participants. Participants were advised to consume the foods provided for breakfast, dinner and lunch. Participants were allowed to consume additional foods but the additional foods had to be the same in both treatments. Foods rich in polyphenols, such as red wine, olive oil or cacao products, were not allowed. Dietary intake was assessed using an estimated food recordReference Koebnick, Wagner and Thielecke23.
In the morning of study day 2 after a 10 h overnight fast, subjects consumed 103 g standardized white bread within 5 min. The energy content of the white bread was 1027 kJ with a nutrient content of 50·0 g carbohydrates, 7·7 g proteins, 1·5 g fat and 2·9 g dietary fibre.
Blood sampling and analyses
On study day 2, an indwelling catheter was inserted into an antecubital vein of the subjects and blood samples were collected before and 15, 30, 45, 60, 75, 90, 120, 150, 180, 210, 240, 270 and 300 min after consumption of the standardized bread. On each session, a total of 180 ml blood was collected. Postprandial measurements were made within a 300-min time period to ensure complete meal absorption independent of the carob fibre enrichment as a routine procedure comparable with other studiesReference Blom, Stafleu, de Graaf, Kok, Schaafsma and Hendriks25.
For serum separation, blood was collected in tubes containing a serum clot activator and allowed to clot. To obtain plasma, blood was collected in EDTA-containing tubes and immediately processed. Serum and plasma tubes were centrifuged at 1500 g for 10 min at 4°C and supernatants were obtained and stored at − 40°C until analysis. For measurement of total and acylated ghrelin, plasma was collected in tubes containing EDTA and 500 U Aprotinin (Bayer, Leverkusen, Germany) per ml whole blood. For stabilization, plasma supernatant was acidified with 1 mmol/l HCl and then stored at − 40°C.
Plasma total ghrelin was measured by a commercial RIA, which utilizes 125I-labelled ghrelin and a ghrelin antiserum to determine the concentration of total ghrelin in plasma by a double antibody/polyethylenglycol technique (GHRT-89HK; Linco Research, St. Charles, MO, USA). The sensitivity of the method was 93 pg/ml. There was no cross-reaction with ghrelin 1-10, motilin-related peptide, glucagon, leptin or insulin. The intra- and inter-assay CV were 10·0 % and 14·7 %, respectively. Recovery was calculated as 96 %.
Plasma active ghrelin determination was performed using RIA (GHRA-88HK, Linco Research) that utilizes 125I-labelled ghrelin as a tracer and an antibody (raised in guinea pigs) that is specific for the biological active form of ghrelin with the octanoyl group on serine 3. The sensitivity of the method was 7·8 pg/ml. There was no cross-reaction with ghrelin 14–28, motilin-related peptide, glucagon, leptin or insulin. The intra- and inter-assay CV were 6·7 % and 9·6 %, respectively. Recovery was calculated as 114 %.
Plasma glucose was measured in duplicate by the hexokinase method using commercially available colorimetric reagents (ADVIA® 1650 Chemistry System; GLUH, Bayer, Leverkusen, Germany) with an intra-assay CV of 1·2 %.
Serum insulin was determined by ADVIA Centaur Immunoassay (Bayer) with an intra-assay CV of 2·6 %.
Plasma TAG were analysed using the enzymatic colorimetric agents TRIG for the ADVIA® Chemistry System 1650 (Bayer). The intra-assay CV was 1·2 %.
Serum NEFA were analysed using an enzymatic colorimetric method (ASC-ACOD method; Wako Chemicals, Neuss, Germany) with an inter-assay CV of 2·7 %.
Leptin concentration in serum was measured using an immunofluorometric assay as described previouslyReference Wu, Bidlingmaier, Liu, De Souza, Tschop, Morrison and Strasburger26. Microtitre plates coated with anti-leptin mAb 4D3 (500 ng/well) were washed and standards or samples were pipetted into each well together with 50 ng biotinylated anti-leptin mAb 6D9 in 0·175 ml assay buffer. After an overnight incubation at 4°C, the plates were washed and streptavidin-europium was added. After an additional incubation for 30 min, plates were washed again, enhancement solution was added and the signal measured after 15 min using the DELFIA (Wallac, Turku, Finland). Within assay variability (CV %) was 7·4 %, 4·3 % and 5·6 % at leptin concentrations of 0·8 ng/ml, 2·5 ng/ml and 15·3 ng/ml, respectively. Between assay CV % at the same concentrations was 8·3, 5·2 and 5·9 %, respectively.
Serum total cholesterol was analysed using the CHOD/PAP method (ABX Diagnostics Cholesterol; ABX Diagnostics, Montpellier, France) with an intra-assay CV of 0·8 %.
Serum HDL-cholesterol was analysed using a colorimetric test (ABX Diagnostics HDL Cholesterol Direct; ABX Diagnostics) with an intra-assay CV of 1·3 %. LDL-cholesterol was calculated according to FriedewaldReference Friedewald, Levy and Fredrickson27.
Breath hydrogen analysis
To control for dietary compliance, air breath samples were collected as a marker of colonic fermentation before and 30, 60, 90, 120, 150, 180, 210, 240, 270 and 300 min after consumption of the standardized bread on day 2 and measured using a Breath Hydrogen Analyzer (Quintron Model-12i-Microlyzer; Quintron Instruments, Milwaukee, WI, USA). All subjects were capable of producing breath H.
Determination of SCFA
For estimation of SCFA using GC, suspensions prepared from fresh faeces, obtained from the two defecations following day 1, were mixed with water (material/water 1:5 wt/vol.) and homogenized and SCFA were determined as described previouslyReference Dongowski, Lorenz and Proll28. The GC system (Hewlett-Packard, Waldbronn, Germany) consisted of a HP gas-chromatograph 5890 Series II, HP 7673 GC/SFC Injector, HP GC Auto Sampler Controller, Detector FID and Software-HP Chemstation. He gas was used as the carrier. The intra- and inter-assay CV were 1·6 % and 2·0 %, respectively.
Statistical analyses
All statistical analyses were performed using SPSS for Windows 11.5 (SPSS Inc., Chicago, IL, USA). Baseline characteristics are shown as means and standard deviations. All other data are shown as means with their standard errors. Fasting concentrations on the day subsequent to the consumption of foods enriched with and without 50 g carob fibre were compared by paired samples t test. Time series data for total and acylated ghrelin and serum leptin were shown as absolute values and normalized to baseline values, which was defined as time 0 min. Absolute responses to standardized bread were tested by a mixed linear model with subject as random factor and time, carob concentration and carob concentration × time as fixed factors. Statistical differences in the response of the blood parameters during the examinations were analysed using ANOVA. A probability P < 0·05 was considered as significant.
Pearson correlation coefficients were calculated for each subject between total and acylated plasma ghrelin and other biomarkers with and without placebo treatment. Individual coefficients of correlation were averaged and 5 % CI were calculated after correction with Fisher's z transformation.
Results
General characteristics and dietary intervention
The study population consisted of nine males and ten females. One subject had a BMI >26 kg/m2. None of the subjects showed a fasting glucose >6·1 mmol/l (Table 2). Total energy and nutrient intake at day 1 was similar in both treatments (Table 2).
Table 2 Baseline characteristics of participants*
(Mean values and standard deviations for nine males and ten females)
* For details of subjects and procedures, see Methods.
Colonic fermentation and SCFA
The day subsequent to the consumption of foods enriched with a total of 50 g carob fibre, fasting breath H concentrations were significantly higher than the day after consumption of control foods, indicating an enhanced colonic fermentation (57 (sem 9) v. 34 (sem 6) ppm; P = 0·032; Fig. 1), indicating good compliance of the participants. During the postprandial phase, breath H concentrations decreased rapidly (P = 0·001). Faecal concentrations of acetate, butyrate, proprionate and n-valerate as well as total SCFA were similar after carob fibre and control (data not shown).
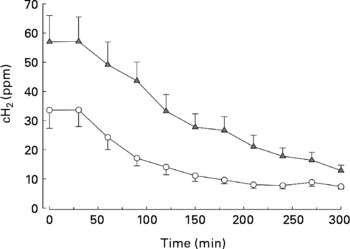
Fig. 1 Postprandial breath H concentrations (cH2) after consumption of standardized bread on the day subsequent to the consumption of foods enriched with 50 g carob fibre (–▲–) or control (–○–) foods. cH2 were significantly higher after consumption of carob fibre compared with control (P < 0·001). For details of subjects and procedures, see Methods.
Fasting blood levels and postprandial response
Consumption of carob fibre the previous day did not significantly affect fasting plasma glucose, TAG and serum NEFA (Table 3), but resulted in higher plasma glucose (P = 0·029) and lower plasma TAG (P = 0·033) and serum NEFA (P < 0·001) responses after bread ingestion (Fig. 2). Fasting serum insulin and postprandial response of serum insulin to bread ingestion were similar after consumption of foods with or without carob fibre.
Table 3 Fasting blood concentrations of participants on the day subsequent to the consumption of foods enriched with 50 g carob fibre or control foods (day 2)*
(Mean values with their standard errors for nineteen participants)
* For details of subjects and procedures, see Methods.
Significance of paired samples t test is given. HOMA-IR, Homeostasis Model Assessment of Insulin Resistance.
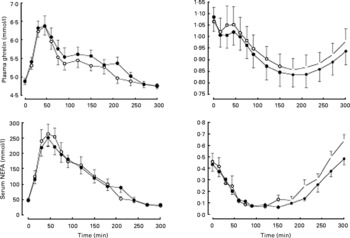
Fig. 2 Postprandial response of plasma glucose, serum insulin, plasma TAG and serum NEFA after consumption of standardized bread on the day subsequent to the consumption of foods enriched with 50 g carob fibre (–●–) or control (–○–) foods. Carob fibre consumption resulted in higher plasma glucose (P = 0·029) and a lower plasma TAG (P = 0·033) and serum NEFA (P < 0·001). For details of subjects and procedures, see Methods.
Fasting acylated plasma ghrelin concentrations were increased on day 2, subsequent to the consumption of foods enriched with carob fibre, as compared with previous consumption of control (P = 0·046), while fasting total plasma ghrelin concentrations remained unchanged. Consumption of carob fibre also affected postprandial plasma ghrelin response (Fig. 3). Absolute total and acylated plasma ghrelin responses to bread ingestion were higher on the day subsequent to carob fibre consumption compared with control (P = 0·027 and P < 0·001, respectively). When plasma ghrelin concentrations were normalized to baseline, no effects of carob fibre consumption on changes of the total and acylated plasma ghrelin concentrations from baseline were observed, indicating that the magnitude of total and acylated plasma ghrelin response to the meal was not altered by carob fibre consumption.

Fig. 3 Postprandial absolute and relative response of total and acylated plasma ghrelin as well as serum leptin after consumption of standardized bread on the day subsequent to the consumption of foods enriched with 50 g carob fibre (–▲–) or control (–○–) foods. Carob fibre consumption resulted in higher absolute total and acylated plasma ghrelin (P = 0·027 and P < 0·001, respectively) but did not affect serum leptin concentrations. Differences in total and acylated plasma ghrelin and serum leptin from baseline were not affected by carob consumption. For details of subjects and procedures, see Methods.
Carob fibre consumption did not affect fasting serum leptin or absolute or relative postprandial serum leptin response after bread ingestion on day 2, compared with control (Fig. 3). However, when plasma leptin concentrations were normalized to baseline, a marginal increase in serum leptin levels after 150 min was observed (P = 0·070), indicating a slight change in the amplitude of serum leptin response.
Postprandial total and acylated plasma ghrelin were negatively correlated with plasma insulin and positively with NEFA (Table 4). Coefficients of correlations were higher when only postprandial responses on the day subsequent to the consumption of foods enriched with carob fibre were included. Coefficients of correlation were lower between total plasma ghrelin and other biomarkers.
Table 4 Pearson coefficients of correlation (PCC) between postprandial total and acylated plasma ghrelin and other biomarkers on the day subsequent to the consumption of foods enriched with carob fibre or control foods*
(Values are PCC and 95 % CI)
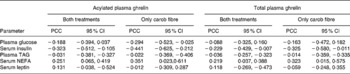
* For details of subjects and procedures, see Methods.
Correlations for both treatments are based on twenty-eight (fourteen time points, two treatments) and correlations for carob treatments are based on fourteen (fourteen time points, one treatment) pairs of data for plasma glucose, TAG and serum insulin, NEFA and leptin for each subject.
Discussion
The major findings of the present study were elevated total and acylated plasma ghrelin levels 24 h after carob fibre consumption, which are accompanied by an enhanced lipid metabolism. Carob fibre consumption also resulted in higher postprandial plasma glucose response.
We recently showed that acute administration of carob fibre lowered acylated ghrelin levels, increased RQ and energy expenditure with an acutely enhanced lipid metabolism and increased fat oxidation during a liquid meal challenge testReference Dongowski, Lorenz and Proll28. The results of the present study show elevated ghrelin levels 24 h after carob consumption, suggesting that higher lipid utilization as observed after acute carob consumption induced a state comparable with a negative energy balance. In rats, acylated ghrelin not only promotes food intake but also decreases fat utilization and energy expenditureReference Tschop, Smiley and Heiman11, Reference Inui29, Reference Kojima and Kangawa30. Ghrelin is also a suppressor of adipose tissue lipolysis via inhibition of AMP-activated protein kinaseReference Choi, Roh, Hong, Shrestha, Hishikawa, Chen, Kojima, Kangawa and Sasaki31, Reference Kola, Hubina and Tucci32. In the present study, elevated ghrelin might have resulted in decreased circulating TAG and NEFA due to higher lipid utilization and suppressed lipolysis. The magnitude of postprandial serum NEFA suppression was similar between both treatments, suggesting a similar insulin-mediated NEFA suppression. However, NEFA slope after liver-mediated suppression was lower after carob consumption, suggesting a higher uptake of NEFA by muscle tissue. Beyond ghrelin, bioactive compounds such as polyphenols may also be responsible for these effects. Narenginin, a polyphenol found in grapefruit, has been shown to reduce plasma TAG in diabetic ratsReference Choi, Yokozawa and Oura33 and inhibited apo-B secretionReference Borradaile, Carroll and Kurowska34. In rats, grape seed polyphenols also lowered plasma TAG, NEFA and apo-BReference Del Bas, Fernandez-Larrea, Blay, Ardevol, Salvado, Arola and Blade35. A potential synergistic effect of dietary fibre and polyphenols might add to these effects. In rats, apple pectin combined with a polyphenol-rich apple concentrate reduced plasma cholesterol and TAG more effectively than pectin or polyphenols aloneReference Aprikian, Duclos, Guyot, Besson, Manach, Bernalier, Morand, Remesy and Demigne36.
Effects of elevated acylated ghrelin on long-term food intake after carob fibre consumption remain speculative due to the concomitant increase in total plasma ghrelin in the second half of postprandial response. The major isoform of ghrelin is desacyl ghrelin, which might counteract or abolish the effects of acylated ghrelinReference Asakawa, Inui, Fujimiya, Sakamaki, Shinfuku, Ueta, Meguid and Kasuga37.
In contrast with ghrelin, leptin acts to reduce food intake and increase energy expenditure by binding and activating its specific receptor in the hypothalamusReference Ahima, Prabakaran, Mantzoros, Qu, Lowell, Maratos-Flier and Flier10, Reference Friedman and Halaas19, Reference Eriksson, Valle, Lindstrom, Haffner, Louheranta, Uusitupa and Tuomilehto38, Reference Friedman39. In vivo, leptin suppresses ghrelin release from isolated rat stomachReference Kamegai, Tamura, Shimizu, Ishii, Sugihara and Oikawa40. Recently, it has been proposed that ghrelin secretion in human subjects is also regulated by leptin restraintReference Kalra, Bagnasco, Otukonyong, Dube and Kalra12, Reference Kalra, Ueno and Kalra17. However, this hypothesis cannot be confirmed by the present study, as the effects were only marginal and 24-h profiles of leptin secretion are missing.
The increase in postprandial plasma glucose response after carob fibre consumption was an unexpected finding, since the consumption of a highly purified insoluble dietary fibre has been shown to improve insulin response directly after consumption and to enhance postprandial carbohydrate handling the subsequent day of ingestionReference Weickert, Mohlig and Koebnick41. This might be explained by the high content of polyphenols in carob fibre and the effect of polyphenols on glucose uptake. We recently showed that polyphenol-rich carob fibre, administered within a water–glucose solution, increased postprandial glucose and insulin responses, suggesting a deteriorated glycaemic controlReference Gruendel, Otto, Garcia, Wagner, Mueller, Weickert, Heldwein, Speth, Katz and Koebnick42. Cell studies have shown that polyphenols decrease glucose uptake into cells via inhibition of phosphatidylinositol 3-kinase, a key regulator of insulin-induced GLUT4 translocationReference Harmon and Patel43, Reference Strobel, Allard, Perez-Acle, Calderon, Aldunate and Leighton44. Our hypothesis is supported by the fact that serum insulin response was not altered by carob consumption despite higher plasma glucose response, suggesting that the effect is triggered by an alteration in insulin action rather than insulin secretion. However, other polyphenols activated phosphatidylinositol 3-kinaseReference Borradaile, de Dreu and Huff45; therefore, the mechanisms involved in the effect observed in the present study remain speculative.
In conclusion, an increase in total and acylated plasma ghrelin accompanied by enhanced lipid metabolism after carob fibre consumption suggests higher lipid utilization and suppressed lipolysis on the day subsequent to carob fibre consumption. However, elevated glucose levels also indicate potential adverse effects that might be caused by polyphenols and need to be addressed in future studies. Whether increased ghrelin concentrations after carob consumption exert unfavourable effects on energy homeostasis in human subjects needs to be addressed in middle and long-term studies.
Acknowledgements
We thank Andreas Wagner for his excellent technical assistance.


