


Differences in individual eating habits may be influenced by genetic factors, in addition to cultural, social or environmental factors. The sweet taste receptor gene family, including TAS1R2 (taste receptor type 1 member 2) and TAS1R3, is located on chromosome 1 in humans(Reference Dias, Eny and Cockburn1–Reference Han, Keast and Roura3). Previous candidate gene studies suggested that genetic variants of this receptor gene family were associated with sweet taste perception and the intake of sweet foods(Reference Chamoun, Hutchinson and Krystia4–Reference Eny, Wolever and Corey6). Some of these studies showed the differential effects of SNP on sucrose sensitivity and sugar intake depending on the presence or absence of being overweight(Reference Knaapila, Hwang and Lysenko5,Reference Eny, Wolever and Corey6) . Other genetic variants that candidate gene studies reported to be associated with sweet consumption were GNAT3 (which encodes the G protein α subunit that plays a prominent role in bitter and sweet taste transduction as well as in umami taste transduction)(Reference Fushan, Simons and Slack7), GLUT2 (a glucose transporter gene)(Reference Eny, Wolever and Fontaine-Bisson8) and FGF21 (a fibroblast growth factor gene)(Reference Chu, Workalemahu and Paynter9,Reference Holstein-Rathlou, Grevengoed and Christensen10) . All these variants suggested by candidate gene studies could not be replicated by subsequent genome-wide association study (GWAS) in both samples of European ancestry and Japanese, probably because the previous candidate gene studies did not consider population stratification(Reference Hwang, Lin and Gharahkhani11,Reference Kawafune, Hachiya and Nogawa12) . Hwang et al., in a GWAS of the perception and intake of sweet substances, found that rs11642841 within the FTO gene on chromosome 16 was strongly associated with the intake of total sugar in a UK Biobank sample(Reference Hwang, Lin and Gharahkhani11).
Recently, the results of several GWAS on the dietary habits of the Japanese population have shown interesting pleiotropic effects of rs671 across dietary habits on foods and beverages, and we and others found that an effective rs671 allele was inversely associated with fish consumption and was directly associated with coffee consumption(Reference Kawafune, Hachiya and Nogawa12–Reference Igarashi, Nogawa and Kawafune15). Kawafune et al. found a strong direct association between an effective rs671 allele and a five-point scale of sweet taste preference(Reference Kawafune, Hachiya and Nogawa12). All these associations were profoundly attenuated by adjustment for alcohol drinking.
For more than a century, people in Japan have eaten two main types of confectionaries: traditional Japanese style confectionaries (wagashi) and European style confectionaries, including patisseries and confiseries (confectionaries), which arrived in Japan in the Meiji era. Wagashi are traditional Japanese confectioneries often served with green tea and made of mochi (sticky rice cake), anko (azuki bean paste) and fruit. In the present GWAS, we took a semi-quantitative amount of wagashi and European style confectionaries as a more objective measure of sweets liking, rather than a self-assessed scale of sweet taste preference. The purposes of this study were(Reference Dias, Eny and Cockburn1) to replicate GWAS on sweets consumption performed in samples of European ancestry in a Japanese population and(Reference Fushan, Simons and Slack2) to use a more objective measure of sweets liking, rather than a self-assessed scale of sweet taste preference.
Methods
Study population
The study was conducted with participants aged from 35 to 69 years as a cross-sectional study within the Japan Multi-Institutional Collaborative Cohort (J-MICC) study, a large cohort study that was started in 2005 to investigate gene–environment interactions in lifestyle-related diseases. The age range was set for the following reasons: The youngest age for inclusion was set at 35 years old, anticipating easier recruitment from health check examinees and others. Also, incidences of non-communicable diseases, including cancer, are thought to increase after age 35 years. The oldest age for inclusion was set at 70 years old, anticipating an easier understanding of participants for genomic study. For this study, about 100 000 volunteers provided their blood and lifestyle data based on a questionnaire. The participants in the J-MICC study were recruited from fourteen different areas throughout Japan between 2004 and 2014. Of 47 163 respondents enrolled between 2004 and 2013, 14 539 participants were randomly selected considering the distribution of study areas for the present GWAS. We used data ver. 20180112. Details of the J-MICC study were reported elsewhere(Reference Suzuki, Nakamura and Matsuo13,Reference Nakagawa-Senda, Hachiya and Shimizu14,Reference Hamajima16) . Briefly, participants completed a questionnaire about lifestyle and medical information and had blood sampled at the time of the baseline survey. The study participants lived in communities in four regions (Chiba, Daiko, Fukuoka and Saga), were health check examinees in seven regions (Shizuoka-Sakuragaoka, Shizuoka, Okazaki, Iga, Takashima, Kagoshima and Kyushu and the Okinawa Population Study) and first-visit patients at a cancer hospital in the Aichi Cancer Center region. In Kyoto and Tokushima regions, the study participants were inhabitants in communities and health check examinees as well as employees of companies or local governments. All participants in this study gave written informed consent prior to enrolment. The study protocol was approved by the ethics committees of Nagoya University Graduate School of Medicine and other institutions participating in the J-MICC study. The present study was conducted according to the principles expressed in the World Medical Association Declaration of Helsinki.
Of 14 539 participants, 448 were excluded by the GWAS screening described below in the section Genotyping and quality control filtering. Of the remaining 14 091 participants, twelve with daily energy intake <500 kcal or >5000 kcal were excluded. As a result, we analysed the data of 14 073 participants in the present study.
Questionnaire and measurements
The questionnaire for the J-MICC studies included questions on medical history, height, weight, smoking and drinking habits, and dietary habits. The questionnaire was checked by experienced staff to confirm completeness and consistency. Height and weight measurements and blood sampling were conducted as part of a health check-up or for research purposes at the institutions participating in the J-MICC study(Reference Hamajima16). Question items were collected using a scientifically validated self-administered questionnaire(Reference Tokudome, Goto and Imaeda17–Reference Wakai21). BMI was calculated by dividing body weight in kg by the square of height in metres.
Dietary assessment
We used a semi-quantitative FFQ to estimate food intake that was validated previously(Reference Tokudome, Goto and Imaeda17–Reference Wakai21). We chose twenty foods/food groups and beverages, the details of which are given in Supplementary Information on FFQ. Food intake frequencies were classified into eight categories (never or seldom, 1–3 times/month, 1–2 times/week, 3–4 times/week, 5–6 times/week, once a day, twice a day and three or more times/d, which were converted to 0, 0·1, 0·2, 0·5, 0·8, 1, 2 and 3, respectively, before analysis). Confections in the questionnaire were grouped into two categories as follows: (1) Western confections (cakes or cream puffs, etc.) and (2) Japanese confections (manju (steamed sweet bean buns), etc.). For each category of confections, the frequency was multiplied by the portion size and the total confections intake amount was calculated. Unfortunately, we did not have any data on intakes of added sugar or sugar-sweetened beverages. Total alcohol intake was estimated as the sum of pure alcohol intake. The frequency of alcohol intake was obtained using six categories (never or seldom, 1–3 times/month, 1–2 times/week, 3–4 times/week, 5–6 times/week and every day). Total alcohol consumption (g/d) was estimated as the summed amount of pure alcohol consumption.
Genotyping and quality control filtering
Buffy coat fractions and DNA were prepared from blood samples and stored at –80°C at the central J-MICC Study office. DNA was extracted from all buffy coat fractions using a BioRobot M48 Workstation (Qiagen Group) at the central study office. For the samples from two areas (Fukuoka and Kyushu and the Okinawa Population Study), DNA was extracted locally from samples of whole blood using an automatic nucleic acid isolation system (NA-3000, Kurabo, Co. Ltd). The 14 539 study participants from the thirteen areas of the J-MICC study were genotyped at the RIKEN Center for Integrative Medicine Sciences using a HumanOmniExpressExome-8v1.2 BeadChip array (Illumina Inc.). Twenty-six participants with inconsistent sex information between the questionnaire and the estimate from genotyping were excluded. The identity-by-descent method in the PLINK 1.9 software(Reference Purcell, Neale and Todd-Brown22,Reference Chang, Chow and Tellier23) identified 388 close relationship pairs (pi-hat > 0·1875), and one sample from each pair of the 388 was excluded. Principal component analysis (PCA)(Reference Price, Patterson and Plenge24) with a 1000 Genomes reference panel (phase 3)(Reference Auton and Brooks25) detected thirty-four participants whose estimated ancestries were outside the Japanese population(Reference Yamaguchi-Kabata, Nakazono and Takahashi26). These thirty-four participants were excluded. In the remaining 14 091 participants, SNP with a genotype call rate <0·98 and/or a Hardy–Weinberg equilibrium exact test P-value < 1 × 10⁻⁶, a low minor allele frequency < 0·01 or a departure from the allele frequency computed from the 1000 Genomes Phase 3 EAS samples were excluded. The quality control filtering resulted in 14 091 individuals and 570 162 SNP.
Genotype imputation
Genotype imputation was performed using SHAPEIT(Reference Delaneau, Marchini and Zagury27) and Minimac3 software(Reference Das, Forer and Schnherr28) based on the 1000 Genomes reference panel (phase 3)(Reference Auton and Brooks25). After genotype imputation, strict quality control filters were applied; namely, variants with an R 2 < 0·3 were excluded, resulting in 12 617 547 variants. Finally, 4 112 564 variants with minor allele frequency < 0·01 in patients were removed, resulting in 8 504 983 variants for the analysis. We used DosageConvertor software(Reference Das29) to convert dosage files in VCF format from Minimac3 to PLINK formats.
Power calculations to test of an association between confection intake and SNP
Statistical power to detect a true association was calculated by the method of Delongchamp et al. (Reference Delongchamp, Faramawi and Feingold30), based on the number of participants and genetic data of the discovery phase J-MICC study. The required non-centrality parameter was obtained by the equation A4 listed in Appendix A by Visscher et al. (Reference Visscher, Wray and Zhang31). When then the number of participants is 14 073, with fourteen covariates for adjustment, 0·8 for linkage disequilibrium R 2, 0·2 for minor allele frequency, 0·02 for squared standardised beta estimate and 8 500 000 for variants analysed, the statistical power is calculated as 0·991 according to the method proposed by Delongchamp et al. (Reference Delongchamp, Faramawi and Feingold30).
Association analyses between genetic variants and confections intake
Associations between all imputed variants and confections intake were analysed by linear regression assuming the additive effects of the allele dosage on confections intake (g/d) adjusted for age, sex, total energy intake and PCA components 1–3 using PLINK 1.9 software(Reference Purcell, Neale and Todd-Brown22,Reference Chang, Chow and Tellier23) . Furthermore, the analysis was repeated adjusting for alcohol intake (ethanol g/d) in addition to the above-described variables. Variants achieving genome-wide significance (P < 5 × 10⁻⁸) were considered to be confections intake-associated variants. An R package for creating a Q-Q plot, GWAS Tools was used(Reference Gogarten, Bhangale and Conomos32). For scatter plots of P-values derived from genome-wide scan results for confections intake, qqman software was used(Reference Turner33). To visualise regions of interest, we used the LocusZoom programme(Reference Pruim, Welch and Sanna34). For sensitivity analyses, we performed GWA on Western and Japanese confections intakes separately.
In addition, replication analysis adjusted for age, sex, total energy intake and PCA components 1–3 using the J-MICC samples for twenty SNP that were previously reported to be associated with sweet taste perception or confections intake(Reference Dias, Eny and Cockburn1–Reference Hwang, Lin and Gharahkhani11) was performed.
Student’s t tests were used to compare means between men and women.
Results
Baseline characteristics
Baseline characteristics of the all, male and female participants are shown in Table 1. The mean age of the participants was 54·8 ± 9·4 years, and the percentage of women was 55·0 %. The mean confections intake was 198 ± 142 kJ/d. Total energy intake was 7135 ± 1490 kJ/d. The means for protein, fat, carbohydrate (% of total energy) and alcohol intake (g/d) were 12·7 ± 2·0 %, 23·8 ± 6·4 %, 55·8 ± 6·2 % and 9·4 ± 16·3 g/d, respectively. The mean BMI level was 23·1 ± 3·3 kg/m2. The mean age, total energy intake, %carbohydrate intake, alcohol intake and BMI were significantly larger in men than in women. The mean confections intake, %protein and %fat intake were significantly smaller in men than in women.
Table 1 Baseline characteristics of the study participants*
(Mean values and standard deviation, percentages)

J-MICC, the Japan Multi-Institutional Collaborative Cohort study.
* P-values are by Student’s t tests.
Association analyses between confections intake and genetic variants
Genome-wide analyses among the 8 504 983 variants adjusted for age, sex, total energy intake and PCA 1–3 identified 418 SNP on chromosome 12 that were associated with confections intake with genome-wide significance (P < 5 × 10⁻⁸). SNP with the ten lowest P-values that were associated with confections intake are shown in Table 2. The quantile–quantile plot of the observed P-values is shown in Fig. 1. The inflation factor of the genome-wide scan was 1·019 (95 % CI 1·018, 1·021), indicating that the population structure was well-adjusted. Figure 2 shows scatter plots of P-values derived from genome-wide scan results for confections intake, which found 418 SNP at 12q24 with genome-wide significance (P < 5 × 10⁻⁸). SNP with the ten lowest P-values were located on nine genes, namely the BRAP, ACAD10, aldehyde dehydrogenase 2 (ALDH2), ADAM1A, MAPKAPK5, TMEM116, NAA25, TRAFD1 and HECTD4 regions (online Supplemental Figure). After adjustment for alcohol intake (g/d), no variant was associated with confections intake with genome-wide significance (P < 5 × 10⁻⁸). The quantile–quantile plot of the observed P-values is shown in Fig. 3. The inflation factor of the genome-wide scan was 1·017 (95 % CI 1·016, 1·019), indicating that the population structure was well-adjusted. The results of sensitivity analyses on Western and Japanese confections intakes separately yielded similar results.
Table 2 SNP with the ten lowest P-values that were associated with confections intake (Japan Multi-Institutional Collaborative Cohort study (J-MICC) study, n 14 073), adjusted for age, sex and Principal component analysis (PCA)
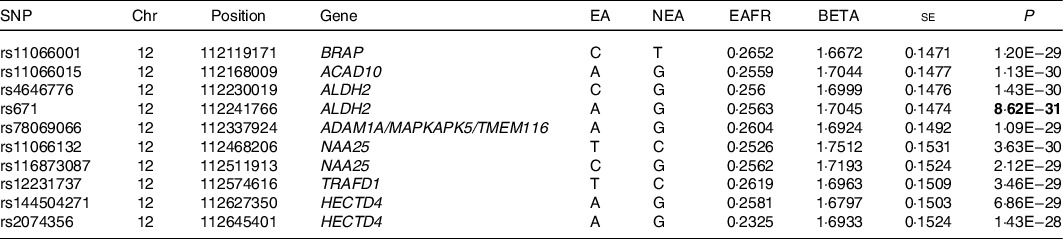
Chr, Chromosome; Chromosomal position (GRCh37/hg19); EA, effect allele; NEA, non-effect allele; EAFR, effect allele frequency; Beta, effect size.
Genome-wide analyses among the 8 504 983 variants adjusted for age, sex, total energy intake and PCA 1–3, identified 418 SNP on chromosome 12 that were associated with confections intake with genome-wide significance (P < 5 × 10⁻⁸).

Fig. 1 A quantile–quantile plot (black) of genome-wide association tests. The x-axis indicates the expected-log10 P-values under the null hypothesis. The y-axis shows the observed-log10 P-values calculated by a linear regression model using PLINK(Reference Chang, Chow and Tellier23). The line represents y = x, which corresponds to the null hypothesis. The grey-shaded area shows the 95 % CI of the null hypothesis. The inflation factor (λ) is the median of the observed test statistics divided by the median of the expected test statistics. An R package for creating the Q-Q plot, genome-wide association study (GWAS) Tools, was used(Reference Gogarten, Bhangale and Conomos32).

Fig. 2 Genome-wide association signals. The x-axis represents chromosomal positions, and the y-axis represents -log10 P-values calculated by a linear model association analysis. The software, qqman, was used(Reference Turner33).

Fig. 3 A quantile–quantile plot (black) of genome-wide association tests with adjustment for alcohol intake. The x-axis indicates the expected -log10 P-values under the null hypothesis. The y-axis shows the observed-log10 P-values calculated by a linear regression model using PLINK(Reference Chang, Chow and Tellier23). The line represents y = x, which corresponds to the null hypothesis. The grey-shaded area shows the 95 % CI of the null hypothesis. The inflation factor (λ) is the median of the observed test statistics divided by the median of the expected test statistics. An R package for creating the Q-Q plot, genome-wide association study (GWAS) Tools, was used(Reference Gogarten, Bhangale and Conomos32).
Replication of previously reported SNP
The results of a replication study in our J-MICC GWAS data, which adjusted for age, sex, PCA 1–3 and total energy intake on the twenty SNP that were previously reported to be associated with sweet taste perception or sweets intake, are shown in Table 3. None of the SNP reported was statistically significant (P < 0·05/20 = 0·0025) in our J-MICC data.
Table 3 Replication analysis using the Japan Multi-Institutional Collaborative Cohort study (J-MICC) samples for SNP that were associated with sweet taste perception or sweets intake in previous studies

Chr, chromosome; position, chromosomal position (GRCh37/hg19); EA, effect allele; NEA, non-effect allele; EAFR, effect allele frequency; Beta, effect size; TAS1R2, taste receptor type 1 member 2; FGF21, a fibroblast growth factor gene; GLUT2, a glucose transporter gene.
We carried out a replication study on the twenty identified loci (including sweet taste receptor gene family) associated with sweets intake.
Discussion
In the present GWAS adjusted for age, sex, total energy intake and PCA 1–3 in a Japanese population, we found 418 SNP located on 12q24 genes; the BRAP, ACAD10, ALDH2, ADAM1A, MAPKAPK5, TMEM116, NAA25, TRAFD1, and HECTD4 regions on 12q24·12–13 were significantly associated with confections intake before adjustment for alcohol intake. However, after adjustment for alcohol intake (g/d), no variants were associated with confections intake with genome-wide significance.
Previous studies suggested that several SNP within TAS1R2, GNAT3, GLUT2, FGF21 and FTO were associated with the perception of sweet and sugar(Reference Dias, Eny and Cockburn1–Reference Hwang, Lin and Gharahkhani11). TAS1R2 is a protein encoded by the TAS1R2 gene in humans. Sweet taste receptor gene family members TAS1R2 and TAS1R3 are G-coupled protein genes located on chromosome 1. However, from our GWAS results, no SNP on chromosome 1, as well as others on chromosomes 3, 4, 7, 16 and 19, were significantly associated with confections intake in replication analysis. Regarding other genes found to be apparently associated with confections intake, analysis with adjustment for alcohol intake in addition indicated that they could not be causal genes; descriptions are shown in online Supplementary Information on Genes.
In our GWAS results, rs671 was strongly associated with confections intake, with the lowest P-value before adjustment for alcohol intake. Rs671 is a missense mutation in the ALDH2 gene. ALDH2 is an important enzyme in alcohol metabolism that catalyses the reaction of acetaldehyde oxidisation to acetic acid. In Asian populations, an rs671 mutation replaces Glu at codon position 504 with Lys(Reference Li, Borinskaya and Yoshimura35). This mutation reduces the activity of ALDH2(Reference Koganebuchi, Haneji and Toma36–Reference Matsuo, Hamajima and Shinoda39). In previous studies, ALDH2 was associated with ischaemic stroke(Reference Pulit40), chronic kidney diseases(Reference Lee, Lee and Park41), blood pressure(Reference Kato, Loh and Takeuchi42), primary biliary cirrhosis(Reference Cordell, Han and Mells43), oesophageal cancer(Reference Cui, Kamatani and Takahashi37,Reference Matsuo, Hamajima and Shinoda39) and hip fracture(Reference Takeshima, Nishiwaki and Suda44).
In the present study, most SNP on chromosome 12 found to be associated with confections consumption were in strong linkage disequilibrium with the ALDH2 gene. After adjustment for alcohol intake (g/d), however, no variants were associated with confections intake with genome-wide significance (P < 5 × 10⁻⁸). The fact that the associations between SNP on chromosome 12 and confections intake were strongly confounded by alcohol drinking status implies the importance of gene–environmental factor interactions. The rs671 mutation directly affects the amount of alcohol consumed. Although previous studies reported genetic variants associated with sweet taste perception and the intake of sweet foods, the present study suggested that in Japanese, alcohol drinking has a much larger influence on eating habits related to sweet foods than the taste receptor. Kawafune et al. found a strong direct association between the effective allele of rs671 and a five-point scale of sweet taste preference. The relation was attenuated by adjusting for alcohol consumption. However, in that study, the association between rs671 and sweet taste preference was not significant among participants who hardly drank alcohol at all. If rs671 is the true causal SNP for sweet taste preference, the relationship should have been seen in non-drinkers. Interestingly, interaction between alcohol drinking and foods intake was noted in a European population. According to the study in a French population by Kesse et al., increasing alcohol consumption was associated with a higher total energy intake, a higher percentage of energy intake as protein and lipids. Conversely, energy provided by carbohydrates and intake of fruits decreased with increasing alcohol consumption(Reference Kesse, Clavel-Chapelon and Slimani45).
BRAP-ALDH2 loci, including rs671, were found to be associated with sweet foods consumption before adjustment for alcohol intake in the present study, and it has been reported that this region is among several identified loci with strong, and very recent (around the past 2000–3000 years), evolutionary selection signatures in Japanese people in a recent whole-genome sequencing study by Okada et al. (Reference Okada, Momozawa and Sakaue46). Using high-depth whole genome sequence data of 2234 Japanese individuals, they calculated singleton density score, which can detect the signatures of very recent natural selection in a single population. BRAP-ALDH2 loci were one of the four loci in which genome-wide singleton density score P-values demonstrated significant natural selection pressure that satisfied the genome-wide significance threshold.
This study has several limitations. We did not perform a replication study in a different Japanese population because the present results were negative from a GWAS point of view. A replication study in a European population, however, would probably yield quite different results from those we found in the present study, since ALDH2 polymorphism is restricted in Eastern Asian populations. Second, although we used a semi-quantitative FFQ to estimate food intake as reported previously(Reference Tokudome, Goto and Imaeda17–Reference Wakai21), the number of sweet foods included in the FFQ was small and data on the intakes of added sugar or sugar-sweetened beverages, as well as sweetness intensity elicited by the ‘sweet foods’, were not included; thus, some difference from actual sweet foods intake is inevitable. Although fruit intake may be of interest, a separate GWAS should be performed reflecting a number of cohort studies on the associations between fruit or vegetable consumption and outcomes, such as cancer or CVD(Reference Wang, Ouyang and Liu47,Reference Aune, Giovannucci and Boffetta48) . Third, in the present study, confections contributed to 2·8 % of the total energy intake. Although this contribution appears small, we know that previous observational studies of several foods and beverages that had small contribution to total energy intake, such as sugar, fruit and vegetable, reported significant impact on outcomes(Reference Wang, Ouyang and Liu47–Reference Malik, Popkin and Bray49). Thus, the significance of our findings is not small.
In conclusion, we found a significant number of SNP located on 12q24 genes that were associated with confections intake before adjustment for alcohol intake. However, all lost significance after adjustment for alcohol intake.
Acknowledgements
We would like to thank all the staff at the Laboratory for Genotyping Development, Center for Integrative Medical Sciences, RIKEN and the staff of the BioBank Japan project. We thank Drs Nobuyuki Hamajima and Hideo Tanaka, the past principal investigators of the J-MICC, for their continuous support for our study.
This study was supported by Grants-in-Aid for Scientific Research for Priority Areas of Cancer (no. 17015018) and Innovative Areas (no. 221S0001), and by JSPS KAKENHI grants no. 19H03902, 16H06277 (CoBiA) and 15H02524) from the Japanese Ministry of Education, Culture, Sports, Science and Technology. This work was also supported in part by a Grant-in-Aid from the Japan Society for the Promotion of Science (JSPS) KAKENHI Grant B Numbers 24390165, 20390184 and 17390186. This study was supported in part by funding for the BioBank Japan Project from the Japan Agency for Medical Research and development since April 2015, and the Ministry of Education, Culture, Sports, Science and Technology from April 2003 to March 2015.
The authors’ responsibilities were as follows – T. S., Ya. N., Y. K. and K. W. designed the research; Ya. N., A. S., N. I., C. G., Ken. M., A. K., Kat. M., K. T., M. H., H. I., M. M., T. T., D. N., Kei. M, I. O., N. K., E. O., H. M., Yo. N., M. W., S. S., S. K. K., K. A., K. K., Y. M., M. K., K. T., Y. K. and K. W. conducted the research; T. S., Ya. N., A. N., A. S. and N. I. analysed data and performed statistical analysis; T. S., Ya. N. and Y. D. wrote the manuscript and had primary responsibility for final content; and all authors read and approved the final manuscript.
None of us has any conflict of interests.
Supplementary material
For supplementary material referred to in this article, please visit https://doi.org/10.1017/S0007114521000684


