


Entering higher education causes lifestyle changes(Reference Bernardo, Jomori and Fernandes1) that are associated with unhealthy food choices(Reference Mikolajczyk, El Ansari and Mikolajczyk2,Reference Pereira-Santos, da Mota Santana and Neves de Carvalho3) and weight gain(Reference Vadeboncoeur, Townsend and Foster4). Despite the growth of the segment that has been having access to higher education in the last two decades(5,Reference Vargas Carneiro and Bridi6) , research on changes in eating habits related to entering university is still incipient in Brazil.
Few studies have sought to identify the dietary patterns (DP) of college students(Reference Pereira-Santos, da Mota Santana and Neves de Carvalho3,Reference Blondin, Mueller and Bakun7,Reference Sprake, Russell and Cecil8) , and to date, none has analysed meal patterns(Reference Bernardo, Jomori and Fernandes1). A better understanding of the factors associated with food combinations at mealtimes among college students may contribute to the proposal of more effective food and nutrition education strategies.
To characterise meals, several aspects have to be taken into consideration; for example, type and amount of food consumed, time and place of food consumption, social interaction and the food culture(Reference Oltersdorf, Schlettwein-gsell and Winkler9). The Brazilian Dietary Guidelines dedicate great importance to meals, both regarding the foods included in each meal and with regard to the environment in which they are performed, highlighting the adoption of culturally referenced, fresh or minimally processed foods and commensality(10).
The analysis of the meal DP allows to deepen and detail knowledge on eating habits, making it possible to acknowledge the effect of combinations of foods in each eating occasion(Reference Santos, Fisberg and Marchioni11). For example, the food composition of one single meal can trigger different inflammatory responses, as observed in a clinical trial with overweight individuals. They received two isoenergetic breakfasts that were different only in the content of fatty acids and fibres. Postprandial pro-inflammatory cytokines were higher in the group who received a saturated fat-enriched breakfast compared with those who received a breakfast rich in unsaturated fatty acids and fibres(Reference Monfort-Pires and Ferreira12).
DP can be analysed by a priori or a posteriori approaches. A priori analysis of eating patterns is usually based on guidelines for a healthy diet, and a posteriori approach is driven by the underlying dietary data using statistical methods, like principal component analysis, factor analysis or cluster analysis(Reference Ocké13).
The aim of this study was to identify the a posteriori DP for the main meals of the day and to analyse the lifestyle and socio-demographic factors among college students participating in the Longitudinal Study on the Lifestyle and Health of University Students (ELESEU).
Methods
Study design and population
This is a cross-sectional study that analysed baseline data of the Longitudinal Study on the Lifestyle and Health of University Students (ELESEU), conducted at a public university in the Midwest region of Brazil including students enrolled as freshman in the first semester of the 2016 and 2017 in all twenty-one full-time undergraduate courses offered in the studied university. Students up to 25 years old who were enrolled for the first time in a university were included in the study, except pregnant and/or nursing women. Students who have already been in the university were excluded because the ELESEU cohort study was designed with the main objective to evaluate possible changes in lifestyle and health conditions related to the transition between high school and university. All students who met the eligibility criteria were invited to participate in the study.
A total of 1228 students were eligible for this study, of which 4·6 % (n 57) refused to participate and 4·7 % (n 58) did not answer the questionnaire; hence, a total of 1113 students participated in the study. Of these, a convenience subsample comprising 685 students (61·5 %) accepted to further answer a 24-h dietary recall (24hR). Details on the study design and population can be found in Nogueira et al. (Reference Nogueira, Ferreira and Rodrigues14).
Data collection
Information on socio-demographic and economic characteristics, lifestyle and eating habits was collected using a self-administered questionnaire. To obtain information on lifestyle, the questions were the same utilised in national surveys conducted in Brazil, like Surveillance System for Risk and Protective Factors for Chronic Diseases by Telephone Survey (VIGITEL)(15) and National Health Survey (PNS)(16). Questions on eating habits were adapted from Estima(17). Economic class was assessed according to the Brazil Criteria of the Brazilian Market Research Association(18), whose categories range from A (highest) to E (lowest). In the analyses, the classes C, D and E were grouped together. Age was recorded in years and categorised for analysis at 16–19 years (adolescents) and 20–25 years (young adults). The housing situation was determined by the question ‘Who do you live with at the present time?’, with five answer options (alone, parents’ home, relatives’ home, share house and others). For analysis, parents and relatives were grouped into ‘with family’ and share houses and others, into ‘share houses or others’.
Smoking was classified into two categories (yes/no). Any student who had smoked at least one cigarette in the last 30 d was considered to be a smoker(19). Current alcohol intake was assessed on the basis of drinking at least one glass or one dose of alcohol over the past 30 d(Reference Moura and Malta20). Sedentary behaviour was considered to occur if time spent using a computer, mobile phone or videogame and/or watching television was more than 2 h/d(21). Physical activity was assessed based on the student’s perception of change on his/her level of physical activity after the enrolment at the university, considering as answers options ‘increased’, ‘decreased’ and ‘maintained’.
Weight status was assessed by BMI and classified according to WHO’s recommendations for adults and adolescents(22,23) . For analyses, three categories were considered: normal and underweight (adults <25 kg/m2; adolescents <+1 z-score), overweight (adults ≥25 and <30 kg/m2; adolescents ≥1 and <+2 z-score) and obesity (adults ≥30 kg/m2; adolescents ≥ +2 z-score).
Information about food-related habits, such as place of meal consumption, was collected with the question ‘Generally, where do you have the following meals’: ‘name of meal’, with the following answer options: ‘at home’, ‘at university’, ‘cafeteria, bar, restaurants’, ‘other’. There was a previous question about the frequency of having each meal. If the student did not have the meal, they were instructed to skip the question of place of meal consumption. For the analyses, the categories ‘at university’, ‘cafeteria, bar, restaurants’ and ‘others’ were grouped into ‘at university’, since the number of students who marked the options ‘cafeteria, bar, restaurants’ and ‘others’ was <2 % for all meals (0·7 % for breakfast in both options; 1·9 and 0·7 %, respectively, at lunch and 0·4 and 0·6 %, respectively, at dinner).
The frequency of buying snacks at the university was determined by the question ‘How often do you eat snacks bought inside the university, such as snack foods, hot dogs, sandwich cookies, sandwiches, sugar confections?’. Responses were categorised as ≥once a week and <once a week.
Food intake assessment
Food intake was assessed by a single 24hR, applied by properly trained interviewers. Students answered a single 24hR regarding a weekday (typical days) or a weekend or holiday day (atypical days). Students were asked to recall all food and beverages consumed on the day before the interview, as well as the amount and time of consumption. To improve the quality of food intake report, the multiple-pass method was adopted(Reference Conway, Ingwersen and Moshfegh24).
To ensure higher accuracy in the report of amount consumed, an album was made with images of foods commonly consumed in the Midwest Region of Brazil, as well as of tableware commonly used for portioning foods(Reference Ferreira, Pereira and Silva25). Students were probed on the consumption of food items usually forgotten, such as candies, chewing gum, margarine/butter, olive oil, salad dressings, coffee and tea and other beverages in order to minimise underreporting.
The ERICA-REC24h software was used to input the data collected in the 24hR. This software was developed from a database consisting of 1626 food items used in the National Dietary Survey (INA, acronym in Portuguese), which was developed by the Brazilian Institute of Geography and Statistics, in 2008–2009(Reference Barufaldi, Abreu and Veiga26,27) . Food items or preparations reported by students that were not on the software food list were either assigned to similar foods preparations, according to a standardised coding process or, exceptionally, manually entered in the database. The time for each eating occasion was recorded in full hours: if the intake occurred before the 30th min, the time was rounded up to the previous hour otherwise it was rounded up to the next hour.
Definition of meal
DP of the main meals (breakfast, lunch and dinner) consumed in Brazil were identified(10). The meals were defined according to the opening hours of the university canteen (UC); thus, breakfast was composed of the food items consumed between 06.00 and 08.00 hours; lunch comprised foods consumed between 11.00 and 14.00 hours and dinner between 17.00 and 20.00 hours.
The choice of the UC opening hours to define the food items consumed at each meal was based on three factors: (1) the UC is an institutional food service that offers meals to students, the target audience of this study; (2) the schedules coincide with the time of class break for full-time courses and (3) the schedules reflect the time when people traditionally have their main meals in Brazil.
Additionally, in cases in which the student presented more than one eating occasion at the time interval previously set for the meal, food consumption at that meal was considered the eating episode with the highest energy content(Reference Gorgulho, Pot and Sarti28,Reference Leech, Worsley and Timperio29) .
Assessment of meal dietary patterns
To evaluate the meal patterns, the food items reported in the 24hR were grouped based on their nutritional similarity, except those that were consumed by most students (such as rice at lunch, e.g.), which were considered separately in the analysis. Food items/groups consumed by <5 % of the sample were excluded or regrouped. From 166 food items registered for breakfast, 292 for lunch and 318 for dinner, twelve food groups were defined for breakfast, fourteen for lunch and seventeen for dinner (online Supplementary Table S1). The food group intake was evaluated in grams.
To identify the DP of each meal, an exploratory factor analysis was conducted. The applicability of the data to the factor analysis was checked by the Kaiser–Meyer–Olkin test, which evaluates the existence and strength of partial correlations, considering values >0·5 as acceptable(Reference Bezerra, Corrar, Paulo and Filho30), and Bartlett’s sphericity test, which was considered significant if P < 0·05. The principal component analysis method was used to extract the factors(Reference Olinto, Kac, Sichieri and Gigante31).
A correlation matrix was constructed, and the number of factors to be extracted was determined with the Cattel graph test, which aims to identify the point at which the eigenvalues show a decreasing linear trend(Reference Bezerra, Corrar, Paulo and Filho30) and analysing the interpretability of the meal patterns. The number of extracted factors was fixed at three. Foods or food groups with a commonality value (h2) of <10 % were excluded or regrouped, as they contributed little to the explanation of the patterns. Varimax orthogonal rotation was performed to facilitate the interpretation of the factors. Food groups/items with factor load >|0·25| were retained in DP and used to name them. The analyses were conducted in the Statistical Package for Social Sciences (SPSS) version 20.0.
Statistical analysis
Sample size and power
Sample size was estimated to assess food consumption considering a significance level of 5 and 80 % power, with proportions of 0·50, allowing different outcomes to be analysed. This estimate generated a sample size of 268 individuals per year. To prevent sample losses due to non-response, 20 % was added to this number, providing an estimated sample size of 335 individuals per year. The students were selected for convenience, alternating between the twenty-one undergraduate courses evaluated, until reaching the desired sample size.
The Generalised Linear Model with log link and γ family was used to analyse the association of independent variables (sex, age, economic class, smoking status, alcohol consumption, sedentary behaviour, perception of change in physical activity, weight status, living situation, place where having breakfast, lunch and dinner and the frequency of buying snacks at the university) with DP. Factor scores (continuous variable), attributed to each participant for each dietary pattern, were the dependent variables of the study, and they were transformed on a 0–100 scale in order to attend γ distribution assumptions. Independent variables with P < 0·20 in the crude analysis on at least one extracted meal pattern were included in the multiple models. In the multiple analysis, the independent variables were included simultaneously in the models. The Akaike information criterion was considered to compare different possible models and determine which one was the best fit for the data. Statistical analysis was conducted using Stata Statistical Software version 12.
Ethical aspects
This study was approved by the Human Research Ethics Committee of the Júlio Müller University Hospital, Federal University of Mato Grosso, under decision no. 1,006,048, of 31 March 2015, and the written informed consent was obtained from all study participants.
Results
The study included 685 university students with an average age of 18·7 (sd 1·52) years. From all participants, 50·1 % were male, 48·7 % belonged to economic class B and 71·8 % lived with their parents. Most were non-smokers (87·6 %), reported alcohol consumption in the 30 d previous the interview (58·0 %) and to have decreased physical activity practice after their enrolment at the university. More than 70 % had normal weight (71·9 %), 15·6 % were overweight and 6·7 % were diagnosed with obesity (Table 1).
Table 1. Distribution of the university students according to socio-demographic, economic, lifestyle variables and weight status, Cuiabá, Brazil, 2016–2017 (n 685*)(Numbers and percentages)

* Missing data: economic class (11), smoking status (14), sedentary behaviour (1), weight status (1).
† Brazilian Association of Research Companies(18).
‡ Smoking in the past 30 d(19).
§ Consumption of at least 1 drink of alcoholic beverage during the past 30 d(Reference Moura and Malta20).
Lunch was the most consumed meal at the university campus (79·1 %), followed by dinner (47·3 %) and breakfast (34·9 %). Breakfast was the most omitted meal among students (39·0 %). Lower frequencies of omission were found for lunch (4·5 %) and dinner (16·0 %).
Meal patterns
In factor analysis, Kaiser–Meyer–Olkin test values were >0·5 and Bartlett’s sphericity test had P < 0·05 for the three meals, indicating that the analysis is appropriate for the data set.
Three DP were extracted for breakfast, which together explained 37·9 % of the total consumption variability of this meal. The first DP was designated as ‘White bread and butter/margarine’, which was positively loaded for white breads, ‘butter and margarine’, jam, chocolate milk, and negatively loaded for ‘cakes and cookies’ and fruits. This factor explained about 15 % of breakfast variability. The second pattern, named ‘Coffee and tea’, explained about 12 % of breakfast variability and was positively charged only for ‘Coffee and tea’ and negatively loaded for ‘Milk and yogurt’. The third pattern, labelled as ‘Sausages, whole wheat bread and cheese’, was positively loaded for sausages, whole wheat bread and cheese, and it was characterised by foods that do not require preparation for consumption (Table 2).
Table 2. Rotated factor matrix and estimated factor loadings and communalities (h 2), for breakfast dietary patterns, Cuiabá, Brazil, 2016–2017 (n 437) (Factor loadings, communalities and percentages)
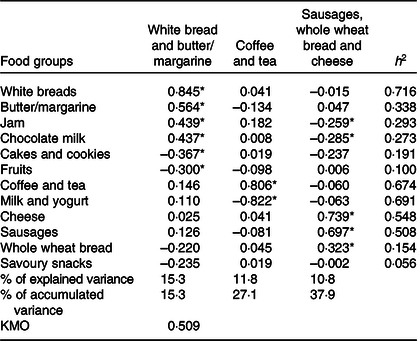
KMO, Kaiser–Meyer–Olkin.
* Factor loadings >|0·25|.
After adjustments, the ‘White bread and butter/margarine’ breakfast DP remained associated with male (exp (β adj) = 1·05, 95 % CI 1·01, 1·09) and younger students (exp (β adj) = 1·05, 95 % CI 1·01, 1·10) and with having breakfast at the university (exp (β adj) = 1·15, 95 % CI 1·11, 1·19). Living in shared houses was associated with greater adherence to the ‘Coffee and tea’ DP (exp (β adj) = 1·06, 95 % CI 1·01, 1·12). After adjustments, having breakfast at the university (exp (β adj) = 1·06, 95 % CI 1·02, 1·10) and the purchase of snacks at the institution (exp (β adj) = 1·06, 95 % CI 1·01, 1·09) were associated with greater adherence to the ‘Coffee and tea’ DP and with lower adherence to ‘Sausages, whole wheat bread and cheese’ DP (exp (β adj) = 0·93, 95 % CI 0·89, 0·97 and exp (β adj) = 0·96, 95 % CI 0·92, 0·99, respectively). Students belonging to economic classes C, D and E also showed lower adherence to this DP (exp (β adj) = 0·95, 95 % CI 0·91, 0·99) and those with a sedentary behaviour adhered more to ‘Sausages, whole wheat bread and cheese’ DP (exp (β adj) = 1·04, 95 % CI 1·01, 1·09), as observed in Table 3.
Table 3. Crude (β c) and adjusted (β adj) exponential γ regression coefficients for factors associated with breakfast dietary pattern scores among university students, Cuiabá, Brazil, 2016–2017 (n 437) (β Values and 95 % confidence intervals)

* Reference category.
† P ≤ 0·20 in the univariate analysis.
For lunch, three DP explained 32 % of total lunch variance. The first pattern was denominated ‘Traditional’ as it was positively charged for rice, beans and chicken and negatively charged for ‘Savoury snacks and bread’ and soft drinks, and it explained 12·5 % of the total variance. The second pattern, named ‘Western’, explained 10·2 % of the total variance and presented positive charges for beef, French fries and processed fruit juices, but it was negatively charged for chicken, pasta and natural juices. The third pattern (9·6 % of the variance), labelled ‘Vegetarian’, was positively charged for brown rice, vegetables, natural juices and fruits, but negatively for beef, soft drinks, white rice and tubers (Table 4).
Table 4. Rotated factor matrix and estimated factor loadings and communalities (h 2), for lunch dietary patterns, Cuiabá, Brazil, 2016–2017 (n 678) (Factor loadings, communalities and percentages)

KMO, Kaiser–Meyer–Olkin.
* Factor loadings >|0·25|.
Having lunch at the university was inversely associated with the ‘Traditional’ lunch DP (exp (β adj) = 0·96, 95 % CI 0·93, 0·99). Male students (exp (β adj) = 1·10, 95 % CI 1·06, 1·13) and those from economic classes C, D and E (exp (β adj) = 1·06, 95 % CI 1·03, 1·09) showed higher adherence to this DP. On the other hand, students who were smokers (exp (β adj) = 1·06, 95 % CI 1·01, 1·11), those who lived in shared houses (exp (β adj) = 1·05, 95 % CI 1·01, 1·10) and those who had lunch at the university (exp (β adj) = 1·04, 95 % CI 1·01, 1·08) showed greater adherence to the ‘Western’ lunch DP, while students who reported having drunk alcoholic beverages showed lower adherence to this DP (exp (β adj) = 0·97, 95 % CI 0·93, 0·99). Male (exp (β adj) = 0·96, 95 % CI 0·93, 0·99) and those with obesity (exp (β adj) = 0·92, 95 % CI 0·87, 0·99) and those who purchased snacks at the university campus (exp (β adj) = 0·97, 95 % CI 0·94, 0·99) had lower adherence to the ‘Vegetarian’ DP, while those who lived alone (exp (β adj) = 1·05, 1·01, 1·10) presented greater adherence to this pattern (Table 5).
Table 5. Crude (β c) and adjusted (β adj) exponential γ regression coefficients for factors associated with lunch dietary pattern scores among university students, Cuiabá, Brazil, 2016–2017 (n 678)(β Values and 95 % confidence intervals)

* Reference category.
† P ≤ 0·20 in the univariate analysis.
Three DP were identified for dinner, which together accounted for 31 % of total variance. The first DP, designated as ‘Beans, rice and processed juice’, consisted of rice, beans, red meat, vegetables and processed juice and with negative loads for ‘cakes and cookies’ and savoury snacks. This pattern explained 14·2 % of the variance. The second pattern, named ‘White bread and butter/margarine’, was positively charged for white breads, ‘butter and margarine’, sausages, cheese and soft drinks (8·8 % of the variance). The third pattern was labelled as ‘White meat, eggs and natural juice’ (8·0 % of the variance) and showed positive charges for white meat, eggs, natural juice and negative charges for desserts and ‘milk and yogurt’ (Table 6).
Table 6. Rotated factor matrix and estimated factor loadings and communalities (h 2), for dinner dietary patterns, Cuiabá, Brazil, 2016–2017 (n 596) (Factor loadings, communalities and percentages)

KMO, Kaiser–Meyer–Olkin.
* Factor loadings >|0·25|.
Male students, those from economic classes C, D and E and those who had dinner at the university showed greater adherence to the ‘Beans, rice and processed juice’ dinner DP (exp (β adj) = 1·06, 95 % CI 1·03, 1·09; exp (β adj) = 1·04, 95 % CI 1·01, 1·08 and exp (β adj) = 1·10, 95 % CI 1·06, 1·14, respectively). On the other hand, having dinner at the university campus was inversely associated with both ‘White bread and butter/margarine’ and ‘White meat, eggs and natural juice’ dinner DP (exp (β adj) = 0·96, 95 % CI 0·93, 0·99 and exp (β adj) = 0·96, 95 % CI 0·93, 0·99, respectively) (Table 7).
Table 7. Crude (β c) and adjusted (β adj) exponential γ regression coefficients for factors associated with dinner dietary pattern scores among university students, Cuiabá, Brazil, 2016–2017 (n 596) (β Values and 95 % confidence intervals)

* Reference category.
† P ≤ 0·20 in the univariate analysis.
Discussion
In this study, the food consumption of college students was analysed in order to identify the eating patterns at breakfast, lunch and dinner. Three DP were extracted for each meal, explaining more than 30 % of the variability of food intake and reflecting the diversity of food choices at each meal. Having a specific meal at the university campus was associated with at least one DP in all meals investigated: the patterns ‘White bread and butter/margarine’ and ‘Coffee and tea’ at breakfast; ‘Western’ at lunch and ‘Beans, rice and processed juice’ at dinner. These findings reflect, at least in part, the influence of the university food environment on DP in this population group.
Regarding breakfast, the dietary pattern that best explained this meal (‘White bread and butter/margarine’) was composed of items that characterised the traditional Brazilian breakfast in the most of Brazil regions; however, it also included jam and chocolate drinks, which are usually provided by the UC and are rich in simple sugars, and it was inversely associated with fruits, thus characterising an unhealthy breakfast DP.
Consumption of unhealthy foods, especially at breakfast, must be discouraged, since the quality of breakfast eaten has been linked to the overall quality of the diet(Reference Lopez-Sobaler, Cuadrado-Soto and Peral-Suarez32,Reference O’Neil, Byrd-Bredbenner and Hayes33) . A study that evaluated the quality of Brazilian breakfast using the Breakfast Quality Index found that about 70 % of the adult population had an average breakfast quality, and among those who had a low breakfast quality, almost 90 % consumed only coffee or tea at this meal(Reference Pereira, Castro and Hopkins34). In this study, the second DP that best explained college student breakfast was composed exclusively by coffee and tea and was inversely associated with milk and yogurt. Greater adherence to the ‘Coffee and tea’ DP was directly associated with having breakfast at the university and with the habit of buying snacks at the university. These findings show the role of UC in students’ food consumption, since both coffee and tea are offered by the UC with no limitation of the portion size.
It is also noteworthy that none of the DP identified for breakfast retained fruits and milk/yogurt with positive loads, which are foods expected to be present in this meal in order to contribute with the intake of antioxidants and micronutrients, such as Ca(10,Reference O’Neil, Byrd-Bredbenner and Hayes33,Reference Gambardella, Frutuoso and Franch35) . Differently of the observed by Santos et al. (Reference Santos, Fisberg and Marchioni11) for the adult Brazilian population, a ‘Healthy’ breakfast DP was not extracted in the present study.
At lunch, the three patterns together explained 32·3 % of the variance. Among Brazilian adults, a similar variance of consumption (34·1 %) at lunch was explained by five DP, named ‘Traditional’, ‘Salad’, ‘Sweetened juices’, ‘Western’ and ‘Meats’(Reference Santos, Fisberg and Marchioni11). Only the ‘Traditional’ DP extracted by Santos et al. (Reference Santos, Fisberg and Marchioni11) was similar to the one extracted in the present study. It possible reflects particular eating habits among university students. Among the evaluated students, for example, the Western DP had a positive charge for processed juice, a drink daily offered by the UC. This DP explained a greater part of the lunch variability than that estimated to the Brazilian adult population (10·2 v. 6·0 %).
The lack of studies about meal patterns of college students limits the comparison of the findings. The comparison with global DP shows that the ‘Traditional’ DP extracted for lunch was similar to a ‘Traditional’ DP identified among Brazilian undergraduate students of nutrition(Reference Pereira-Santos, da Mota Santana and Neves de Carvalho3), and the ‘Vegetarian’ lunch DP was similar to a ‘Vegetarian’ global DP extracted for British students(Reference Sprake, Russell and Cecil8).
In the present study, students from lower economic classes had greater adherence to the ‘Traditional’ lunch DP, consistent with a Brazilian study that evaluated global diet DP of adolescents(Reference Rodrigues, Pereira and Cunha36). This DP was composed of cheap protein sources, such as beans and poultry, and retained fruits and vegetables with low loads, reflecting a restricted DP, possibly as a consequence of food accessibility by lower-income students(Reference Deliens, Clarys and De Bourdeaudhuij37,Reference Ferraz, Oliveira and Moralles38) .
Students who smoked, those who lived in shared houses and who had lunch at the university showed greater adherence to the ‘Western’ lunch DP. Smokers are under nicotine interference in taste(Reference Vennemann, Hummel and Berger39), which contributes to the preference of these students for more palatable foods. The absence of parental control over food consumption(Reference Deliens, Clarys and De Bourdeaudhuij37) as well as friends’ influence on dietary habits(Reference Contento, Williams and Michela40), possibly are related to the chosen for less healthy foods at lunchtime. On the other hand, the selective consumption of specific food items, offered at lunch by the UC, and the replacement of a traditional lunch for items bought at campus cafeterias, could explain the direct association of this DP with having lunch at the university.
Students with obesity, male and those who bought snacks at the university showed a lower adherence to ‘Vegetarian’ lunch DP. Obesity has been associated with a lower fruit and vegetable intake(Reference Boeing, Bechthold and Bub41) and with a higher intake of energy-dense foods(Reference Vernarelli, Mitchell and Rolls42). The law availability or the high cost of fruits and vegetables at university cafeteria(Reference Pulz, Martins and Feldman43,Reference Roy, Soo and Conroy44) can explain the lower adherence to the ‘Vegetarian’ DP by students who bought snacks at the university most frequently. It is noteworthy that the association found in this study between the lunch vegetarian dietary pattern and obesity may be the result of reverse causality, given the cross-sectional design of the study. Still regarding the ‘Vegetarian’ lunch DP, students who lived alone showed higher adherence to this pattern compared with those who lived with their parents, which may be the result of greater autonomy in food choices when leaving parents’ home.
Regarding dinner, the ‘Beans, rice and processed juice’ DP was similar to the ‘Traditional’ pattern identified by Santos et al. (Reference Santos, Fisberg and Marchioni11) for dinner in the Brazilian population; however, this pattern explained most of the variance in dinner food consumption in the present study (14 v. 9·4 %) than in Santos et al. (Reference Santos, Fisberg and Marchioni11) study. Most food items of this DP are consistent with Brazilian recommendations for a healthy dinner(10). UC may contribute to the adoption of healthier eating habits among students, favouring the achievement of their nutritional needs(Reference Perez, Castro and Canella45), which is especially important among lower-income students, who showed greater adherence to the ‘Beans, rice and processed juice’ dinner DP, in the present study.
Santos et al. (Reference Santos, Fisberg and Marchioni11) found ‘Soups and fruits’ and ‘Coffee with milk and bread’ dinner DP, which were not identified in the present study, reflecting singular characteristics of this population group regarding food consumption. At dinner, some DP may indicate the replacement of the traditional dinner by snacks (‘White bread and butter/margarine’ DP) or the adoption of a restrictive diet, such as a low-carbohydrate diet(Reference Oh and Uppaluri46) (‘White meat, eggs and natural juice’ DP).
The meal DP identified in the present study were consistent with the findings of studies that assessed the dietary intake of college students which observed a low intake of fruit(Reference Alves and Boog47), vegetables and dairy products and a high intake of foods high in fat, salt and sugar(Reference Bernardo, Jomori and Fernandes1,Reference Brunet, Sabiston and O’Loughlin48,Reference De Piero, Bassett and Rossi49) . In this study, it was not identified a healthy or prudent dietary pattern at any meal, although they have been identified among college students for the global diet(Reference Pereira-Santos, da Mota Santana and Neves de Carvalho3,Reference Blondin, Mueller and Bakun7,Reference Sprake, Russell and Cecil8) .
This study highlighted the influence of eating on campus on students’ food consumption, as the DP extracted for the three meals consisted of food provided by the UC and on-campus cafeterias; moreover, such DP were associated with having meals at the campus. The UC have a high potential to effectively promote and support healthier choices, by supplying a balanced and proper diet and favouring students making healthy decisions. In the studied university, the UC menu is planned by a nutritionist and structured with a starter, a main protein dish or equivalent option, a garnish, a side dish, a dessert and beverages. It is based on healthy foods and is in accordance with Brazilian Dietary Guidelines. It has a great role in offering a proper diet to students, especially for those from low economic classes. On the other hand, it would be helpful to make some adjustments in order to better contribute to healthier choices among students by reducing the availability of ultraprocessed foods.
The university food environment has been characterised by a high availability of unhealthy foods and low availability of healthy foods(Reference Roy, Soo and Conroy44,Reference Roy, Hebden and Kelly50,Reference Tseng, DeGreef and Fishler51) . It is important to discuss a food and nutrition policy for higher education and to develop institutional strategies to encourage students to maintain healthy eating habits. Institutions could increase the availability and accessibility of healthy food items on campus, control the price of healthy food, teach students cooking skills, make affordable living spaces, with tables, microwave oven and refrigerator, with a view of increasing autonomy and better food choices among those who cook their own meals.
The limitations of this study include subjective decisions that need to be made in any study about DP, such as the number of factors extracted and the grouping of foods. In the 24-h recalls, the eating occasions were not discriminated by the respondent, so to identify the foods to be included in each meal, an algorithm considering the time of food consumption was established (breakfast 06.00–08.00 hours; lunch 11.00–14.00 hours; dinner 17.00–20.00 hours). The same algorithm was used for weekdays and weekend days, and this may represent some limitation as it is possible that meal times may change on weekends. Furthermore, there is the possibility of misclassification of the meals, not only because meals were identified according to the time of food intake but also because a minimum energy value to consider eating occasion as a meal was no established(Reference Gibney and Wolever52); therefore, any dietary intake made within the considered time interval defined as a meal.
The study sample was conveniently selected; nevertheless, there were no statistical differences among students who answered and did not answer the 24hR regarding socio-economic and demographic characteristics and weight status (data not shown).
As a strong point of the study, it is worth mentioning the choice of the 24hR for the data collection of food consumption. The use of 24hR as a method for assessing food intake makes of the detailed collection of data on food intake possible and is less influenced by systematic error(Reference Olinto, Kac, Sichieri and Gigante31). In addition, 1-d food intake data obtained from 24hR or dietary records provide reliable information on population means(Reference Dodd, Guenther and Freedman53).
The originality of this study is highlighted by proposing the evaluation of the dietary pattern of university students per meal. Other studies have shown advantages in the identification of meal eating patterns. Santos et al. (Reference Santos, Fisberg and Marchioni11) stress that this information is important to understanding eating habits in order to plan more objectively nutrition education interventions, and Schwedhelm et al. (Reference Schwedhelm, Iqbal and Knüppel54) pointed out that the DP of a single meal may be representative of the global DP.
On the other hand, Murakami et al. (Reference Murakami, Livingstone and Sasaki55) observed that no meal eating pattern alone is able to explain the DP of the global diet; hence, when planning intervention actions, it is advisable to recognise the dietary pattern of different meals. Unhealthy DP of the global diet, characterised by sweets, desserts and refined grains and by red and processed meat, usually named ‘Western’ have been directly associated with low-grade chronic inflammation, as observed in a systematic review with upper 18-year-old individuals(Reference Barbaresko, Koch and Schulze56) and with cardiometabolic alterations among children and adolescents(Reference Rocha, Milagres and Longo57).
Although this study did not evaluate metabolic parameters, the identification of meal eating patterns may be important to evaluate the effect of meals in unfavourable metabolic alterations, both postprandial and fasting, similarly to that observed by the global DP, and may contribute to planning intervention actions to avoid these alterations.
It is noteworthy that in an analysis of overall DP, it would not be possible to identify that there was a breakfast DP composed only of ‘Coffee and tea’ or a ‘Vegetarian’ DP extracted for lunch, which retained items such as vegetables and fruit, could be termed ‘Prudent’ in a global diet analysis, since in this case, it would not reflect the absence of animal food in the diet.
Finally, there is a clear need for the development of longitudinal studies that evaluate possible changes in dietary eating patterns throughout the university life and the effect that these changes may have on the health, nutrition and quality of life of these young people.
Conclusion
The meal eating patterns extracted in this study among university students showed this population has specific eating habits in each meal. The identification of meal DP may contribute to better understanding of college students’ eating habits, and it is crucial to determine specific targets for nutrition and health intervention. Additionally, a contribution of the study is the identification of factors associated with each meal dietary pattern of college students.
Food items daily offered at UC composed of specific meal patterns, like jam, chocolate drinks and processed juice, and having each meal at the university campus was associated with at least one meal pattern, indicating that campus food environment influence on students’ dietary habits. Given that college students have meals on campus, recognising meal eating patterns is important to support healthy eating promotion strategies on campus; moreover, the meal eating patterns identified in our study were strongly associated with food consumption on campus. In the studied university, the canteen offers three main meals daily, for a low cost, and the menu is in accordance with Brazilian Dietary Guidelines, contributing to food and nutrition security, besides favouring commensality. Because this is a cross-sectional study, further studies are needed to confirm the findings.
Acknowledgements
The authors would like to thank the collaboration of the students who kindly agreed to participate in the study.
This research received no specific grant from any funding agency, commercial or not-for-profit sectors.
All authors contributed to interpretation of the results and approved the final version of the manuscript. L. B. F. contributed to the data collection, management and coordination for the research execution, literature review, concept of the manuscript, statistical analysis, writing and critical revision of the manuscript for important intellectual content; L. P. P. contributed to statistical analyses and critical revision of the manuscript for important intellectual content, data collection, management and coordination for the research execution; A. C. S. A. contributed to statistical analyses and critical revision of the manuscript for important intellectual content; B. M. G. collaborated in the manuscript concept, statistical analyses and provided essential methodological advice; P. R. M. R. and A. P. M. were responsible for designing the cohort study (ELESEU), contributed in the manuscript concept and critical revision for important intellectual content; R. A. P. contributed with writing the manuscript and was responsible for designing the cohort study (ELESEU); M. G. F. contributed with concept and writing of the manuscript, critical revision of the manuscript for important intellectual content and was responsible for designing the cohort study (ELESEU).
The authors declare that there are no conflicts of interest.
Supplementary material
For supplementary material referred to in this article, please visit https://doi.org/10.1017/S0007114520003761


