


Pregnancy during adolescence accounts for up to one-fifth of all births worldwide(1) and the situation is similar in Brazil, where 21 % of the babies born in the public health system are from adolescent mothers(2). Adolescence is an intense anabolic period, characterized by linear growth, increase in body mass, development of internal organs and systems, skeletal and sexual maturation and changes in the amount and distribution of adipose tissue(Reference Mascarenhas, Zemel, Tershakovec, Stallings, Bowman and Russell3). When pregnancy and subsequent lactation are superimposed upon adolescence, nutritional risks associated with each condition may be further enhanced. Nutritional surveys show that adolescents have dietary habits that differ from those of adults(Reference Moran4) and, in regard to fat intake, they present a relatively high intake of food sources of saturated fat and low intake of food sources of polyunsaturated fat(Reference Andrade, Pereira and Sichieri5, Reference Barros, Pereira, Gama and Leal6). Therefore, essential fatty acids (EFA; 18 : 2n-6 and 18 : 3n-3) and n-6 and n-3 long-chain PUFA (LCPUFA) status in adolescent mothers might be poorer than in adult mothers.
The habitual diet and maternal fatty acid status influence the fatty acid composition of breast milk(Reference Jensen7, Reference Yuhas, Pramuk and Lien8), which is an important source of EFA and LCPUFA to infants. LCPUFA, especially arachidonic acid (AA; 20 : 4n-6) and DHA (22 : 6n-3), are indispensable functional and structural components of all cellular membranes and are required for neural, visual and vascular development in infants(Reference Crawford9). Studies with adult women have shown that the intake of EFA and LCPUFA from the diet or from supplements affects maternal status during gestation(Reference Parra, Schnaas, Meydani, Perroni, Martinez and Romieu10–Reference Pontes, Torres, Trugo, Fonseca and Sichieri12) and lactation(Reference Henderson, Jensen, Lammi-Keefe, Ferris and Dardick13, Reference Jensen, Maude, Anderson and Heird14) and milk composition(Reference Henderson, Jensen, Lammi-Keefe, Ferris and Dardick13–Reference Boris, Jensen, Salvig, Secher and Olsen17).
The maternal circulating fatty acids are the major direct sources of LCPUFA present in human milk(Reference Neville and Picciano18, Reference Marangoni, Agostoni, Lammardo, Bonvissuto, Giovannini, Galli and Riva19). They are available to the mammary gland from VLDL TAG, which are synthesized in the liver, chylomicron TAG, from the maternal diet, and plasma NEFA, from maternal adipose tissue. Therefore, maternal circulating fatty acids affect EFA transfer to breast milk. In a previous study with Brazilian lactating adult women, both the n-6 and n-3 fatty acids in human milk were associated with NEFA composition(Reference Torres, Ney, Meneses and Trugo20).
The fatty acid composition of the erythrocyte membrane (EM) has been used as a biochemical and functional index of EFA and LCPUFA maternal status(Reference Pontes, Torres, Trugo, Fonseca and Sichieri12, Reference Ruyle, Connor, Anderson and Lowensohn21–Reference Vlaadingerbroek and Hornstra24) and as a biochemical marker of intake of fatty acids not synthesized endogenously(Reference Parra, Schnaas, Meydani, Perroni, Martinez and Romieu10, Reference Henderson, Jensen, Lammi-Keefe, Ferris and Dardick13, Reference Hunter and Willett25–Reference Torres, Meneses and Trugo27). In addition, the fatty acid composition of EM showed associations with breast milk n-3 PUFA in adult lactating women(Reference Torres, Ney, Meneses and Trugo20). Several indices derived from fatty acid composition in structural phospholipids, such as those of the EM, have been proposed and used as proxies for EFA and LCPUFA status in different studies(Reference Vlaadingerbroek and Hornstra24, Reference Holman, Johnson and Ogburn28–Reference Hoffman and Uauy30). Some of these are the mean melting point (MMP = ∑ (mol% × melting point (°C) of individual fatty acids))(Reference Holman, Johnson and Ogburn28), the DHA indices (22 : 6n-3:22 : 5n-6 and 22 : 5n-6:22 : 4n-6 ratios)(Reference Vlaadingerbroek and Hornstra24, Reference Fokkema, Smit, Martini, Woltil, Boersma and Muskiet29) and EFA status index (EFASTI = (∑n-3+∑n-6)/(∑n-7+∑n-9))(Reference Vlaadingerbroek and Hornstra24), which are useful for comparison within and between different studies. These indices provide complementary information and when used together are likely to give better estimates of EFA and LCPUFA maternal status, although cut-off values to define sufficiency or deficiency based on physiological or clinical outcomes have not yet been clearly established.
The impact of lactation on the adolescent status of EFA and LCPUFA has not been reported and the association between milk fatty acid composition and plasma NEFA and EM composition has not been evaluated in lactating adolescents. The aims of the present study were to evaluate EFA and LCPUFA status in lactating adolescents and its association with breast milk composition.
Methods and materials
Volunteers and data collection
Adolescent nursing mothers, apparently healthy, attending four public day-care clinics of the Municipal Health Secretary in Rio de Janeiro, Brazil, were recruited during the appointment with their babies' paediatricians for this cross-sectional study. The study protocol was approved by the Ethics Committee of the Municipal Health Secretary of Rio de Janeiro and its conduction was in accordance with the Declaration of Helsinki. The four clinics chosen were reference clinics for adolescent mothers, predominantly of low socio-economic status, and were located in different regions of the city.
First, a screening for potential participants of the study was done for a period of 6 months through interviews during regular attendance to the clinics and through their medical records. The study eligibility criteria were: (1) adolescent mothers (14–19 years) of a healthy full-term singleton infant, exclusively or predominantly breast-fed (breast milk plus sparse use of water, water-based infusions, such as teas and herbs, and water-diluted fruit juices, without substituting a feeding from the breast)(31); (2) years post-menarche ranging from 2 to 6; 3) absence of chronic diseases or process of acute illness; (4) 30–120 d postpartum at the time of milk collection; (5) no intake of dietary supplements; (6) amenorrhoea.
Thirty adolescents, who met the eligibility criteria, who were willing to participate and had the consent of their parents/relatives or legal tutors, were enrolled in the present study. All participants and/or one of their parents/relatives or legal tutors signed an informed consent form prior to enrolment.
The enrolled mothers were asked to return on appointed days within 1 or 2 weeks of the first contact for milk and blood sampling and for dietary assessment. On the appointed day, maternal weight and height were measured and the BMI (kg/m2) was calculated. Dietary intake was estimated through three 24 h dietary recall questionnaires, starting on the appointed day and followed by two more interviews 1 week apart. To facilitate maternal report of food portion sizes, a photographic index of foods was used. Energy and fat intakes were quantified by The Food Processor Nutrition Analysis software, version 7.20 (ESHA Research, Salem, OR, USA), with the database adapted for use of the most common fat sources in the Brazilian diet(32). Additionally, data on frequency of intake of fish, vegetable oils, margarine and butter were obtained in detail through a specific FFQ.
General data on maternal characteristics (chronological age, age at menarche, duration of gestation, use of supplements, weeks postpartum, breast feeding practices, socio-economic status and education level) and on infant's weight and length at birth were obtained through standardized questionnaires and medical records on the day of the first contact.
Collection and analyses of blood and breast milk samples
Breast milk and venous blood samples were collected once in the morning (08.00 to 10.00 hours) from all volunteers, after fasting for approximately 11 h, which was within the time required for sampling blood to analyse fasting NEFA, insulin, glucose and insulin-like growth factor 1 (IGF-1).
Milk was collected by complete expression with a manual syringe-style breast pump from the breast that was not suckled in the previous feeding, which occurred 90–180 min earlier (135 (sd 38) min). Milk aliquots were taken for immediate determination of total fat content by the crematocrit method(Reference Lucas, Gibbs, Lyster and Baum33). Milk samples were stored in glass tubes at − 20°C under N2, for up to 1 month, for analyses of total milk protein(Reference Trugo, Donangelo, Koury, Silva and Freitas34), lactose(Reference Perry and Doan35) and fatty acids.
Venous blood samples (4 ml) were collected immediately before milk collection by venipuncture into tubes, containing or not containing K-EDTA as anticoagulant, which were kept on ice. Aliquots of whole blood were separated for immediate determination of haematocrit, by centrifugation in capillary tubes (Hemospin centrifuge; Incibrás, São Paulo, Brazil), and of haemoglobin concentration, by the cyanomethemoglobin reaction (BioClin-Quibasa kit, Sao Paulo, Brazil). Plasma or serum was immediately separated from the cell fraction by centrifugation at 4°C, divided in aliquots and stored for up to 1 month at − 20°C under N2 for later analyses. Plasma was used for analysis of NEFA, and serum aliquots were used for determinations of insulin (solid-phase RIA; Coat-a-Count Insulin, Diagnostic Products Corporation, Los Angeles, CA, USA), glucose (glucose oxidase method; BioClin-Quibasa kit) and IGF-1 (IRMA, Diagnostic Systems Laboratories-DSL, TX, USA). The packed erythrocytes were washed three times with isotonic NaCl (9 g/l) after removal of the buffy coat. The washed erythrocytes were suspended in an equal volume of isotonic NaCl and stored at − 20°C with sodium dithionite at a final concentration of 10 g/l in the erythrocyte suspension to avoid oxidation of unsaturated fatty acids(Reference Broekhuyse36).
Analyses of fatty acids in milk, plasma and erythrocyte samples
For the analyses of milk fatty acids, samples were defrosted in a water bath (38°C) and homogenized by inversion and by agitation in an ultra-sonic bath to disperse the coalesced fat. Total lipids were extracted from 1·0 ml milk aliquots, in duplicates, by the method of Bligh & Dyer(Reference Bligh and Dyer37) as described by Jensen et al. (Reference Jensen, Lammi-Keefe and Koletzko38). The chloroform extracts, containing butyl-hydroxytoluene (1 g/l; Sigma Chemical Co., St Louis, MO, USA), were dried under N2 and the residue was suspended in 10·0 ml chloroform–methanol (10:1, v/v) and stored at − 20°C in glass vials with polytetrafluoroethylene lined screw caps with a N2 atmosphere. Milk fatty acids were methylated by the use of the transesterification method of Kramer et al. (Reference Kramer, Fellner, Dugan, Sauer, Mossoba and Yurawecz39) and extracted as described by Torres et al. (Reference Torres, Ney, Meneses and Trugo20). The fatty acid methyl esters (FAME) were analysed by GC as described by Torres et al. (Reference Torres, Trugo and Trugo40).
Erythrocyte fatty acids were analysed as previously described(Reference Torres, Ney, Meneses and Trugo20).
NEFA were isolated from plasma, after addition of the internal standard (17 : 0), with fumed silicon dioxide according to Polette et al. (Reference Polette, Durand, Floccard and Blache41). After transesterification, the resulting FAME were analysed by GC using splitless injection as described elsewhere(Reference Torres, Ney, Meneses and Trugo20, Reference Ney, Torres and Trugo42).
FAME from milk, erythrocyte and plasma samples were analysed in a Shimadzu GC-14B (Kyoto, Japan) gas chromatograph, using an Omegawax-320 column (Supelco Co., Bellefonte, PA, USA). FAME were identified as described by Torres et al. (Reference Torres, Ney, Meneses and Trugo20, Reference Torres, Trugo and Trugo40).
All the materials used for sample storage and analyses were thoroughly rinsed with alcoholic potassium hydroxide (25 g/l) and soaked in nitric acid (130 g/l) for at least 2 h. All organic solvents used were of chromatographic grade (Tedia, São Paulo, Brazil) and were periodically tested for the presence of peroxides (Merkoquant® test stripes; Merck, Darmstadt, Germany). Samples were analysed as duplicates, and inter- and intra-assay CV for the gas-chromatographic analyses were as previously reported(Reference Torres, Trugo and Trugo40, Reference Ney, Torres and Trugo42).
To evaluate the EFA and DHA status of the volunteers, the following indices(Reference Vlaadingerbroek and Hornstra24) were used as proxies for status and were calculated from the composition of erythrocyte fatty acids: EFASTI was obtained by dividing the sum of the essential n-3 and n-6 fatty acids by the sum of the non-essential n-7 and n-9 fatty acids; DHA indices were calculated as the 22 : 6n-3:22 : 5n-6 and 22 : 5n-6:22 : 4n-6 ratios. Increased 22 : 6n-3:22 : 5n-6 indicates a balance between metabolic equivalent members of n-3 and n-6 LCPUFA, which favours DHA(Reference Fokkema, Smit, Martini, Woltil, Boersma and Muskiet29). Therefore, the higher this index, the higher the functional DHA status(Reference Vlaadingerbroek and Hornstra24). On the other hand, increased 22 : 5n-6:22 : 4n-6 indicates a balance favourable to n-6 LCPUFA in relation to DHA(Reference Vlaadingerbroek and Hornstra24, Reference Fokkema, Smit, Martini, Woltil, Boersma and Muskiet29). Therefore, the higher this index, the lower the functional DHA status(Reference Vlaadingerbroek and Hornstra24).
The MMP, which is an index of ‘fluidity’ and possibly of PUFA deficiency, was determined on the basis of the fatty acid composition of the EM(Reference Holman, Johnson and Ogburn28). MMP was calculated by summing the products of mole fraction times melting point (°C)(Reference Glew, Huang, VanderJagt, Chuang, Bhatt, Magnussen and VanderJagt43) for each fatty acid in the mixture.
Statistical analysis
Data were analysed with Statgraphics v. 7 (Statistical Graphics Corporation, Manugistics, Inc., Cambridge, MA, USA). Variables with non-normal distribution were normalized with log transformation before analysis. Pearson correlation analysis was used to investigate associations among continuous variables (milk fatty acids, plasma NEFA, erythrocyte fatty acids, EFASTI, DHA indices, MMP, BMI, age, years post-menarche, weeks postpartum, insulin, glucose, insulin:glucose ratio, IGF-1).
Multiple regression analysis was performed between: (a) selected breast milk PUFA (dependent variables) and fatty acids in NEFA and in EM (independent variables); (b) MMP (dependent variable) and EM fatty acids (independent variables). Fatty acids were included as independent variables based on biological relevance and/or on the Pearson correlation analysis results. Independent variables that presented P>0·05 for their coefficients in the model were maintained when their exclusion resulted in worse values for adjusted R 2 and mean absolute error of estimated value. The final models were further evaluated by the aid of their respective normal probability plots. Two-sided P values < 0·05 were considered as statistically significant.
Results
Table 1 presents the general characteristics, breast milk macronutrients and dietary fat intake of the adolescents participating in the present study. The average BMI was within the range for eutrophic populations(31). Total lipid intake contributed to approximately 27 % of the total energy intake of the volunteers and was within the acceptable macronutrient distribution ranges(44), whereas n-3, n-6 and total PUFA mean intakes were lower than the acceptable macronutrient distribution ranges(44). Only 10 % of the volunteers reported regular intake of fish and fish products, showing a low intake of a major source of n-3 LCPUFA. All volunteers reported a daily intake of foods prepared with soyabean oil, which is the main source of EFA, especially 18 : 2n-6. Margarine and butter, sources of saturated and monounsaturated fat, were regularly consumed by 90 % of the mothers.
Table 1 General characteristics, breast milk composition and dietary fat intake of the lactating adolescents (n 30)*
(Mean values and standard deviations)
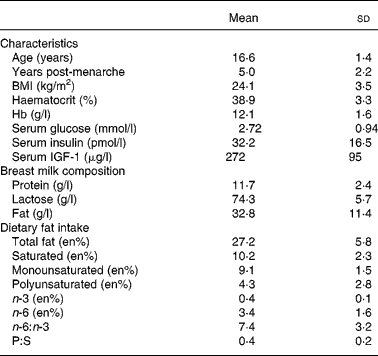
IGF-1, insulin-like growth factor 1; en%, nutrient intake relative to energy intake (%); P:S, polyunsaturated:saturated fat ratio.
* For details of subjects and procedures, see Methods and materials.
Duration of gestation was 38·8 (sd 1·6) weeks and infants' birth weight and birth length were, respectively, 3·1 (sd 0·59) kg and 49·6 (sd 3·3) cm.
Table 2 presents the fatty acid percentage composition (g/100 g total fatty acids) of the breast milk samples. Fatty acids with 10 to 14 carbons contributed to approximately 30 % of the total milk fatty acids. Total SFA, MUFA, PUFA and LCPUFA ( ≥ 20 carbons) comprised, respectively, 50·7 (sd 7·8) %, 28·9 (sd 4·6) %, 19·5 (sd 5·4) % and 1·17 (sd 0·30) % of the total fatty acids. PUFA of the n-6 and n-3 series represented, respectively, 18·4 (sd 5·3) % and 1·7 (sd 0·5) %, and the ratio n-3:n-6 was 0·089 (sd 0·010) %. Three conjugated linoleic acid isomers were identified in the samples, amounting to about 0·3 %.
Table 2 Fatty acid contents (g/100 g total fatty acids) in milk from lactating adolescents (n 30)†
(Mean values and standard deviations)

CLA, conjugated linoleic acid.
* Includes the 18 : 1n-9, 18 : 1n-7 and 18 : 1n-5 isomers, which were considered together because separation was dependent on concentration in the samples.
† For details of subjects and procedures, see Methods and Materials.
EM and plasma NEFA compositions (g/100 g total fatty acids) of the lactating women are presented in Table 3. Nineteen fatty acids were identified in EM (Table 3); 16 : 0 and 18 : 0 were the major fatty acids. Total PUFA and LCPUFA comprised, respectively, 35 % and 26 % of the EM fatty acids and those of the n-6 series, mainly AA and 18 : 2n-6, were the most abundant PUFA. DHA was the major n-3 PUFA. PUFA of the n-6 and n-3 series were 27·7 (sd 2·6) % and 8·6 (sd 2·3) %, respectively, and the n-3:n-6 ratio was 0·32 (sd 0·13) % in EM. Eleven fatty acids were identified in plasma NEFA. The major fatty acids in NEFA were 18 : 0, 18 : 2n-6 and 18 : 1n-9. PUFA of the n-3 series, except 18 : 3n-3, and those with twenty-two carbons of the n-6 series were not detected in plasma NEFA. Conjugated linoleic acid was not detected in EM or NEFA.
Table 3 Fatty acid contents (g/100 g total fatty acids) of erythrocyte membrane (EM) and plasma NEFA in Brazilian lactating adolescents (n 30)*
(Mean values and standard deviations)
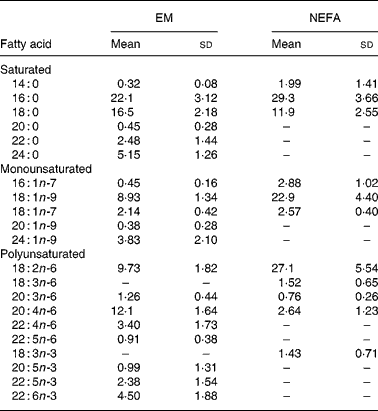
* For details of subjects and procedures, see Methods and materials.
The concentrations of the individual NEFA in μmol/l plasma were also calculated (results not shown) and total NEFA was 753 (sd 360) μmol/l. There was no correlation between total plasma NEFA and IGF-1, fasting insulin, glucose or insulin:glucose ratio, either between total plasma NEFA and years post-menarche, weeks postpartum or BMI (Pearson's correlation analysis).
The results for the evaluation of PUFA status of the lactating adolescents, using indices based on the EM fatty acid composition, were: EFASTI 2·24 (sd 0·21); 22 : 5n-6:22 : 4n-6 ratio 0·27 (sd 0·10); 22 : 6n-3:22 : 5n-6 ratio 5·88 (sd 4·03); MMP 24·8 (sd 3·0)°C. These results are consistent with their dietary pattern of low intake of LCPUFA food sources, especially for the n-3 series.
MMP presented several correlations (Pearson analysis) with indices of PUFA status and with individual fatty acids. As expected, MMP was negatively associated (P < 0·05) with several individual LCPUFA (results not shown). MMP was also negatively associated with n-3:n-6 ratio (r − 0·58, P = 0·029), EFASTI (r − 0·62, P = 0·029) and 22 : 6n-3:22 : 5n-6 (r − 0·66, P = 0·014) and positively associated with 22 : 5n-6:22 : 4n-6 (r 0·59, P = 0·017). These correlations were used as the basis for choosing the independent variables that were entered in the models of MMP by multiple regression analysis.
The best resulting models for erythrocyte MMP obtained from multiple regression analysis are shown in Table 4. The best models obtained with individual fatty acids and years post-menarche (adjusted R 2 0·61) or weeks postpartum (adjusted R 2 0·84) as independent variables included 18 : 0, 20 : 4n-6, 22 : 4n-6 and 22 : 6n-3 or 22 : 4n-6 and 22 : 6n-3, respectively. The best model (adjusted R 2 0·94) obtained with fatty acid status indices as independent variables included only SFA, PUFA and 22 : 6n-3:22 : 5n-6 ratio.
Table 4 Multiple regression analysis for modelling of erythrocyte membrane (EM) mean melting point (MMP)*
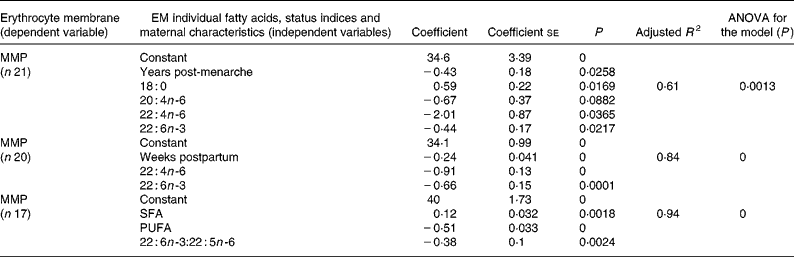
* For details of subjects and procedures, see Methods and materials.
Similarly, multiple regression analysis was employed for modelling of milk EFA and LCPUFA, using selected NEFA and EM fatty acids or PUFA status indices as independent variables, based on significant associations found by Pearson correlation analysis (results not shown) and/or biological significance of the fatty acids. The variation of milk DHA was the only one that could be explained by maternal fatty acids through multiple regression analyses. The regression models for milk DHA are presented in Table 5. The best model obtained with individual fatty acids as independent variables (adjusted R 2 0·72) included only the two EFA in NEFA, linoleic and linolenic acids, one saturated fatty acid and one LCPUFA in the EM. In the case of fatty acid status indices, the best model (adjusted R 2 0·98) included MMP, 22 : 5n-6:22 : 4n-6 and 22 : 6n-3:22 : 5n-6 ratios.
Table 5 Multiple regression analysis for modelling of breast milk DHA*
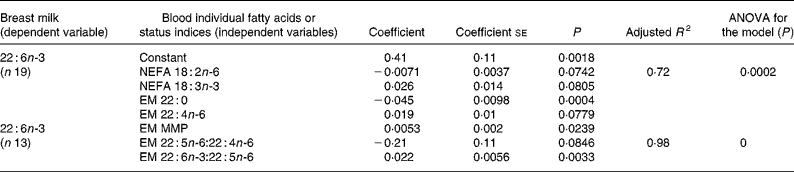
EM, erythrocyte membrane; MMP, mean melting point.
* For details of subjects and procedures, see Methods and materials.
Associations of individual fatty acids in milk, plasma NEFA and EM and of 22 : 5n-6:22 : 4n-6, 22 : 6n-3:22 : 5n-6, EFASTI and MMP with age, years post-menarche, weeks postpartum, BMI, IGF-1, fasting insulin and glucose, and insulin:glucose ratio were assessed by Pearson correlation analysis. Significant correlations were found between weeks postpartum and MMP (r − 0·55, P = 0·027), EFASTI (r 0·55, P = 0·049), EM SFA (r − 0·66, P = 0·004) and EM polyunsaturated:saturated fat ratio (r 0·61, P = 0·015); between years post-menarche and NEFA n-3 (r 0·51, P = 0·030) and NEFA 18 : 2n-6 (r − 0·52, P = 0·024); and between serum insulin:glucose ratio and EM 18 : 2n-6 (r 0·70, P = 0·002).
Discussion
There is a remarkable lack of studies on fatty acid composition of breast milk, EFA and LCPUFA status and their associations, in lactating adolescents. The present study carried out in Brazilian lactating adolescents is the first one to report these data.
The metabolic milieu during lactation favours fatty acid mobilization from adipose tissue and transfer to the mammary gland(Reference Allen, Bowman and Russell45). Accordingly, there is an increase in fasting plasma total NEFA of lactating adult women compared with non-lactating ones(Reference Butte, Hopkinson, Mehta, Moon and Smith46, Reference Torres, Ney, Ribeiro and Trugo47). Fasting plasma total NEFA concentration in the lactating adolescents of the present study was similar to that of lactating adult women (760 μmol/l(Reference Butte, Hopkinson, Mehta, Moon and Smith46); 630 μmol/l(Reference Tigas, Sunehag and Haymond48)).
Fasting serum insulin level and insulin:glucose ratio are reduced in lactating adult women(Reference Butte, Hopkinson, Mehta, Moon and Smith46, Reference Tigas, Sunehag and Haymond48). This decrease was also observed in the lactating adolescents of the present study, whose fasting serum insulin level and insulin:glucose ratio were, respectively, three-fold lower and two-fold lower than those of non-pregnant, non-lactating adolescents(Reference Heptulla, Smitten, Teague, Tamborlane, Ma and Caprio49), but similar to those of adult lactating women(Reference Butte, Hopkinson, Mehta, Moon and Smith46, Reference Tigas, Sunehag and Haymond48). As was the case for insulin concentration, IGF-1 concentration was similar to that of adult lactating women (230 μg/l)(Reference Butte, Hopkinson, Mehta, Moon and Smith46). Fasting serum insulin and IGF-1 concentrations in the lactating adolescents were not associated with fasting total NEFA or with fatty acid composition of NEFA, EM and milk.
Dietary fat intake of the lactating adolescents in the present study showed that n-3, n-6 and total PUFA mean intakes, expressed as percentage of total energy, were lower than the acceptable macronutrient distribution ranges(44) and the intakes reported for Brazilian lactating women of similar socio-economic level(Reference Torres, Ney, Meneses and Trugo20), resulting in lower polyunsaturated:saturated fat ratio and higher n-6:n-3 ratios in the diet of lactating adolescents as compared with the lactating adult women. The PUFA intake pattern in the present study is consistent with recent studies in pregnant(Reference Barros, Pereira, Gama and Leal6) and in non-pregnant, non-lactating adolescents(Reference Andrade, Pereira and Sichieri5) in Brazil, which showed a relatively high intake of food sources of saturated fat and low intake of unsaturated fatty acids, especially a very low intake of fish, based on the intake frequency of food sources of lipids. Based on current scientific evidence, it has been suggested(Reference Koletzko, Cetin and Brenna50) that pregnant and lactating women should aim for an average dietary intake of 200 mg DHA/d and that women of childbearing age should consume one or two portions of oily fish per week to attain satisfactory pregnancy outcomes and desirable infant growth and development. According to these recommendations, DHA intake of the lactating adolescents in the present study is likely to be inadequate.
The EFA and LCPUFA status of lactating adolescents, as indicated by erythrocyte EFASTI and DHA indices (22 : 5n-6:22 : 4n-6 and 22 : 6n-3:22 : 5n-6 ratios), was not different from that of Brazilian adult women during lactation (2·3 (sd 0·27), 0·24 (sd 0·06), 6·5 (sd 1·8), respectively; unpublished results, calculated based on data from Torres et al. (Reference Torres, Ney, Meneses and Trugo20)) or at the end of pregnancy(Reference Pontes, Torres, Trugo, Fonseca and Sichieri12), despite differences in PUFA intake pattern. Furthermore, lactating adolescents presented significantly higher levels of EPA, DHA, n-3:n-6 ratio and total n-6, n-3 and LCPUFA in erythrocytes than lactating adults. Regarding DHA indices, Brazilian pregnant(Reference Pontes, Torres, Trugo, Fonseca and Sichieri12) and lactating(Reference Torres, Ney, Meneses and Trugo20) adults and lactating adolescents presented lower 22 : 6n-3:22 : 5n-6 ratio and higher 22 : 5n-6:22 : 4n-6 ratio than Dutch pregnant women(Reference Vlaadingerbroek and Hornstra24), suggesting a worse DHA status in the Brazilian women. On the other hand, EFASTI was not different between Dutch(Reference Vlaadingerbroek and Hornstra24) and Brazilian women. Further comparison of erythrocyte EFA and DHA indices of Brazilian lactating adolescents with adolescent and adult lactating women from different countries was not possible due to lack of data.
In lactating adults, PUFA status improves during the postpartum period, as shown by increases from 2 to 16–32 weeks postpartum in erythrocyte 18 : 2n-6(Reference Otto, van Houwelingen, Badart-Smook and Hornstra51, Reference Torres, Meneses and Trugo52), 20 : 4n-6, 20 : 5n-3 and 22 : 5n-3(Reference Otto, van Houwelingen, Badart-Smook and Hornstra51). Consistently, lactating adolescents presented positive associations of time postpartum with erythrocyte EFASTI and polyunsaturated:saturated fat ratio. In contrast with the increase in several PUFA, erythrocyte DHA decreased in lactating adults during the postpartum period(Reference Otto, van Houwelingen, Badart-Smook and Hornstra51, Reference Torres, Meneses and Trugo52), but for the present group of lactating adolescents, erythrocyte DHA was not associated with time postpartum.
MMP, which involves contribution of all fatty acids present in the phospholipids, might be affected by shifts in fatty acid composition. High MMP may be indicative of EFA and LCPUFA deficiency, since fatty acids with more unsaturated bonds present lower melting points(Reference Holman, Johnson and Ogburn28). Pregnancy and lactation induce changes in contents of these fatty acids that result in increased MMP of plasma phospholipids, especially in the former condition(Reference Holman, Johnson and Ogburn28). Brazilian lactating adolescents presented a lower EM MMP (P < 0·01) than Brazilian pregnant adolescents (29·3 (sd 1·5)°C; unpublished results, calculated based on data from Meneses(Reference Meneses53)). This difference follows the same trend reported for plasma phospholipid MMP in adult women(Reference Holman, Johnson and Ogburn28).
Since all fatty acids contribute to MMP, several correlations between individual fatty acids and EM MMP have been found in the present study and in other studies using either milk MMP(Reference Glew, Huang, VanderJagt, Chuang, Bhatt, Magnussen and VanderJagt43) or plasma phospholipids MMP(Reference Holman, Johnson and Ogburn28). A more comprehensive approach to explain the variability of MMP is through multiple regression analysis, in which erythrocyte individual fatty acids and status indices, and other independent variables, are included in the models. In the present study, the three models (Table 4) obtained by multiple regression analysis for erythrocyte MMP included as independent variables with negative coefficients some individual LCPUFA and total PUFA, in separate models, as well as DHA and 22 : 6n-3:22 : 5n-6 ratio, also in separate models. These results suggest the use of erythrocyte MMP as a possible comprehensive biochemical marker of LCPUFA status in lactating adolescents. Time postpartum and years post-menarche presented negative coefficients for MMP variability in separate multiple regression models. A decrease in MMP with the advancing weeks postpartum in the lactating adolescents is consistent with the observed improvement of PUFA status during this period. Similarly, a decrease in MMP with longer time periods between menarche and lactation might be related to a possible better PUFA status in adolescents with longer post-menarche intervals.
In general, breast milk fatty acid composition of the lactating adolescents in the present study was not different from that observed before in Brazilian adults(Reference Torres, Ney, Meneses and Trugo20) of similar socio-economical and cultural backgrounds. It could be expected that adolescents would have less PUFA, especially 20 : 4n-6 and 22 : 6n-3, in their milk than lactating adults because of two factors. Dietary intake of n-3 and n-6 PUFA in the present group of adolescents was lower than in lactating adults but their status was similar(Reference Torres, Ney, Meneses and Trugo20) and the growing tissues of adolescents would compete with the mammary gland for essential nutrients(Reference Motil, Kertz, Montandon and Ellis54), similar to what occurs during pregnancy, when maternal tissues of the adolescents that are still growing compete with fetal tissues for nutrients(Reference Hediger, Scholl and Schall55, Reference Scholl, Hediger and Schall56). However, in the case of the present group of adolescents there were no significant differences of individual LCPUFA in breast milk between adolescents and adults. It is possible that transfer of EFA and LCPUFA to the mammary gland in adolescents is preferential in relation to maternal tissues and as efficient as in adult women.
Recently, Brenna et al. (Reference Brenna, Varamini, Jensen, Diersen-Schade, Boettcher and Arterburn57) reported a descriptive meta-analysis on breast milk DHA and AA concentrations that included sixty-five studies from different countries worldwide. The calculated DHA and AA concentrations; (g/100 g fatty acids) were 0·32 (sd 0·22) and 0·47 (sd 0·13), respectively, and variability (CV%) for DHA was 69 % and for AA was 28 %. The higher CV% for DHA (50 %) than for AA (38 %) in milk from adolescents belonging to the same population group in the present study is consistent with those findings. It should be noted that AA and especially DHA concentrations in milk from the lactating adolescents of the present study were lower (P = 0·019 and P = 0·006, respectively) than the calculated mean concentrations of these fatty acids in the meta-analysis(Reference Brenna, Varamini, Jensen, Diersen-Schade, Boettcher and Arterburn57).
In a previous study with lactating adult women(Reference Torres, Ney, Meneses and Trugo20), n-6 and n-3 fatty acids in human milk presented several associations, evaluated through Pearson correlation and multiple regression analyses, with NEFA and erythrocyte fatty acid composition. In contrast, fewer associations were found for lactating adolescents. The only two significant models found for breast milk fatty acids determined by multiple regression analysis were those for milk DHA (Table 5), especially the models including DHA indices and MMP as independent variables. Therefore, it seems that the PUFA concentration in milk from adolescents was less directly dependent on their concentrations in plasma NEFA and on maternal status assessed through erythrocyte fatty acid composition than in milk from adult women, except for milk DHA concentration, which was highly associated with DHA status of the lactating adolescents.
Several observational and intervention studies have shown that maternal intake of DHA is the most important factor determining the secretion of DHA in human milk(Reference Innis58). Despite an apparently lower intake of n-3 LCPUFA and the superimposed nutritional demands of lactation with adolescence, the group of adolescents in the present study presented EFA and LCPUFA status and concentrations in milk that were similar to those of Brazilian lactating adults(Reference Torres, Ney, Meneses and Trugo20), suggesting that these lactating adolescents were not disadvantaged regarding PUFA status. Furthermore, milk DHA was associated with erythrocyte indices of maternal LCPUFA and DHA states, providing evidence that breast milk DHA of lactating adolescents is dependent on maternal status, as occurs with adult women.
Acknowledgements
The authors are grateful for the cooperation of the volunteers participating in this study. The authors declare that there are no conflicts of interest and thank the funding support by the Conselho Nacional de Desenvolvimento Científico e Tecnológico (CNPq), Coordenação de Aperfeiçoamento de Pessoal de Nível Superior (CAPES) and Fundação Carlos Chagas de Amparo à Pesquisa do Estado do Rio de Janeiro (FAPERJ), Brazil. F.M. and N.M.F.T. thank CNPq for the granting of the PhD and the Research Fellowships, respectively. N.M.F.T. obtained funding for the study.


