


Nutrition plays an increasingly important role in the prevention of chronic diseases including CHD and type 2 diabetes mellitus (T2DM)(Reference Tapsell and Probst1,Reference Tapsell, Neale and Probst2) . The global prevalence of T2DM is increasing. In 2017, 424·9 million adults globally had diabetes and this is projected to increase to 628·6 million by 2045(3). Research has demonstrated that lifestyle strategies such as dietary changes are effective for the prevention and management of T2DM(Reference Ley, Hamdy and Mohan4). While dietary patterns exert the effect, they are the sum of individual food choices. There is therefore a need to establish the evidence for individual foods which may aid in the prevention of T2DM, as well as improve disease management for persons already diagnosed.
Walnuts are part of the nut category of foods but stand out for their high PUFA content(5) which is aligned to cholesterol lowering effects. This and other components in walnuts and nuts generally contribute to reduced risk of CHD. For the food category of nuts, habitual consumption has been associated with the reduced risk of CHD(Reference Luo, Zhang and Ding6–Reference Liu, Guasch-Ferré and Hu10), but the evidence base for T2DM is less consistent. Recent systematic reviews of observational and clinical studies have reported conflicting results, with an inverse relationship between nut intake and risk of T2DM found by one review(Reference Afshin, Micha and Khatibzadeh7), yet no association reported in others(Reference Luo, Zhang and Ding6,Reference Zhou, Yu and He8,Reference Wu, Wang and Zhu11) . Inconsistent results have also been reported when the effect of nut consumption on markers of glycaemic control has been investigated. In a systematic review restricted to individuals with T2DM, nut consumption was found to improve glycated Hb (HbA1c) and fasting glucose levels, with no impact on fasting insulin or homeostatic model assessment of insulin resistance (HOMA-IR)(Reference Viguiliouk, Kendall and Blanco Mejia12). Conversely, favourable effects of nut intake on fasting insulin and HOMA-IR were found in another review, although no effect on HbA1c or fasting glucose was found(Reference Tindall, Johnston and Kris-Etherton13). To our knowledge, an umbrella review of systematic reviews specifically exploring the effect of nut consumption in T2DM or markers of glycaemic control has not been conducted to clarify these inconsistent results.
Given the variation in composition of different types of nuts, there is value in considering the impact of individual nut categories. As stated earlier, walnuts are distinguishable from other nuts by virtue of a high PUFA content, including α-linolenic acid, while also delivering dietary fibre and phytochemicals(5,Reference Chen and Blumberg14) . A past analysis of the Nurses’ Health Study found increased consumption of walnuts was associated with reduced incidence of T2DM, although the relationship may be partly mediated by BMI(Reference Pan, Sun and Manson15). There may be a number of reasons for this observation. For example, secondary analysis from dietary trials(Reference Neale, Tapsell and Martin16,Reference Njike, Ayettey and Petraro17) demonstrated that provision of walnuts appeared to support changes in overall diet quality. Here, the consumption of walnuts could be implicated in whole-of-diet effects for behavioural as well as biological reasons. With these issues in mind, the aim of this systematic review and meta-analysis was to examine the effect of walnut consumption on markers of blood glucose control (fasting blood glucose, fasting insulin, HbA1c and HOMA-IR) in adults.
Methods
This systematic review was conducted according to the recommendations of the Cochrane Handbook for Systematic Reviews of Interventions(Reference Higgins and Green18) and was reported according to the Preferred Reporting Items for Systematic Reviews and Meta-Analyses statement(Reference Moher, Liberati and Tetzlaff19) (online Supplementary Data 1). The protocol for the review was prospectively registered with PROSPERO, the International Prospective Register of Systematic Reviews (https://www.crd.york.ac.uk/prospero/, CRD42019123636).
Study eligibility
To be eligible for inclusion in this review, studies were required to meet the following inclusion criteria: (1) randomised controlled trial study design (including parallel and cross-over designs, and studies where participants were randomised at either the individual or cluster level); (2) studies conducted with humans aged 18 years or older; (3) studies assessing the effect of consuming walnuts (as a whole or processed nut, or oil form) on biological markers of blood glucose control (fasting blood glucose, HbA1c, fasting insulin and HOMA-IR) and (4) studies where the effect of walnut consumption could be isolated from other food sources or interventions such as physical activity programmes. Eligible studies were not limited to those published in English, or by study duration.
Data sources
A systematic search of the databases MEDLINE (EBSCO), PubMed, Cumulative Index to Nursing and Allied Health Literature (EBSCO) and Cochrane Central Register of Controlled Trials was conducted by E.P.N. Date restrictions were not applied, and the databases were searched on 2 March 2019. Both MEDLINE and PubMed were searched to ensure that recent studies were detected, in line with recommendations by Rosen & Suhami(Reference Rosen and Suhami20). Where possible Medical Subject Headings in addition to free-text search terms were used in the search(Reference Rosen and Suhami20). Reference lists of eligible articles and relevant review articles were also reviewed for potential studies. An example of the search strategy is available in online Supplementary Data 2. Articles were initially processed using Endnote X8 (2017, Endnote X8.1 (software)) including removal of duplicates, before being transferred into Microsoft Excel (2016, Microsoft Excel version 16.0 (software)) for screening and full-text review.
Study selection
Articles were screened in duplicate based on the title and abstract. In the case that an abstract was not available or did not provide sufficient information to draw a conclusion regarding eligibility, the full-text articles were retrieved for further review. Following screening, full-text articles were reviewed in duplicate against the eligibility criteria. In the case that multiple articles reported results from a single study, all associated articles were checked to avoid duplication of study populations in the analysis. Where multiple articles reported different information for the outcomes of the same study, all relevant articles were included and linked together, as recommended by the Cochrane Handbook(Reference Higgins and Green18). When multiple articles reported the same outcomes from a single study, the article reporting the longest follow-up period was included in the review.
Data extraction
The following data were extracted from each study: citation, country, study design, sample size, participant age and BMI, participant health status, study duration, walnut form, dose of walnuts, details of control arm, background diet and the percentage dietary fat consumed in the intervention diet. Aggregate outcome data were extracted from each study. Where possible, the mean changes in the relevant biomarker outcomes and the respective standard deviation (or standard error/95 % CI) were obtained. When these data were not available, the mean final values and the respective standard deviation (or standard error/95 % CI) were retrieved as outlined in the Cochrane Handbook for Systematic Reviews of Interventions(Reference Higgins and Green18). Where median and interquartile range were provided, these were converted into mean and standard deviation using the formula developed by Wan et al. (Reference Wan, Wang and Liu21). As one study(Reference Holscher, Guetterman and Swanson22) provided only pooled standard error for the intervention and the control groups, this pooled standard error was used for both groups. In the case that the published study did not provide adequate information, study authors were contacted for additional details. Where available, data from intention-to-treat analyses were extracted for use in the meta-analysis. Where this was not available, data from per protocol analyses were used and the impact of these approaches on study results was considered in the risk of bias assessment (outlined below).
Abstract screening, full-text review and data extraction were conducted independently by two authors (E. P. N. and V. G.), with any disagreements were resolved via consensus. Where consensus could not be reached, a third author was consulted (Y. C. P.).
Risk of bias assessment
The Cochrane Collaboration Risk of Bias tool 2.0(Reference Sterne, Page and Elbers23) was used to determine the risk of bias in the included studies, with the effect of assignment to the interventions considered. E. P. N. and V. G. independently appraised the risk of bias, and disagreements were resolved by discussion until consensus was reached.
Data synthesis
Stata IC (version 15.1; StataCorp LLC) was used to conduct random effects meta-analyses, using the metan command (using the randomi option for random effects). This command uses the DerSimonian and Laird method with the heterogeneity estimate taken from the inverse variance fixed effects model(Reference Bradburn, Deeks and Altman24,Reference Harris, Deeks and Altman25) . Sensitivity analyses were also conducted using the random effects model with Hartung–Knapp–Sidik–Jonkman adjustment(Reference IntHout, Ioannidis and Borm26). Weighted mean differences (with 95 % CI) in change or final mean values for each outcome were calculated. As both parallel and cross-over studies were included in the review, both study designs were initially analysed the same way, using a paired analysis. This approach was used as it is the most conservative method for managing cross-over studies in meta-analysis(Reference Higgins and Green18). In addition, sensitivity analyses were conducted using paired analysis of cross-over studies with correlation coefficients of 0·25, 0·5 and 0·75, in order to determine if this analysis underweighted the cross-over studies, as conducted in our previous review on nuts as a food group(Reference Neale, Tapsell and Guan27). In the case of two studies which included more than one eligible intervention group and corresponding control groups(Reference Njike, Ayettey and Petraro17,Reference Müllner, Plasser and Brath28) , study groups were included in meta-analyses as separate effect sizes. Sensitivity analyses were then further conducted to examine the effect of pooling these separate study groups on results. Meta-analyses were conducted using available cases analyses, with attrition addressed as part of the risk of bias assessment (outlined below).
The I 2 test statistic was used to estimate the proportion of total variation attributable to the between-study heterogeneity(Reference Higgins, Thompson and Deeks29). In line with the guidance of Higgins et al.(Reference Higgins, Thompson and Deeks29), I 2 values of 25, 50 and 75 % were taken to indicate low, moderate and high heterogeneity. Contour funnel plots were created to determine the presence of small study effects for outcomes with ten or more effect sizes(Reference Sterne, Sutton and Ioannidis30). An Egger’s test was then conducted to examine the extent of funnel plot asymmetry(Reference Egger, Smith and Schneider31). ‘Leave-one-out’ sensitivity analyses were conducted to explore the effect of removing each individual study from the meta-analyses. In addition, to explore the effects in whole walnuts only, sensitivity analyses were conducted excluding studies using walnut oil(Reference Müllner, Plasser and Brath28,Reference Zibaeenezhad, Aghasadeghi and Hakimi32) . Pre-specified sub-group analyses (based on study quality, study duration (less than 3 months v. more than 3 months, aligning with the approaches used in previous meta-analyses of nut consumption(Reference Viguiliouk, Kendall and Blanco Mejia12,Reference Mejia, Kendall and Viguiliouk33) ) and health status of participants) were conducted to explore differences in the magnitude of effects between the sub-groups. In addition, post hoc sub-group analyses were conducted based on the dose of walnuts consumed (<50 v. >50 g/d, based on dose sub-groups used in a previous meta-analysis of nut consumption(Reference Mejia, Kendall and Viguiliouk33)) and the percentage of total dietary fat provided by the intervention diet (<37 v. ≥37 %/d, based on previous research which found beneficial effects of fat substitution at total fat intakes <37 %(Reference Vessby, Uusitupa and Hermansen34)). Sub-group analyses were conducted where there were at least ten effect sizes per outcome in total(Reference Higgins and Green18), although the number of effect sizes per individual sub-group was not restricted. The relationship between the nut dose (in studies exploring whole nuts only) and the study duration, as continuous characteristics, was then explored via random effects meta-regression using the metareg command(Reference Harbord and Higgins35) which uses the Knapp–Hartung variance estimator(Reference Knapp and Hartung36), where sample size permitted, as recommended by the Cochrane Handbook(Reference Higgins and Green18).
Quality of the body of evidence
The quality of the body of evidence (also known as certainty) was then determined using GRADE(Reference Guyatt, Oxman and Vist37) (GRADEpro GDT: GRADEpro Guideline Development Tool (Software). McMaster University, 2015 (developed by Evidence Prime, Inc.). Available from www.gradepro.org)
Results
A total of 3642 records were identified from the systematic search and the review of reference lists and review articles. After the removal of duplicates, 1862 records were screened and sixty-eight full-text articles were reviewed for eligibility. A total of fifty-one articles were excluded after full-text review, with the most common reasons for exclusion being an inability to isolate the effects of walnuts on the outcome of interest (n 15), for example, when walnuts were provided as part of a suite of dietary changes, the article did not report relevant outcomes (n 10), and relevant study outcomes were reported in another article included in the review (n 10) (Fig. 1, online Supplementary Data 3). This resulted in a total of seventeen articles describing sixteen studies included in this review. Through these articles, eighteen effect sizes were available for inclusion in the meta-analysis (Fig. 1).
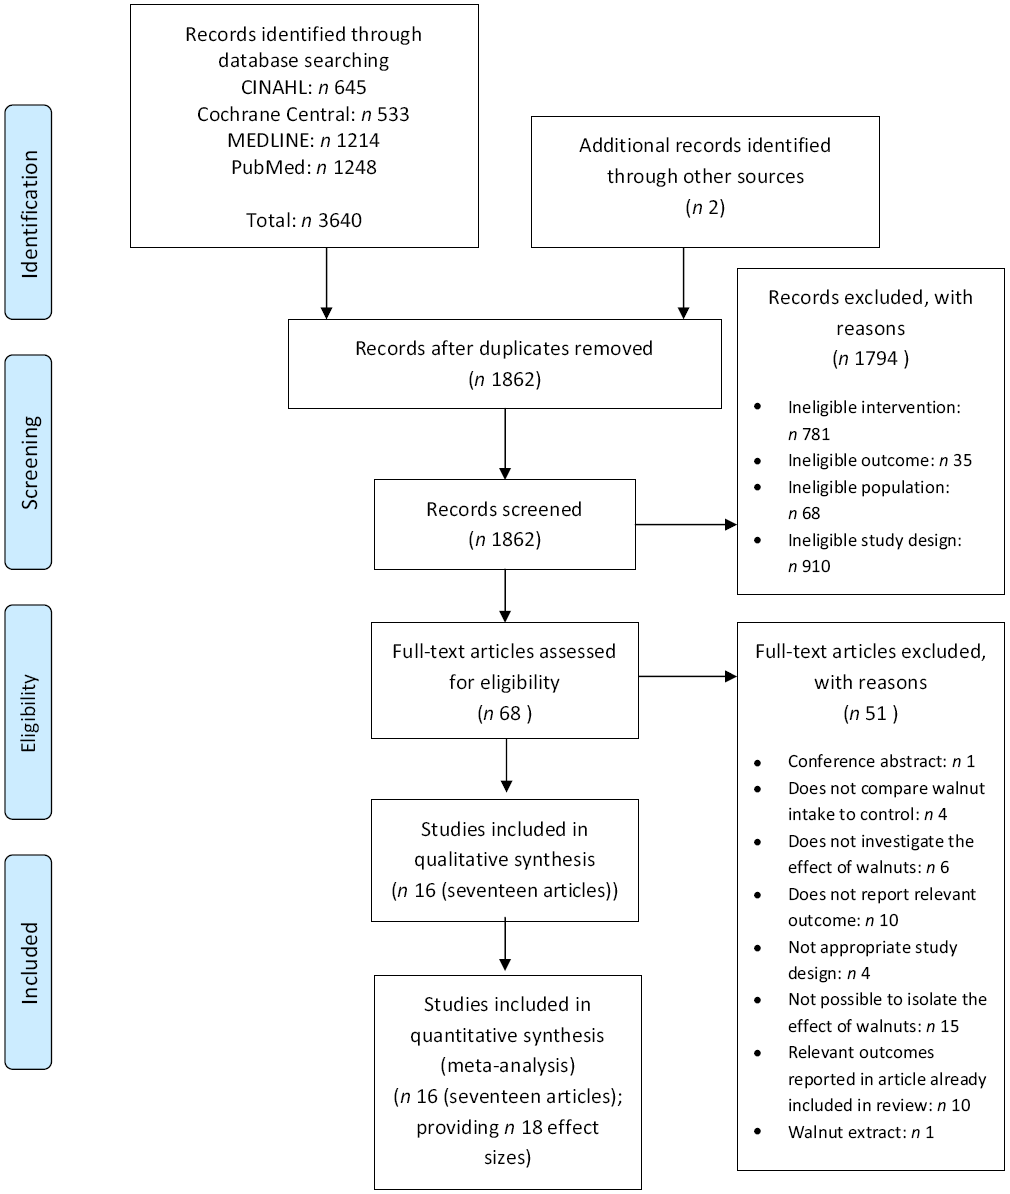
Fig. 1. Preferred Reporting Items for Systematic Reviews and Meta-Analyses flow diagram of study selection.
Study characteristics
Characteristics of included studies are outlined in Table 1. Eight studies(Reference Müllner, Plasser and Brath28,Reference Zibaeenezhad, Aghasadeghi and Hakimi32,Reference Mukuddem-Petersen, Stonehouse and Jerling38–Reference Tapsell, Lonergan and Batterham44) had a parallel study design, while seven(Reference Holscher, Guetterman and Swanson22,Reference Bamberger, Rossmeier and Lechner45–Reference Wu, Piotrowski and Rau50) had a cross-over study design. In addition, one study(Reference Njike, Ayettey and Petraro17) included features from both a parallel and cross-over design, where the participants were randomised to a parallel group (either energy adjusted or ad libitum diet), and each group was intervened with a walnut-included diet period and a walnut-excluded diet period. The duration of the included studies ranges from 4 d(Reference Brennan, Sweeney and Liu46) to 1 year(Reference Tapsell, Batterham and Teuss39,Reference Rock, Flatt and Pakiz43,Reference Tapsell, Lonergan and Batterham44) . Studies were conducted in Germany(Reference Bamberger, Rossmeier and Lechner45,Reference Wu, Piotrowski and Rau50) , the USA(Reference Njike, Ayettey and Petraro17,Reference Holscher, Guetterman and Swanson22,Reference Rock, Flatt and Pakiz43,Reference Brennan, Sweeney and Liu46,Reference Katz, Davidhi and Ma48,Reference Ma, Njike and Millet49) , Spain(Reference Damasceno, Pérez-Heras and Serra47), Austria(Reference Müllner, Plasser and Brath28), South Africa(Reference Mukuddem-Petersen, Stonehouse and Jerling38,Reference Mukuddem-Petersen42) , Australia(Reference Tapsell, Batterham and Teuss39,Reference Tapsell, Gillen and Patch40,Reference Tapsell, Lonergan and Batterham44) , China(Reference Wu, Pan and Yu41) and Iran(Reference Zibaeenezhad, Aghasadeghi and Hakimi32). Studies included participants who were healthy (inclusive of overweight participants)(Reference Holscher, Guetterman and Swanson22,Reference Bamberger, Rossmeier and Lechner45,Reference Wu, Piotrowski and Rau50) , had the metabolic syndrome or other risk factors for chronic disease(Reference Njike, Ayettey and Petraro17,Reference Mukuddem-Petersen, Stonehouse and Jerling38,Reference Wu, Pan and Yu41–Reference Rock, Flatt and Pakiz43,Reference Brennan, Sweeney and Liu46–Reference Katz, Davidhi and Ma48) , had T2DM(Reference Müllner, Plasser and Brath28,Reference Zibaeenezhad, Aghasadeghi and Hakimi32,Reference Tapsell, Batterham and Teuss39,Reference Tapsell, Gillen and Patch40,Reference Ma, Njike and Millet49) or included participants with a mixture of these factors(Reference Tapsell, Lonergan and Batterham44).
Table 1. Characteristics of included randomised controlled trials examining the effect of walnut consumption on blood glucose measures

F, female; FBGL, fasting blood glucose levels; HC, hypercholesterolaemia; HOMA-IR, homeostatic model assessment of insulin resistance; M, male; MetS, metabolic syndrome; O, walnut oil; OAD, oral antidiabetic medication; P, parallel; T2DM, type 2 diabetes mellitus; W, whole walnut; X, cross-over.
* In intervention group.
† Breakdown by sex for analysed participants not available.
‡ Mean (standard error).
§ Mean ± standard deviation.
‖ Study included other intervention group which was not relevant to this review, therefore this group was not included in this analysis.
¶ Gram weight for dose sub-analysis based on mid-point of range of doses used.
** Unit reported in study, converted to consistent unit for analysis.
†† Body weight (kg) is reported when BMI was not available.
‡‡ Participants were randomised to one of two parallel groups (ad libitum or energy adjusted). Within each group participants completed a ‘walnut included’ and ‘walnut excluded’ period in a cross-over design.
§§ Characteristics reported for participants who met inclusion criteria.
‖‖ HbA1c.
¶¶ Treated as comparison group for this analysis.
*** Median (interquartile range).
††† Characteristics reported for randomised participants.
Consumption of walnuts
Walnuts were consumed as whole nuts in fourteen of the included studies(Reference Njike, Ayettey and Petraro17,Reference Holscher, Guetterman and Swanson22,Reference Mukuddem-Petersen, Stonehouse and Jerling38–Reference Wu, Piotrowski and Rau50) and as an oil in two of the studies(Reference Müllner, Plasser and Brath28,Reference Zibaeenezhad, Aghasadeghi and Hakimi32) . The dose of whole walnuts consumed by participants ranged from 30 g (1·06 oz)(Reference Tapsell, Batterham and Teuss39–Reference Wu, Pan and Yu41,Reference Tapsell, Lonergan and Batterham44) to 56 g (1·98 oz) per d(Reference Katz, Davidhi and Ma48,Reference Ma, Njike and Millet49) . In three studies, walnuts were consumed to provide a prescribed proportion of dietary energy (ranging from 18 to 22 % of total energy)(Reference Mukuddem-Petersen, Stonehouse and Jerling38,Reference Mukuddem-Petersen42,Reference Rock, Flatt and Pakiz43,Reference Damasceno, Pérez-Heras and Serra47) , meaning the dose of walnuts differed between the participants. The energy value of the walnuts was accounted for in thirteen studies(Reference Holscher, Guetterman and Swanson22,Reference Mukuddem-Petersen, Stonehouse and Jerling38–Reference Wu, Piotrowski and Rau50) , either by modelling the energy of the walnuts into the dietary prescription, or by encouraging the participants to substitute walnuts for other food in their diet. One study(Reference Njike, Ayettey and Petraro17) included two different intervention groups, with one group accounting for the added energy from the walnuts, whereas another group added the walnuts in addition to their regular diet. The background diets used in the studies included dietary advice based on healthy eating guidelines (e.g. the Australian Guide to Healthy Eating), as well as habitual diets (with the addition of walnuts for the intervention groups). Control groups typically followed the same background diet as the intervention group, with the exception of the added walnuts, although some studies included a comparison food in their control group (e.g. olive oil(Reference Damasceno, Pérez-Heras and Serra47)).
Risk of bias assessment
The risk of bias assessments is shown in Fig. 2 and online Supplementary Data 4 and 5. Studies were determined to have either ‘some concerns’ regarding the risk of bias, or be at ‘high risk’ of bias, with no studies found to be at ‘low risk’ of bias.

Fig. 2. Risk of bias assessment as a proportion of total studies. ![]() , Low risk;
, Low risk; ![]() , some concerns;
, some concerns; ![]() , high risk.
, high risk.
Effect of nut consumption on study outcomes
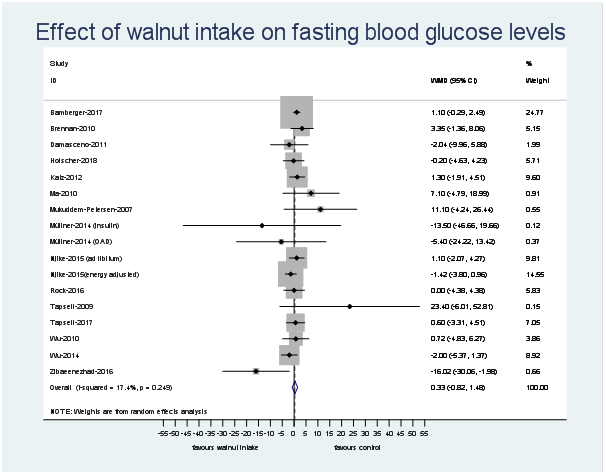
The number of effect sizes and studies, as well as the results of each meta-analysis, is shown in Table 2 and Figs. 3–6. Summary data for each study are available in online Supplementary Data 6. Walnut consumption did not result in significant differences in the fasting blood glucose, HbA1c, fasting insulin or HOMA-IR (Table 2 and Figs. 3–6). Similar results were found when conducting sensitivity analyses using Hartung–Knapp–Sidik–Jonkman adjustment(Reference IntHout, Ioannidis and Borm26) (online Supplementary Data 7), and when using correlation coefficients of 0·25, 0·5 and 0·75 for cross-over studies (online Supplementary Data 8).
Table 2. Changes in outcomes following walnut consumption, compared with control
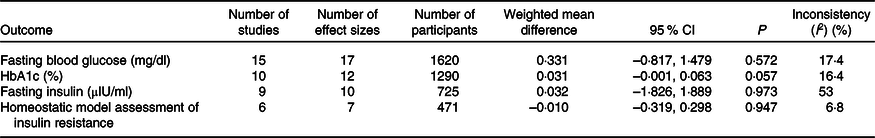

Fig. 3. Difference in fasting blood glucose (mg/dl) between walnut consumption and control. Diamonds indicate weighted mean differences (WMD) with 95 % confidence intervals. Weights are from random effects analysis. OAD, oral antidiabetic medication.

Fig. 4. Difference in HbA1c (%) between walnut consumption and control. Diamonds indicate weighted mean differences (WMD) with 95 % confidence intervals. Weights are from random effects analysis. OAD, oral antidiabetic medication.
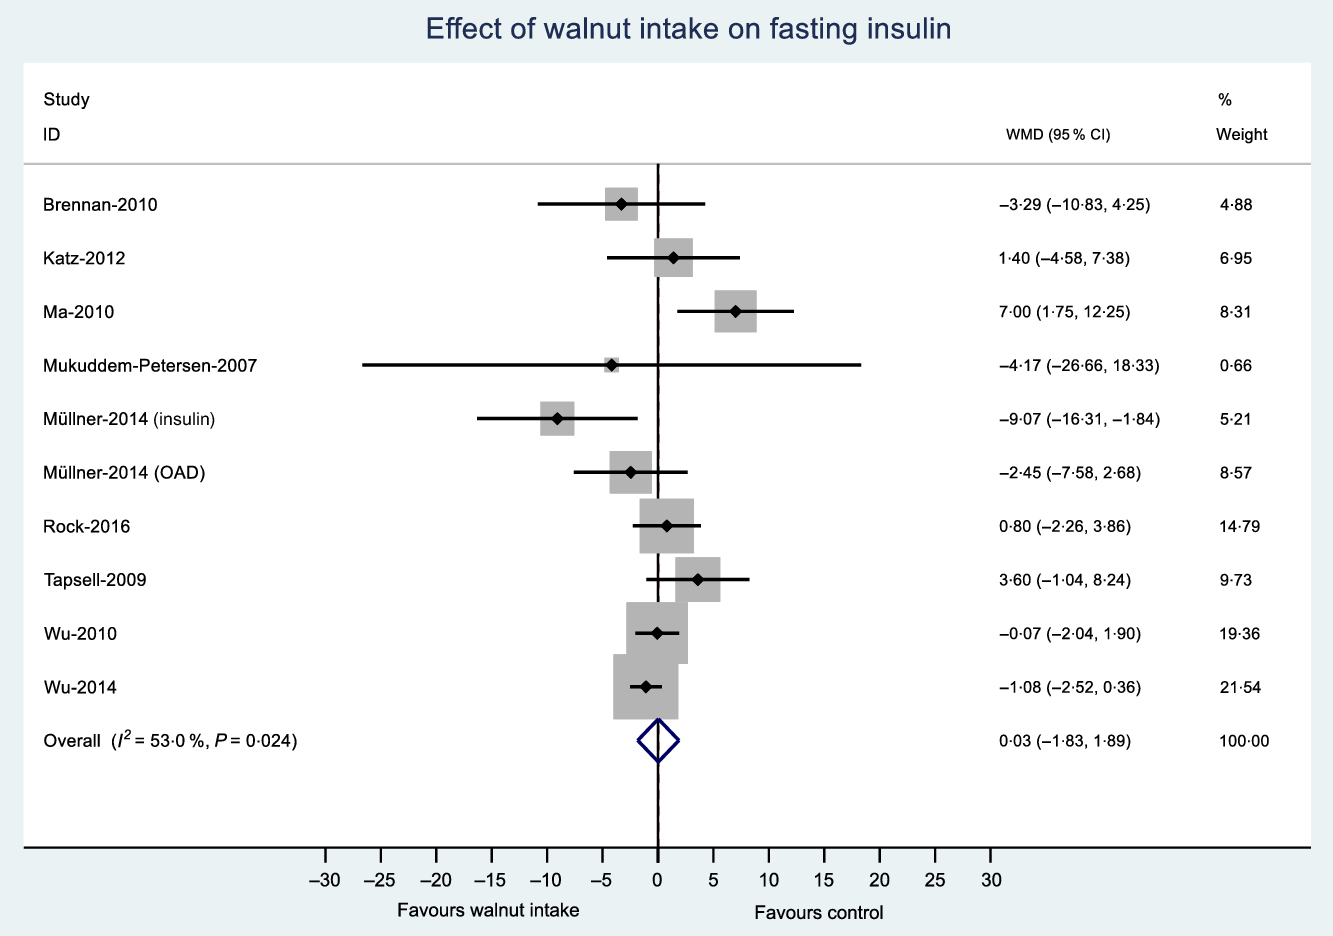
Fig. 5. Difference in fasting insulin (μIU/ml) between walnut consumption and control. Diamonds indicate weighted mean differences (WMD) with 95 % confidence intervals. Weights are from random effects analysis. OAD, oral antidiabetic medication.
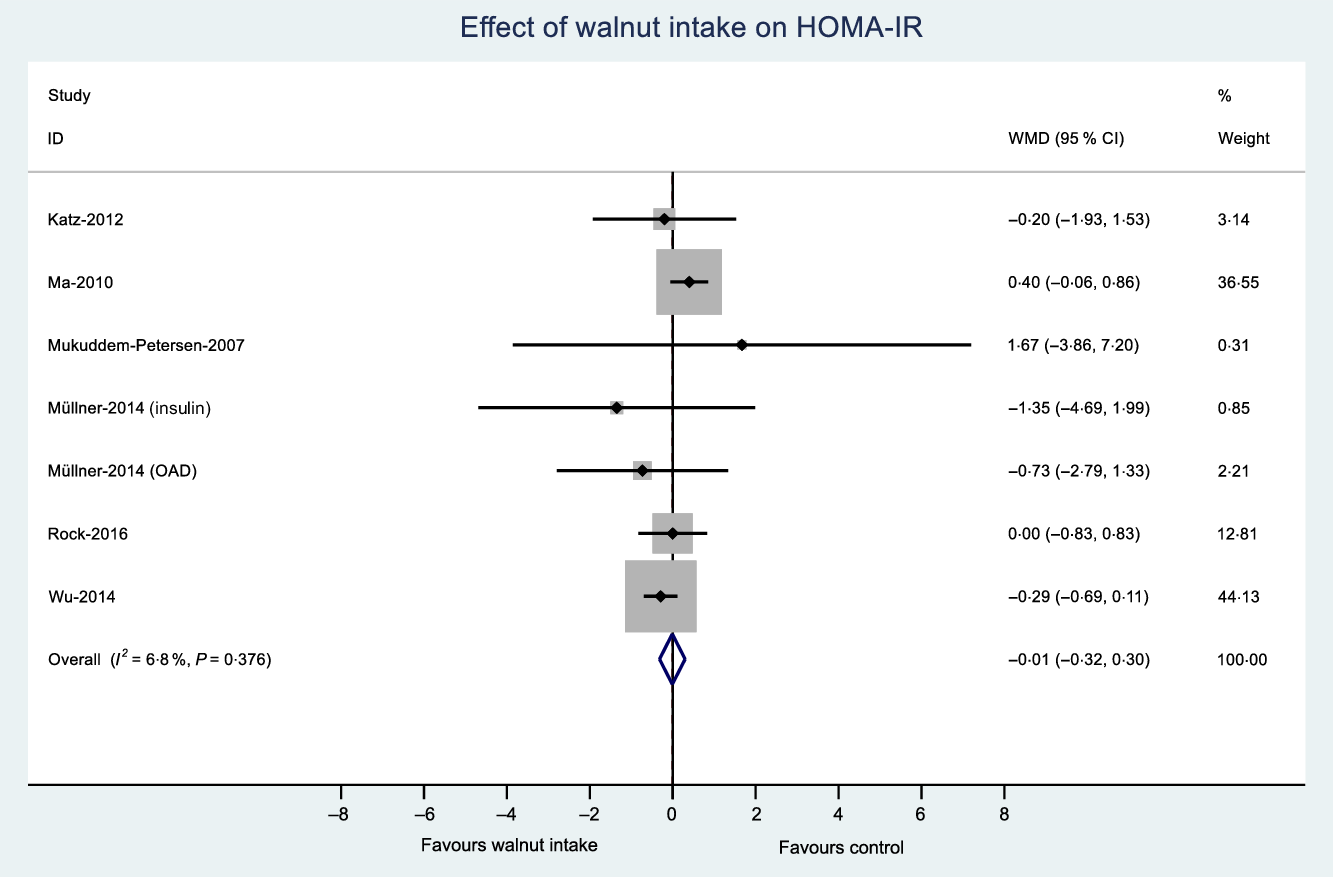
Fig. 6. Difference in homeostatic model assessment of insulin resistance (HOMA-IR) between walnut consumption and control. Diamonds indicate weighted mean differences (WMD) with 95 % confidence intervals. Weights are from random effects analysis. OAD, oral antidiabetic medication.
The results of sensitivity analyses indicated that pooling separate intervention groups within the same study did not substantially the magnitude of the pooled change effect, nor did removing each individual study, or restricting analysis to studies exploring whole walnuts only (online Supplementary Data 9, 10 and 11, respectively). Sub-group analyses and meta-regression were conducted where sample size permitted (fasting blood glucose, HbA1c and fasting insulin). Overall, the sub-group analyses indicated that a similar magnitude of effect was found across the different sub-groups (online Supplementary Data 12). Variation in the magnitude of effect was observed for the risk of bias (some concerns v. high) and walnut dose (<50 v. ≥50 g/d) for insulin; however, these results should be interpreted with caution due to the small number of studies included in the sub-groups. Similar results were observed for the meta-regression, which found no significant relationship between the outcomes of interest and the walnut dose, treated as a continuous variable (fasting blood glucose: P = 0·953; HbA1c: P = 0·576; fasting insulin: P = 0·711) or study duration, also treated as a continuous variable (fasting blood glucose: P = 0·663; HbA1c: P = 0·300; fasting insulin: P = 0·375).
Small study effects
Contour funnel plots were generated for outcomes with ten or more effect sizes (fasting blood glucose, HbA1c and fasting insulin) (online Supplementary Data 13). Visual inspection of funnel plots and the results of Egger’s test did not indicate funnel plot asymmetry.
The quality of the body of evidence
The quality of the body of evidence was determined using GRADE(Reference Guyatt, Oxman and Vist37) (online Supplementary Data 14). The quality of the body of evidence was ‘moderate’ for fasting blood glucose, HbA1c and HOMA-IR, after being downgraded due to risk of bias. The quality of the body of evidence for fasting insulin was ‘low’, as a result of being downgraded for both risk of bias and inconsistency.
Discussion
This systematic review and meta-analysis pooled the evidence base from randomised controlled trials examining the impact of walnut consumption on markers of blood glucose control (fasting glucose, HbA1c, fasting insulin and HOMA-IR). When compared with control groups without walnuts, no evidence of a significant effect of walnut consumption on the markers of blood glucose control was observed. These results did not appear to be affected by sensitivity analyses, suggesting the findings were robust across different scenarios for study inclusion and analysis(Reference Higgins and Green18).
The findings are consistent with research on nuts generally. Although there is a strong body of evidence linking habitual consumption of nuts with reduced risk of CVD(Reference Luo, Zhang and Ding6–Reference Zhou, Yu and He8,Reference Aune, Keum and Giovannucci51) , and a recent report of reduced risk of CVD associated with nut intake amongst people with T2DM(Reference Liu, Guasch-Ferré and Hu10), evidence is less consistent for the effect of nut consumption on incident T2DM and markers of blood glucose control. This may be due to the relative effects of foods and diets on progression to these two disease states, as well as the study designs aimed at exposing any relationships. Foods deliver bioactive compounds which have varying influences on disease mechanisms, and the combination of foods (i.e. diet) determines the set of nutrients which deliver a form of polypharmacy or food synergy(Reference Jacobs, Gross and Tapsell52). Although plant-based diets are by nature high carbohydrate, nuts are largely comprised of fat and protein. The component effects of nuts on CVD have been described(Reference Ros53), one of which is dietary fat modification which has resultant impacts on blood cholesterol levels, a major risk factor for CVD(Reference Sacks, Lichtenstein and Wu54). For walnuts specifically, a previous systematic review found improvements in total and LDL-cholesterol levels with consumption(Reference Banel and Hu55). A further prospective study has highlighted the specific areas of heart disease in which nut consumption may be having its impact(Reference Larsson, Drca and Björck56). On the other hand, although fatty acids have been implicated in insulin sensitivity(Reference Vessby, Uusitupa and Hermansen34), glycaemic control is more immediately influenced by carbohydrate in the diet, so any effect of nuts is likely to be seen as part of a preventive dietary pattern, as outlined below.
Importantly, study designs vary in terms of the extent to which the total dietary pattern is controlled, and this may influence the ability to expose the influence of a particular food on health outcomes(Reference Tapsell57). Where observational studies (with greater variation in dietary intake) form the basis of a systematic review, no association between the consumption of nuts and risk of T2DM(Reference Luo, Zhang and Ding6,Reference Zhou, Yu and He8) has been found, but when intervention studies are the focus, conflicting results emerge(Reference Afshin, Micha and Khatibzadeh7,Reference Wu, Wang and Zhu11) . From a methodological perspective, these inconsistencies may reflect differences in the eligibility criteria between reviews, resulting in differences in the number and type of studies included. In view of the above, it is interesting to note that only one systematic review(Reference Afshin, Micha and Khatibzadeh7) included an analysis from the Prevención con Dieta Mediterránea (PREDIMED) trial(Reference Estruch, Ros and Salas-Salvadó58) (which showed a favourable effect of a Mediterranean diet inclusive of nuts or olive oil on incidence of T2DM(Reference Salas-Salvadó, Bulló and Babio59)). Importantly, the background diets in the PREDIMED study were controlled, and this may have enabled relationships to be better exposed(Reference Tapsell57). Nevertheless, conflicting findings are also reported by systematic reviews of trials examining the impact of nut consumption on markers of blood glucose control, both in individuals with T2DM(Reference Viguiliouk, Kendall and Blanco Mejia12), and the broader adult population(Reference Tindall, Johnston and Kris-Etherton13). Our findings are consistent with the latter review(Reference Tindall, Johnston and Kris-Etherton13) where it was limited to analyses specifically examining the impact of walnuts. We build on these findings by including the most recent studies, considering the broader at-risk population, addressing all available durations of study(Reference Holscher, Guetterman and Swanson22) and using the most up-to-date risk of bias tool(Reference Sterne, Savović and Higgins60).
The relative impact of walnuts within a preventive dietary pattern is another way to consider the food–disease relationship. As walnuts are differentiated from other nuts by their high PUFA acid content, a desirable impact on cholesterol levels in a low-fat diet would be expected. However, like other nuts, they also deliver dietary fibre, phytochemicals and a number of vitamins and minerals including folate, niacin, Mg and K(61). Consumption of tree nuts including walnuts has been found to be associated with favourable overall nutrient intakes(Reference Brown, Tey and Gray62,Reference O’Neil, Keast and Fulgoni63) , and in one study, the provision of walnuts specifically increased the overall quality of the diets chosen by participants(Reference Neale, Tapsell and Martin16,Reference Njike, Ayettey and Petraro17) . Thus, for cuisine reasons, the inclusion of walnuts may help drive better meal and snack choices producing a diet more aligned with preventive health outcomes. This behavioural concept could also be considered in trials of diets related to the prevention of T2DM, where appreciating the significance of single food choices in a total dietary pattern can be overlooked.
From a methodological perspective, the assessment of the risk of bias within individual studies is essential when considering the overall quality of the body of evidence on a topic(Reference Guyatt, Oxman and Vist64). We evaluated the risk of bias using the Cochrane Collaboration Risk of Bias tool 2.0, which was updated in July 2019(Reference Sterne, Page and Elbers23). This updated tool was released to overcome challenges associated with the previous tool(Reference Higgins and Green18), including inconsistent use amongst researchers, difficulties in determining risk of bias in some domains and difficulties in assessing overall risk of bias(Reference Sterne, Savović and Higgins60). Applying the 2.0 tool in our review, we found all studies had either ‘some concerns’ regarding the risk of bias or were at ‘high risk’ of bias. Potential bias particularly emerged in relation to the randomisation process often due to a lack of information on allocation concealment. It also emerged with the lack of pre-registered protocols detailing sufficient information to determine if the results were selectively reported. The literature confirms a general trend for insufficient reporting of allocation concealment in randomised controlled trials(Reference Pildal, Hróbjartsson and Jørgensen65) and problems in identifying selective reporting of outcomes due to the lack of pre-registered study protocols(Reference Savović, Weeks and Sterne66). This may reflect the time in which the studies were conducted relative to demands by the scientific literature for these standards, but this resulted in downgrading the quality of the body of evidence (evaluated using GRADE(Reference Guyatt, Oxman and Vist37)), for all outcomes. These findings suggest a need for more randomised controlled trials with pre-registered study protocols and better reporting of all aspects of study methodology in accordance with current standards.
There were several strengths to this review. It was conducted and reported according to current guidelines(Reference Higgins and Green18,Reference Moher, Liberati and Tetzlaff19) and included an evaluation of results using a number of sensitivity analyses, and examination of the risk of bias using an updated assessment tool. The review was also not limited by study duration, in comparison with previous reviews on this topic(Reference Viguiliouk, Kendall and Blanco Mejia12,Reference Tindall, Johnston and Kris-Etherton13) . There were also potential limitations, such as the small number of studies available for inclusion, limiting the generalisability of results and interpretations of the results of the sub-group analyses and meta-regression (known to be influenced by the number of available observations(Reference Higgins and Green18)). Heterogeneity was also observed in participant characteristics, particularly health status, and in background and control diets. This variation in control diets has been highlighted as a common issue in nutrition meta-analyses, where adding or removing one food from the diet will lead to variation in overall kilojoule, macro- and micronutrient content(Reference Barnard, Willett and Ding67). Furthermore, in order to ensure the effect of walnut consumption could be isolated, studies which tested walnut consumption in combination with other nuts (e.g. mixed nuts) were not eligible for inclusion. While this allowed for the identification of the effect of walnut consumption, separated from that of other nuts, this approach resulted in the exclusion of several studies such the PREDIMED study(Reference Estruch, Ros and Salas-Salvadó58) which used a dose of 30 g mixed nuts, half of which were walnuts, and this may have influenced results. As outlined previously, none of the included studies was found to be at low risk of bias, which may have resulted in either under- or overestimating the true intervention effects. In addition, limitations associated with meta-analysis methodology should be considered. One such limitation is Simpson’s paradox, an ecological effect which can occur in meta-analyses of randomised controlled trials, particularly when there are imbalances in the size of study groups(Reference Rücker and Schumacher68). While this appears unlikely in the present review due to the characteristics of the studies(Reference Altman and Deeks69), it is possible in some circumstances. Finally, while the present review followed current guidelines for conducting meta-analyses, it should be noted that alternatives to random effects meta-analyses(Reference Doi, Barendregt and Khan70–Reference Furuya-Kanamori, Thalib and Barendregt72), funnel plots and Egger’s test(Reference Furuya-Kanamori, Barendregt and Doi73) have been proposed. Further consideration of these advances as a component of research focused on meta-analysis methodologies is recommended.
This systematic review and meta-analysis did not find evidence of an effect of walnut consumption on markers of blood glucose control, namely fasting glucose, HbA1c, fasting insulin and HOMA-IR. These findings suggest that favourable effects of walnut intake on health outcomes such as CVD observed elsewhere may not be mediated via improvements in glucose control. Given the high risk of bias observed in the current evidence base, there is a need for further research on this topic, with a particular emphasis on meeting current standards for registering and reporting on randomised controlled trials to reduce the risk of bias.
Acknowledgements
This study was funded by the California Walnut Commission. The funding body was not involved in the planning, analysis, interpretation or interpretation of results.
E. P. N., V. G., L. C. T. and Y. C. P. designed the study, E. P. N. and V. G. conducted study screening, application of eligibility criteria and data extraction, E. P. N. conducted statistical analyses, E. P. N. drafted the manuscript, L. C. T., Y. C. P. and V. G. provided critical review of the manuscript.
E. P. N., Y. C. P. and L. C. T. have previously received funding or hold current grants from Nuts for Life, the International Nut and Dried Fruit Council, and the California Walnut Commission.
Supplementary material
For supplementary material referred to in this article, please visit https://doi.org/10.1017/S0007114520001415


