


Ensuring food systems deliver improved human and planetary health is among the most pressing global challenges of the 21st century(Reference Willett, Rockström and Loken1). Global food production threatens climate stability and ecosystem resilience and constitutes the single largest driver of environmental degradation and transgression of planetary boundaries(Reference Steffen, Richardson and Rockström2). Furthermore, low-quality diets are responsible for the greatest burden of disease worldwide(Reference Afshin, Sur and Fay3), affecting countries and population groups at all levels of socio-economic development(Reference Swinburn, Kraak and Allender4). To facilitate reversing these detrimental global trends, the EAT–Lancet Commission drew on state-of-the-art nutritional and environmental science as a yardstick for healthy diets from sustainable food systems(Reference Willett, Rockström and Loken1). The report thus defined a ‘flexitarian’ universal reference diet and advocated a Great Food Transformation from business as usual towards win–win environmental sustainability and human health outcomes by the year 2050.
At present, academics and public health professionals are calling for accurate, robust and cross-cutting metrics (and data) to track diet quality and environmental sustainability goals at global, country and regional levels(Reference Lachat, Raneri and Smith5,6) . Accordingly, Knuppel et al.(Reference Knuppel, Papier and Key7) constructed a novel EAT–Lancet diet score (0–14 points) and reported its inverse associations with risks of major health outcomes in a high-income adult population. EAT–Lancet diet score might proxy diet quality, which is one guiding principle of healthy sustainable diet indicators(8,Reference Jones, Hoey and Blesh9) . Furthermore, in contrast to other diet quality scores, for example, Healthy Eating Index-2015(Reference Krebs-Smith, Pannucci and Subar10), Alternate Healthy Eating Index-2010(Reference Chiuve, Fung and Rimm11) and Mediterranean Diet Score(Reference Trichopoulou, Costacou and Bamia12,Reference Estruch, Ros and Salas-Salvadó13) , the EAT–Lancet diet score is designed for global application and therefore aims to make meaningful comparisons across countries, populations and cultures. Moreover, the EAT–Lancet diet score extends previous universal diet quality metrics, based on adherence to WHO global nutrition guidelines, that is, Healthy Diet Indicators(Reference Kanauchi and Kanauchi14,Reference Jankovic, Geelen and Streppel15) , by incorporating environmental health considerations(Reference Willett, Rockström and Loken1) and simplifying food composition data requirements (no cholesterol, n-3 or n-6 PUFA components, etc.) to assess adherence to universal dietary recommendations in the Global South(Reference Micha, Coates and Leclercq16).
This being said, in the EAT–Lancet Commission’s report, nutrient adequacy of the universal reference diet was calculated by assuming consumption (i.e. mean value of the proposed intake ranges) from each of the fourteen recommended dietary components and used food composition data primarily from US sources(Reference Willett, Rockström and Loken1). Surprisingly, however, the healthy reference diet developed by Willett et al.(Reference Willett, Rockström and Loken1) and the subsequent EAT–Lancet diet score by Knuppel et al.(Reference Knuppel, Papier and Key7) set minimum intake values for multiple nutrient-dense food groups at 0 g/d. A priori, the authors of this research acknowledged these intake/scoring ranges as a potential pitfall of the EAT–Lancet diet score in food and nutrition insecure low- and middle-income countries (LMIC). Lawrence et al.(Reference Lawrence, Baker and Pulker17) also argued for further development of the EAT–Lancet universal reference diet narrative, which must specifically clarify the inclusion of zero consumption recommendations (i.e. no minimum intake values) for various nutrient-dense dietary components. In particular, women of reproductive age (WRA) remain more susceptible than men to malnutrition and food insecurity, that is, higher prevalence of non-consumption of dietary components (0 g/d), across every continent(18), but most notably in resource-poor settings(Reference Torheim, Ferguson and Penrose19,Reference Arimond, Wiesmann and Becquey20) . Hence, women’s nutrition and health in LMIC have received increased global political attention and resource allocation during the Millennium and Sustainable Development Goals Era(Reference Baker, Hawkes and Wingrove21–Reference Fox, Davis and Downs23). At present, the United Nations Decade of Action on Nutrition 2016–2025 and the 2030 Agenda for Sustainable Development provide global and national stimuli to monitor and address global malnutrition outcomes, with specific targets for women.
To the authors’ knowledge, no previous study has assessed the association between the EAT–Lancet diet score and the (micro) nutrient adequacy of diets for rural WRA in LMIC. Thus, the EAT–Lancet diet score’s potential application to monitor and evaluate global adherence to healthy and sustainable food consumption in the Anthropocene is currently unknown (i.e. cross-cutting metric for Sustainable Development Goals and Paris Agreement targets). Therefore, the present study used local food composition tables and evaluated EAT–Lancet diet scores(Reference Knuppel, Papier and Key7), without or with (>0 g/d) minimum intake values for nutrient-dense dietary components, as a potential predictor of higher Mean Probability of Micronutrient Adequacy (MPA) of diets in rural WRA from five LMIC across Africa, Asia and Latin America.
Methods
Data sources
Cross-sectional secondary data from five LMIC were used in the present study (online Supplementary Table S1). Dietary intake data of non-pregnant non-lactating WRA (15–49 years) were collected using a quantitative and comparable single multiple-pass 24-h dietary recall method that identified food and drinks to at least the species level(Reference Gibson, Charrondiere and Bell24). Dietary intake data during the wet (lean) season were obtained from rural areas in the Democratic Republic of Congo (n 375(Reference Termote, Bwama Meyi and Dhed’a Djailo25)), Ecuador (n 201(Reference Penafiel, Cevallos-Valdiviezo and Espinel26)), Kenya (n 361(Reference Oduor, Boedecker and Kennedy27)), Sri Lanka (n 20) and Vietnam (n 262). Dietary intake data from the dry (plenty) season were also available from Kenya (n 362(Reference Oduor, Boedecker and Kennedy27)) and Vietnam (n 369). All studies considered agricultural and wild sources of food and drinks, without assessment of dietary supplement intake. All data were collected between July 2009 and April 2015, and samples were representative of the village-level populations. Food composition data for Ca (mg), folate (μg), Fe (mg), vitamin A (μg retinol equivalents), vitamin C (mg) and Zn (mg), available for all five LMIC, were mostly sourced from national food composition tables, to capture the substantial variations in content and density of essential micronutrients between- and within-food species(Reference Lachat, Raneri and Smith5,Reference Lutaladio, Burlingame and Crews28,Reference Burlingame, Mouillé and Charrondière29) . In the event, food composition data were missing and best-matching values were obtained from similar settings, countries, or food and drinks (online Supplementary Table S1).
Ethics
Anonymised individual-level data and protocols are available at https://dataverse.harvard.edu/dataverse/DietarySpeciesRichness. All studies were approved by an ethics committee, except in Sri Lanka where the protocol was exempted from clearance. The present analysis was approved by the Ethics Committee of Ghent University Hospital (NR B670201422403). Our research was reported using the STROBE-nut checklist (online Supplementary Text 1 (Reference Lachat, Hawwash and Ocké30)).
EAT–Lancet diet scores
First, using data from the 24-h dietary recall method (n 1950), we calculated the EAT–Lancet diet score(Reference Knuppel, Papier and Key7) based on fourteen key recommendations in Willett et al.(Reference Willett, Rockström and Loken1) (Table 1). The EAT–Lancet universal reference diet corresponds to the average energy needs (10·5 MJ/d or 2500 kcal/d) of a 30-year-old woman weighing 60 kg and whose physical activity level is between moderate and high (1·7–2·0). The serving ranges for each food group were derived from state-of-the-art scientific evidence with regard to human and planetary health impacts of foods in the Anthropocene(Reference Willett, Rockström and Loken1). As recommended in Knuppel et al.(Reference Knuppel, Papier and Key7), diets were assigned one point for meeting the amount of dietary intake (g/d) and proportion of energy (MJ/d) for whole grains, recommended for each dietary component, resulting in a possible score ranging from 0 to 14 points.
Table 1. Construction of the EAT–Lancet diet score without or with minimum intake values

* Each dietary component contributed 0 or 1 point resulting in a total score ranging from 0 to 14 points.
† Food species consumed per food group are described in Lachat et al.(Reference Lachat, Raneri and Smith5) (online Supplementary Table S5).
‡ Recommendations used for the associations with ischaemic heart disease, stroke, diabetes and all-cause mortality in Knuppel et al.(Reference Knuppel, Papier and Key7) (online Supplementary Table S1).
§ Intake values used for the assessment of nutrient adequacy in Willett et al.(Reference Willett, Rockström and Loken1) (online Supplementary Table S4).
|| Reference diet refers to dry, raw weight. Equivalent dry weights assigned based on the third supplement to McCance & Widdowson’s The Composition of Foods, 4th edition (1988)(Reference Holland, Unwin and Buss31).
¶ Reference diet refers to dry, raw weight. Equivalent dry weights assigned based on the fifth supplement to McCance & Widdowson’s The Composition of Foods, 4th edition (1991)(Reference Holland, Widdowson and Unwin32).
Nevertheless, as previously described, nutrient adequacy of the ‘flexitarian’ universal reference diet was calculated by assuming consumption (mean value of the proposed intake ranges, e.g. 29 g/d of chicken and other poultry; Table 1) from each of the fourteen recommended dietary components(Reference Willett, Rockström and Loken1). However, the healthy reference diet promulgated by Willett et al.(Reference Willett, Rockström and Loken1) set lower bound intake values for multiple nutrient-dense food groups at 0 g/d. A priori, we acknowledged the absence of minimum intake requirements for tubers and starchy staples (dietary component no. 2), dairy foods (no. 5) and protein sources (nos. 6–11), as a potential pitfall of the EAT–Lancet diet score for vulnerable populations in food and nutrition insecure settings. To illustrate, WRA consuming a monotonous diet composed of 436 g/d whole-grain hard red spring wheat (±5·9 MJ/d), 91 g/d added rapeseed oil (±3·4 MJ/d) and 30 g/d added granulated sugar (±0·5 MJ/d) would counterintuitively score 11 points from a maximum of 14.
Therefore, we re-calculated the EAT–Lancet diet score (Table 1) with minimum intake values (i.e. mean value of the proposed intake ranges, as used for the nutrient adequacy calculations in online Supplementary Table S4 of the EAT–Lancet Commission’s report(Reference Willett, Rockström and Loken1)), to avoid assigning zero consumption (0 g/d) of a dietary component as one point.
Mean probability of nutrient adequacy
As a measure of the micronutrient adequacy of diets, we calculated the probability of adequacy (PA) for Ca, folate, Fe, vitamin A, vitamin C and Zn and the MPA for each WRA over a 24-h period using the probability approach(33). We used the estimated average requirements (EAR) and CV from the FAO & WHO(34). For Fe requirements, which are known to be skewed for non-pregnant, non-lactating women, we used the IOM’s reference tables(35), but adjusted for absorption of 10 % on the basis of diet patterns, according to FAO and WHO guidance(34). For Zn, we use the International Zinc Nutrition Consultative Group’s EAR and CV(Reference Brown, Rivera and Bhutta36), assuming low absorption (25 %). The EAR used for each micronutrient are reported in online Supplementary Table S3. MPA was calculated as the mean of the PA of the six individual micronutrients. In parallel to micronutrient PA, the MPA has a possible range of 0–1. In addition, as a measure of the micronutrient density of diets, we calculated energy-adjusted MPA (MPA/total energy intake (MJ/d)) for each WRA.
Statistical analysis
Data management and statistical analysis were conducted in Stata version 15.1(37). A two-sided significance level of P < 0·05 was applied for all analyses. WRA were considered equally representative; therefore, overall summary statistics (mean values and standard deviations; %) were calculated averages for WRA per country and across countries. We compared EAT–Lancet diet scores and MPA between seasons (i.e. Kenya and Vietnam only) using Welch’s independent-samples t test.
To assess the associations between EAT–Lancet diet scores, without or with minimum intake values, and MPA (or energy-adjusted MPA), linear mixed effects models (mixed; random intercept: country; random slope: varying association by country) were fitted, assuming an unstructured covariance matrix.
To examine any differences in EAT–Lancet diet scores, without or with minimum intake values, by season and total energy intake, we tested exploratory interaction terms between EAT–Lancet diet scores and season and total energy intake as a binary variable (i.e. 0 for <10·5 MJ/d and 1 for ≥10·5 MJ/d underpowered for the latter group in Ecuador and Sri Lanka). Furthermore, we repeated the analyses, for EAT–Lancet diet scores with each individual recommendation adjusted for the score (minus itself) to investigate whether one or more dietary recommendations were responsible for our associations(Reference Akbaraly, Sabia and Shipley38). Moreover, EAT–Lancet diet scores were potentially associated with total energy intake (MJ/d)(Reference Willett, Howe and Kushi39). Therefore, to evaluate the micronutrient density of the diet, we tested associations between EAT–Lancet diet scores, without or with minimum intake values, and standardised energy-adjusted MPA (percentage points/MJ; sd).
Results
Sample characteristics
24-h Dietary recall method data were obtained for 1219 (62·5 %) WRA in the wet and 731 WRA in the dry season (mean age 28·5 (sd 7·8) years). The difference between EAT–Lancet diet scores, without or with minimum intake values (mean 6·8 (sd 1·1) points), ranged between 6·0 (sd 1·1) in Ecuador and 7·5 (sd 0·8) in the Kenya. MPA (mean 0·58 (sd 0·22)) ranged between 0·45 (sd 0·18) in Sri Lanka and 0·64 (sd 0·18) in Vietnam (Table 2). Diets were particularly non-adhering to the EAT–Lancet diet score, without minimum intake values, with regard to whole grains (43·2 %), vegetables (28·8 %), fruits (16·5 %), nuts (3·3 %) and added fats (20·9 %) (online Supplementary Table S2). In contrast, diets were non-adhering to the EAT–Lancet diet score, with minimum intake values, for all key dietary components (<50 %), except added sugar (63·6 %) (online Supplementary Table S4). Diets were particularly inadequate for Ca (mean PA 0·12 (sd 0·30)) and folate (mean PA 0·31 (sd 0·43); online Supplementary Table S3). The EAT–Lancet diet score, without minimum intake values, was higher in the wet (lean) season (P = 0·030), whereas the EAT–Lancet diet score, with minimum intake values, was higher in the dry (plenty) season (P = 0·024). MPA was lower (P < 0·001) in the wet (lean) season, and thus dietary variables were not comparable across seasons when only countries with data for both seasons were used (i.e. Kenya and Vietnam; n 1354; Table 2).
Table 2. EAT–Lancet diet scores, without or with minimum intake values, and mean probability of adequacy in women of reproductive age by country and season
(Mean values and standard deviations)
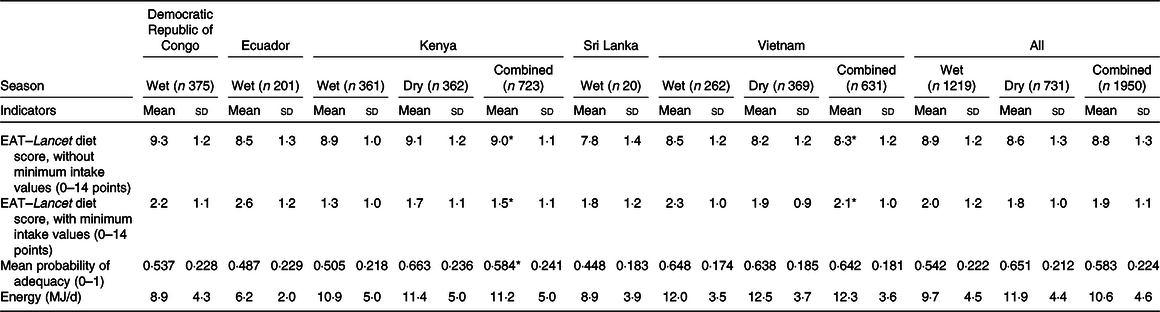
* Two-sided Welch’s independent-samples t test significant by season at the 5 % level.
Associations between EAT–Lancet diet scores and MPA
The EAT–Lancet diet score, without minimum intake values, was consistently inversely associated with MPA across countries (Fig. 1; online Supplementary Fig. S1). Each one-point increase in the EAT–Lancet diet score, without minimum intake values, was associated with a 2·6 (sd 0·7) percentage points decrease in MPA (P < 0·001) (Table 3). The associations were not explained by one single dietary recommendation (non-consumption included in criteria for scoring one point), suggesting a negative cumulative effect of the EAT–Lancet diet score’s dietary components without minimum intake values (online Supplementary Table S6). However, 1923 (98·6 %) WRA achieved the recommendations (including 0 g/d) for dairy foods, 1724 (88·4 %) for eggs, 1773 (90·9 %) for fish, 1761 (90·3 %) for dry beans, lentils and peas, 1948 (99·9 %) and only 64 (3·3 %) for peanuts and tree nuts, suggesting that a subset of the recommendations contributed to the lower MPA associated with better adherence to the EAT–Lancet diet score without minimum intake values. The interaction term between the EAT–Lancet diet score, without minimum intake values, and season was significant in Kenya and Vietnam (P < 0·05). Nevertheless, the direction of the modified association between the EAT–Lancet diet score and MPA remained unchanged. Furthermore, the interaction term between the EAT–Lancet diet score, without minimum intake values, and total energy intake (<10·5 or ≥10·5 MJ/d) was also significant (P = 0·003), although associations between the EAT–Lancet diet score and MPA were non-significant (online Supplementary Table S5).
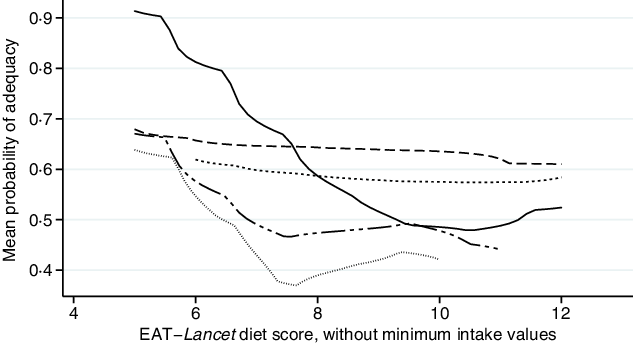
Fig. 1. Associations between mean probability of adequacy and EAT–Lancet diet score, without minimum intake values, in 1950 women of reproductive in five low- and middle-income countries. Kernel-weighted local polynomial smoothing plot. ![]() , Democratic Republic of Congo;
, Democratic Republic of Congo; ![]() , Sri Lanka;
, Sri Lanka; ![]() , Vietnam;
, Vietnam; ![]() , Ecuador;
, Ecuador; ![]() , Kenya.
, Kenya.
Table 3. Associations between EAT–Lancet diet scores, with or without minimum intake values, and mean probability of adequacy in women of reproductive age by country and season
(β Values with their standard errors)
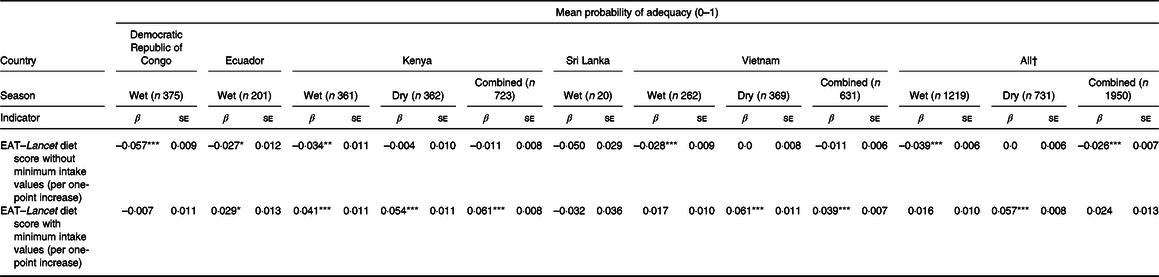
* P < 0·05, ** P < 0·01, *** P < 0·001.
† Mixed effects linear regression model random intercept: country; random slope: association between EAT–Lancet diet score and MPA by country.
In contrast, the EAT–Lancet diet score, with minimum intake values, was positively associated with MPA (Fig. 2; online Supplementary Fig. S2). Each one-point increase in the EAT–Lancet diet score, with minimum intake values, was non-significantly associated with a 2·4 (sd 1·3) percentage points increase in MPA (P = 0·07; Table 3). The associations were not explained by one single dietary recommendation, suggesting a positive cumulative effect (e.g. all vegetables, dairy products, and peanuts and tree nuts) of the EAT–Lancet diet score’s dietary components with minimum intake values (online Supplementary Table S6). The interaction term between the EAT–Lancet diet score, with minimum intake values, and season was significant in Vietnam only (P = 0·003), but did not change the positive associations between the EAT–Lancet diet score, with minimum intake values, and MPA across both seasons. Moreover, the interaction term between the EAT–Lancet diet score, without minimum intake values, and total energy intake (<10·5 or ≥10·5 MJ/d) was significant (P = 0·018), although the positive association between the EAT–Lancet diet score and MPA was significant in the <10·5 MJ/d group only (P = 0·001; online Supplementary Table S5).
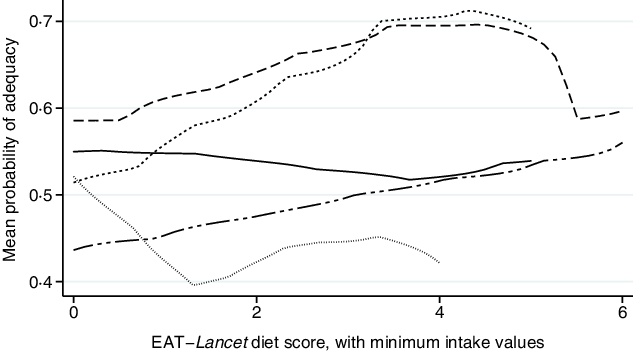
Fig. 2. Associations between mean probability of adequacy and EAT–Lancet diet score, with minimum intake values, in 1950 women of reproductive in five low- and middle-income countries. Kernel-weighted local polynomial smoothing plot. ![]() , Democratic Republic of Congo;
, Democratic Republic of Congo; ![]() , Sri Lanka;
, Sri Lanka; ![]() , Vietnam;
, Vietnam; ![]() , Ecuador;
, Ecuador; ![]() , Kenya.
, Kenya.
Further analysis indicated consistent positive associations between EAT–Lancet diet scores, without or with (except the Democratic Republic of Congo) minimum intake values, and standardised energy-adjusted MPA across countries (Figs. 3 and 4). Each one-point increase in the EAT–Lancet diet score, without minimum intake values, was associated with an increase of 0·20 (sd 0·03) in energy-adjusted MPA (P < 0·001; online Supplementary Table S7 and Fig. S3). In parallel, a one-point increase in the EAT–Lancet diet score, with minimum intake values, was associated with an increase of 0·16 (sd 0·06) in energy-adjusted MPA (P = 0·011; online Supplementary Fig. S4).
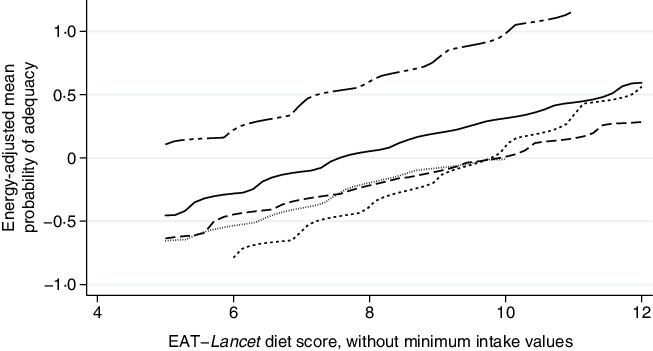
Fig. 3. Associations between standardised energy-adjusted mean probability of adequacy and EAT–Lancet diet score, without minimum intake values, in 1950 women of reproductive in five low- and middle-income countries. Kernel-weighted local polynomial smoothing plot. ![]() , Democratic Republic of Congo;
, Democratic Republic of Congo; ![]() , Sri Lanka;
, Sri Lanka; ![]() , Vietnam;
, Vietnam; ![]() , Ecuador;
, Ecuador; ![]() , Kenya.
, Kenya.
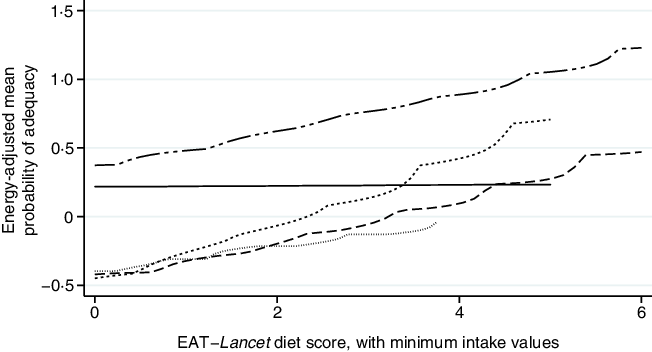
Fig. 4. Associations between standardised energy-adjusted mean probability of adequacy and EAT–Lancet diet score, with minimum intake values, in 1950 women of reproductive in five low- and middle-income countries. Kernel-weighted local polynomial smoothing plot. ![]() , Democratic Republic of Congo;
, Democratic Republic of Congo; ![]() , Sri Lanka;
, Sri Lanka; ![]() , Vietnam;
, Vietnam; ![]() , Ecuador;
, Ecuador; ![]() , Kenya.
, Kenya.
Discussion
The EAT–Lancet diet score, without minimum intake values for all nutrient-dense dietary components, was consistently negatively associated with MPA in all five countries. In contrast, the EAT–Lancet diet score, with minimum intake values, was positively associated with MPA in all countries, except in the underpowered sample from Sri Lanka (which only included twenty WRA). Therefore, our findings advocate minimum intake values (>0 g/d), to avoid the EAT–Lancet diet score predicting non-consumption of nutrient-dense dietary components and subsequent lower micronutrient adequacy of diets in resource-poor settings. In parallel to our findings, Willett et al.(Reference Willett, Rockström and Loken1) also noted that the universal reference diet’s dietary recommendations might need to be adapted/flexible to the local culture, geographic, social or economic circumstances, as a strict global adoption of the EAT–Lancet diet might not be an optimal (ethical or equitable) choice for all(Reference Lawrence, Baker and Pulker17,Reference Tuomisto40,Reference Milner and Green41) .
Our results are in contrast to research by Knuppel et al.(Reference Knuppel, Papier and Key7), which indicated that a similar EAT–Lancet diet score, without minimum intake values for multiple nutrient-dense food groups, was associated with lower risks of major health outcomes, such as ischaemic heart disease and diabetes (but was not associated with stroke or mortality), in adults of the EPIC-Oxford cohort. However, we argue that analyses of the EAT–Lancet diet score, without minimum intake values, and nutritional outcomes in high-income countries characterised by overconsumption(Reference Afshin, Sur and Fay3), are unlikely to suffer from the same limitations as in LMIC, that is, capturing non-consumption of nutrient-dense food groups (0 g/d) and subsequent lower micronutrient adequacy of diets in populations crippled by the triple burden of malnutrition(42). To illustrate, our findings indicate that diets were micronutrient inadequate (MPA < 0·60) in the study population of rural WRA in the Democratic Republic of Congo, Ecuador, Kenya and Sri Lanka (excluding Vietnam). Furthermore, in parallel to previous research on country-level adherence to dietary guidelines(Reference Biesbroek, Verschuren and Boer43,Reference Batis, Aburto and Sánchez-Pimienta44) , the proportion of WRA meeting the fourteen key dietary recommendations, with minimum intake values, was low. Therefore, future nutrition and environmental research might apply the EAT–Lancet diet scores, with minimum intake values, in prospective cohort studies in LMIC (e.g. Prospective Urban Rural Epidemiology study(Reference Dehghan, Mente and Zhang45)) and model better adherence to multiple environmental impacts at national or regional scales(Reference Clark, Springmann and Hill46). This research shows that the EAT–Lancet diet score, with minimum intake values, might potentially serve as a cross-cutting sustainable healthy diet indicator, to facilitate monitoring and evaluation of women’s dietary (and environmental, not assessed in this study) risk factors, rather than detrimental outcomes alone (e.g. prevalence of anaemia in WRA).
Furthermore, EAT–Lancet diet scores, without minimum intake values, and MPA were significantly different between wet (lean) and dry (plenty) seasons in Kenya and Vietnam. Our results might be attributable to the seasonal changes in local production systems, increased food availability and micronutrient density of food species associated with the plenty season(Reference Tuomisto40). These findings are distinct from Lachat et al.(Reference Lachat, Raneri and Smith5), although expected considering previous systematic reviews reported considerable intra-annual variation in nutritional quality of adult’s diets in highly biodiverse areas(Reference Penafiel, Lachat and Espinel47,Reference Phalkey, Aranda-Jan and Marx48) . Indeed, we report higher intake (g/d) of beef, lamb, pork, chicken, other poultry and eggs in the dry season (results available on request). Moreover, the EAT–Lancet diet score, with minimum intake values, was more positively associated with MPA in the dry season, suggesting that it might be easier to increase micronutrient adequacy of diets in the plenty season. Our findings are potentially attributed to the observed higher prevalence of WRA reaching the EAT–Lancet diet score’s recommendations, with minimum intake values, for vegetables, dairy foods and fish in the dry season.
Advocating global adherence to a ‘flexitarian’ EAT–Lancet diet (with lower bound intake values for animal-source food groups set at 0 g/d) has generated mixed responses and criticism within the global research and development community(Reference Lawrence, Baker and Pulker17). The state-of-the-art scientific basis for a predominately plant-based (or low animal-source food) universal reference diet(Reference Willett, Rockström and Loken1), focused on promoting a diversity of whole grains, vegetables, fruits, legumes, nuts and unsaturated oils, low-to-moderate amounts of seafood and poultry, and no or low quantities of red meat, processed meat, added sugar, refined grains and starchy vegetables, is controversial(Reference Akbaraly, Sabia and Shipley38,Reference Dehghan, Mente and Zhang45,Reference Johnston, Zeraatkar and Han49–Reference Guasch-Ferré, Satija and Blondin51) , socially polarised(Reference Lawrence, Baker and Pulker17,Reference Garcia, Galaz and Daume52) and has been questioned for vulnerable population groups in LMIC(Reference Milner and Green41,Reference Torjesen53–Reference Adesogan, Havelaar and McKune55) . To illustrate, increased intakes of nutrient-dense foods, such as animal-source foods, are known to provide vital nutritional benefits, including protein and essential micronutrients (e.g. Fe, Zn and B-vitamins) to WRA in LMIC(Reference Enahoro, Lannerstad and Pfeifer56–Reference Martin-Prevel, Arimond and Allemand61). To add to the intricacies/wicked problem of healthy sustainable diets, Hirvonen et al.(Reference Hirvonen, Bai and Headey62) reported that adherence to the EAT–Lancet Commission’s universal reference diet, with minimum intake values (MJ/d), requires relatively larger quantities of higher-cost food groups, such as dairy products, eggs, meat, fish, fruits and vegetables than near-subsistence diets (or alternative diets with minimally adequate levels of essential nutrients), rendering the diet unaffordable for approximately 1·5 billion people, mostly in sub-Saharan Africa and South Asia. Therefore, in order to address global diet-related inequities(Reference Perez-Escamilla, Bermudez and Buccini63) and improve adherence to sustainable healthy diets(Reference Milner and Green41,Reference Hirvonen, Bai and Headey62) , we argue that more dedicated and comprehensive multi-sectoral nutrition-sensitive and nutrition-specific policies and programmes are required.
Although there is a need to develop simple a priori global indicators for healthy sustainable diets, to ensure policymakers and consumers understand how such diets improve individual and population health and conserve natural resources(Reference Johnston, Fanzo and Cogill64), using crude scores, for example, the EAT–Lancet diet score has inherent statistical limitations, including subjective selection of components and cut-offs, single dietary components considered as independent (i.e. correlated structure or substitution effects (e.g. vegetal and animal protein sources) not considered) and assumptions of linear additive effects(Reference Schulze, Martínez-González and Fung65). Moreover, given the complexity of the magnitudes of impact dietary components has on human and planetary health(Reference Springmann, Wiebe and Mason-D’Croz66), sustainable healthy diet indices might be more informative when composed of a suite of nutritional and environmental metrics(Reference Clark, Springmann and Hill46,Reference Chaudhary, Gustafson and Mathys67,Reference Poore and Nemecek68) .
As was the case with previous studies(Reference Lachat, Raneri and Smith5,Reference Penafiel, Cevallos-Valdiviezo and Espinel26,Reference Oduor, Boedecker and Kennedy27,Reference Boedecker, Odhiambo Odour and Lachat69) , the first limitation of the present research was a lack of nutrient composition data of certain foods consumed (limiting analysis to six micronutrients available across all five countries). The composition of various indigenous, wild, neglected and underutilised food species was often not available and was substituted with nutrient values from similar foods. Second, we were unable to use a cut-off for fibre intake to accommodate for the emphasis of the universal reference diet on whole grains. Third, we used only a single multiple-pass 24-h dietary recall method per WRA. Although this method is appropriate to estimate population average dietary intakes, it does not allow accounting for intra-person variability(Reference Beaton70) and thus estimation of usual intake(33). Fourth, analyses of EAT–Lancet diet scores pertain only to a reference WRA, and recommendations differ among women depending on their height, weight, physical activity, pregnancy and lactation status. Further assessments of the applicability of EAT–Lancet diet scores in diets with a higher contribution of foods obtained from (peri-) urban markets or processed foods and diverse population groups are warranted.
Although the EAT–Lancet Commission’s dietary recommendations provide a valuable roadmap for healthy sustainable diets, which can be used to tailor (inter)national food-based dietary guidelines, the EAT–Lancet diet score requires minimum intake values, for all nutrient-dense food groups, to avoid positively scoring non-consumption (i.e. 0 g/d) of dietary components and subsequently predicting lower micronutrient adequacy of diets in rural WRA from LMIC across Africa, Asia and Latin America.
Acknowledgements
Celine Termote and Patrick Van Damme contributed data from the Democratic Republic of Congo; Daniela Penafiel and Patrick Van Damme contributed data from Ecuador; Francis Oduor Odhiambo and Celine Termote contributed data from Kenya; Kaat Verzelen, Danny Hunter and Disna Ratnasekera contributed data from Sri Lanka; Jessica E. Raneri, Hoang The Ky and Gina Kennedy contributed data from Vietnam.
The following sources funded studies from which the data were used; Democratic Republic of Congo: Flemish Interuniversity Council, Leopold III fund for Nature Exploration and Conservation, and Stichting Roeping; Ecuador: Flemish Interuniversity Council; Kenya and Vietnam: Humidtropics and Agriculture for Nutrition and Health CGIAR Research Group; Sri Lanka: Global Environment Facility, United Nations Environmental Programme, Food and Agriculture Organisation of the United Nations, and Bioversity International. The funders of the studies had no role in study design, data collection, analysis, interpretation or writing of the manuscript. The corresponding author has full access to all of the data in the study and had the final responsibility for deciding to submit the manuscript for publication.
The authors’ contributions were as follows. G. T. H.-C., A. A. A. and C. K. L. designed the research; G. T. H.-C. developed the first draft and revised the manuscript; G. T. H.-C. and A. A. A. analysed the data; P. W. K., A. D. J. and C. K. L. advised on statistical analyses. B. P. K., L. C. T., K. W. V. and A. D. J. critically reviewed and revised the manuscript. All authors read and approved the final manuscript.
The authors declare that there are no conflicts of interest.
Supplementary material
For supplementary material referred to in this article, please visit https://doi.org/10.1017/S0007114520003864


