


Bile acids (BA) are amphipathic cholesterol derivatives, which are synthesised in the liver, stored in the gall bladder, secreted into the duodenum when food was ingested, reabsorbed in the terminal ileum and transported back to the liver(Reference Chiang1). Besides the well-known role as detergents for the emulsification and absorption of dietary lipids(Reference Hofmann2), BA have recently emerged as signalling molecules that regulate epithelial homoeostasis, transportation and barrier function(Reference Keating and Keely3). Particularly, BA exhibit various biological functions in intestinal cells. Chenodeoxycholic acid (CDCA), the primary BA in many species, has been shown to stimulate gut growth in total parenteral nutrition-fed piglets(Reference Jain, Stoll and Burrin4). However, secondary BA, more hydrophobic metabolites of primary BA, are well known for their cytotoxicity(Reference Stenman, Holma and Eggert5). Deoxycholic acid (DCA) could decrease the barrier function of the jejunum and colon in mice(Reference Stenman, Holma and Eggert5). In an in vitro study, lithocholic acid (LCA) has been shown to induce the apoptosis of HT-29 and HCT-116 cells(Reference Katona, Anant and Covey6).
Intestinal cells are exposed to high or low concentrations of BA since the composition varies depending largely on the intestinal microbiota(Reference Hofmann2). Most primary BA synthesised from cholesterol in the liver are then conjugated with glycine or taurine(Reference Chiang1). In the distal intestine, deconjugation of BA is carried out by bacteria with bile salt hydrolysis activity and bacteria with 7α dehydroxylation activity perform the biotransformation of cholic acid (CA) and CDCA to DCA and LCA, respectively(Reference Ridlon, Kang and Hylemon7,Reference Ridlon, Harris and Bhowmik8) . LCA can also be converted from UDCA under the action of bacteria with 7β dehydroxylation activity(Reference Ridlon, Harris and Bhowmik8). Bile salt hydrolase resides in major intestinal bacteria including Clostridium, Bacteroides, Lactobacillus and Bifidobacterium (Reference Ridlon, Kang and Hylemon7,Reference Pereira-Fantini, Lapthorne and Joyce9,Reference Wahlström, Sayin and Marschall10) . There is evidence that 7α dehydroxylation is the most important BA transformation, and this action is carried out by Bacteroides, Clostridium, Eubacterium, Lactobacillus and Escherichia (Reference Pereira-Fantini, Lapthorne and Joyce9,Reference Studer, Desharnais and Beutler11,Reference Jia, Xie and Jia12) . Therefore, alteration of gut microbiota may lead to changes in BA composition in the intestine and impact BA signalling and intestinal function.
Growing evidence indicates that probiotics have various beneficial effects such as relief of inflammatory bowel diseases(Reference Cain and Karpa13,Reference Hegazy and El-Bedewy14) and improving immunity(Reference Liu, Hou and Wang15). Lactobacillus plantarum, a commensal bacterium present in humans, has been proven to increase gut microbiota diversity and promote intestinal barrier function(Reference Linninge, Xu and Bahl16–Reference Wang, Ji and Wang18). Notably, L. plantarum has been reported to inhibit Clostridium, a critical bacterium participating BA biotransformation(Reference Monteiro, do Carmo and Melo19). In a recent in vitro study, L. plantarum has been shown to play a role in BA metabolism(Reference Prete, Long and Gallardo20). As elucidated above, variation of BA composition may lead to altered effects on intestinal cells. There is possibility that the beneficial effects of probiotics on gut health are related to changes of BA composition modulated by intestinal microbiota. However, limited data are available targeting whether manipulation of intestinal microbiota through probiotic supplementation impacts BA composition in intestinal tissues. Therefore, the first hypothesis was that oral administration of probiotics could decrease the production of secondary BA through regulating gut microbiota in association with BA metabolism in the intestine of piglets. In addition, young pigs are undeveloped in immune systems and confronted with various pathogenic bacteria, thus frequently suffering from gut disorders especially during weaning transition period(Reference Wijtten, van der Meulen and Verstegen21). As secondary BA have been shown to disrupt gut barrier function, figuring out the role of secondary BA in exacerbating intestinal cell dysfunction induced by pathogenic bacteria may further prove the importance of diminishing secondary BA in intestinal cells by using probiotics. Therefore, the second hypothesis was that the secondary BA might synergise with bacteria-derived endotoxins to disturb the enterocyte physiology.
Materials and methods
Study design, animals and sampling
Use of animals in the current study was approved by the animal care and use committee of Sichuan Agricultural University. Based on sex and body weight, a total of twenty-eight weaning piglets (Duroc × Landrace × Yorkshire, half male, half female) at 28 d of age were randomly allocated into control (CON) group (7·06 (sem 0·27) kg, n 14) and probiotic (PRO) group (7·14 (sem 0·25) kg, n 14) and housed individually in metal cages. Piglets in both groups had free access to feed (Table 1) and water. Feeds were given to pigs four times per d at 08.00, 12.00, 16.00 and 20.00 hours. L. plantarum (3·5 × 1010 colony-forming units/g) were obtained from He Tai Hua Biotech Company. At the first meal of each day, piglets in the PRO group were given 50 mg (recommended by the manufacturer) of L. plantarum diluted in maize starch, while piglets in the CON group were given the same amount of maize starch without L. plantarum. At first feeding on every morning, the maize starch with or without L. plantarum was taken out from the freezer and mixed with small amount of feeds and then given to pigs to ensure the complete ingestion of the given L. plantarum. The feeding trial lasted 2 weeks. Feed intake was recorded daily. On the morning of days 0, 7 and 14 of the experiment, body weight was recorded and blood samples from anterior vena cava were collected with heparinised tubes. At day 14, fresh faecal samples were collected directly from rectum after stimulating animals to defecate. Then, piglets were transported to the surgical operating room and implanted with catheters in external jugular vein with amoxicillin spread over the surgical site to prevent infection. After 3-d recovery period, overnight-fasted piglets were given feeds and treatments in the morning and feed intake was recorded (CON group: 214·00 (sem 20·24) g; PRO group: 215·83 (sem 20·17) g). Blood samples at fasting state (0 min) and at 15, 30, 60, 120 and 180 min postprandial were collected from the jugular catheter. Blood samples were centrifuged at 3000 g for 10 min, and plasma samples were stored at –20°C. Immediately after the completion of blood collection, six piglets from each group were euthanised. An incision was made on the middle abdomen of piglets, and ileum and liver tissue samples were collected and washed with sterile saline and snap-frozen in liquid N2. Approximately 2-cm length of duodenum, jejunum and ileum samples were fixed in 4 % paraformaldehyde and used for measurement of morphometry as we previously described in detail(Reference Lin, Yang and Yuan22).
Table 1. Composition and nutrient levels of the basal diet
(Percentages)

* Vitamin premix provided the following per kg of the diet: vitamin A, 36·75 mg; vitamin D3, 87·5 μg; vitamin E, 6·25 IU; vitamin K, 3·5 mg; thiamine, 3·5 mg; riboflavin, 8·75 mg; niacin, 35 mg; d-pantothenic acid, 17·5 mg; vitamin B6, 5·25 mg; vitamin B12, 35 μg; d-biotin, 140 μg and folic acid, 1·75 mg.
† Mineral premix provided the following per kg of the diet: Fe, 340 mg; Cu, 25 mg; Mn, 13 mg; Zn, 300 mg; iodine, 0·15 mg and Se, 0·3 mg.
Faecal microbial analysis
DNA was extracted using a stool DNA isolation kit (Omega Bio-Tek Inc.) according to the manufacturer’s instructions, and DNA concentration and purity were monitored on 1 % agarose gels. The V4 region of the 16S rRNA gene was amplified using 515F and 806R primer (5′-GTGCCAGCMGCCGCGGTAA-3′and 5′-GGACTACHVGGGTWTCTAAT-3′, respectively). Mixture of PCR products was purified with a Qiagen Gel Extraction Kit. Sequencing libraries were generated and subjected for sequencing on the IlluminaHiSeq2500 platform. Paired-end reads were merged using FLASH, and high-quality clean tags were obtained using the QIIME quality-controlled process. Effective tags were obtained after comparing with the reference database and removing the chimera sequences. Sequences were clustered into operational taxonomic units using Uparse software at the 97 % similarity level. The Ribosomal Database Project classifier was used to assign a taxonomic rank to each representative sequence. α-Diversity indices were calculated using QIIME software.
Determination of bile acid composition
All BA standards were obtained from Steraloids Inc. and TRC Chemicals. Ileum tissue samples were collected, weighed and homogenised with acetonitrile:methanol (8:2) containing internal standards and centrifuged at 13 500 rpm and 4°C for 20 min to remove the protein. After centrifugation, the supernatant was freeze-dried with a stopping tray system (Labconco) and then was reconstituted with 1:1 (v/v) of acetonitrile/methanol (80/20, v/v) and ultrapure water and centrifuged at 13 500 g and 4°C for 20 min. The supernatant was used to determine BA using an ultra-performance liquid chromatography coupled to tandem MS (UPLC-MS/MS) system (ACQUITY UPLC-Xevo TQ-S, Waters Corp.).
Determination of total bile acids, glucose and glucagon-like peptide-1
The total bile acids (TBA) were measured by using the enzymatic cycling method assay kits, and both TBA and glucose in plasma were measured using a 7020 automatic biochemical analyzer. Plasma glucagon-like peptide (GLP)-1 was measured using an ELISA kit (Millipore) according to the manufacturer’s instructions.
Cell culture and treatment
IPEC-J2 cells were grown in the Dulbecco’s modified Eagle’s medium/F12 medium containing 5 % fetal bovine serum, 50 U/ml penicillin, 50 μg/ml streptomycin and 2 mm GlutaMAX (all from Gibco) at 37°C and 5 % CO2. LCA was dissolved in dimethyl sulphoxide, while lipopolysaccharides (LPS) were dissolved in PBS (LCA, dimethyl sulphoxide and LPS were all purchased from Sigma-Aldrich). Cells were seeded in twelve-well plate. When grown to confluence, 5 μm of LCA or dimethyl sulphoxide was used to treat cells for 12 h and then each well was added with LPS (10 μg/ml) or saline for another 4 h. The concentrations of LCA and LPS used were based on previous studies(Reference Lin, Yang and Yuan22,Reference Omonijo, Liu and Hui23) . Cell culture medium was collected for measurement of IL-8. RNA and protein were extracted for analysis of gene and protein expression.
Determination of IL-8 in medium
IL-8 concentration was determined by using an ELISA kit (Meimian, Jiangsu Feiya Biological Technology Co. Ltd) according to the manufacturer’s instructions.
Gene expression analysis
Gene expression analysis was performed as we described previously(Reference Lin, Yang and Yuan22). Total RNA was extracted from tissues and cells using RNAiso Plus (Takara) and then reverse-transcribed to complementary DNA (cDNA) using a PrimeScript™ RT reagent kit (Takara) according to the manufacturer’s instructions. The primers are listed in Table 2. The cDNA was subjected to PCR amplification using TB Green™ Premix Ex Taq™ II (Takara) in a CFX96 Real-Time PCR Detection System (Bio-Rad) according to manufacturer’s instructions. The 2–ΔΔCt method(Reference Livak and Schmittgen24) was used to calculate the relative expression of each gene.
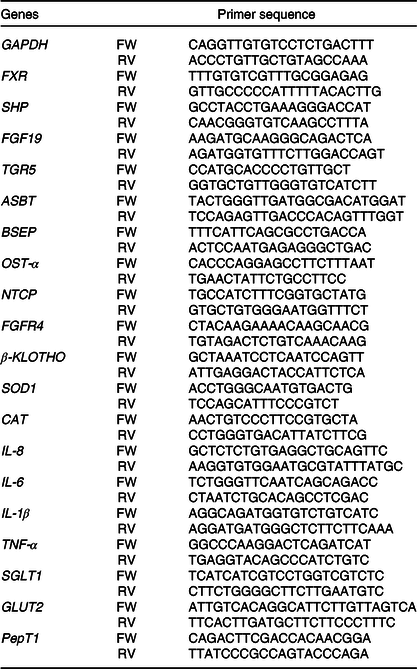
Table 2. Primer sequences for quantitative PCR
Western blotting
Western blotting was performed as we described previously(Reference Lin, Yang and Yuan22). Briefly, following treatment, cells were washed with PBS for twice and cellular protein was extracted using RIPA lysis buffer containing 1 mM phenylmethylsulfonyl fluoride protease inhibitor (Beyotime Biotech Inc.) and the concentration was then measured using a Pierce BCA protein assay kit (Thermo Fisher Scientific). Protein samples were loaded for SDS-PAGE and then transferred to a polyvinylidene difluoride (PVDF) membrane (Bio-Rad). The PVDF membrane was blocked in skimmed milk at room temperature for 1 h and then incubated with primary antibodies (anti-proliferating cell nuclear antigen (PCNA), anti-caspase-3 and anti-β-actin were purchased from Cell Signaling Technology) overnight at 4°C. After incubation with secondary antibody at 4°C for 1 h, visualisation was carried out using the ECL kit (Beyotime Biotech Inc.) in the gel detection system (Bio-Rad).
Statistical analysis
Data from the in vitro study and for plasma TBA were analysed by using the two-way ANOVA procedure, and post hoc testing was determined by Tukey’s test, while data for the rest of the measurements were analysed by using Student’s t test according to a previous study(Reference Lukens, Gurung and Vogel25). Relative abundances of microbiota at different levels were log-transformed before analysis by using the following formula: relative abundancetransformed = log10 relative abundance. These procedures were carried out by using GraphPad prism 6.0 software. The glucose and GLP-1 data were analysed using the linear mixed-effects model procedure in SAS 9.4 software.
Results
Growth performance and intestinal morphology
Body weight of piglets was not different (P > 0·10) between the CON and PRO groups at days 7 and 14 of the experiment phase (Table 3). Average daily feed intake, average daily gain and feed:gain ratio were also not different (P > 0·10) between groups during the first and second experimental week, though piglets fed L. plantarum had numerically 17 % increase in overall average daily gain in comparison with the CON piglets. Villus height, crypt depth and ratios of villus height:crypt depth were also not different (P > 0·10) between groups (Table 4).
Table 3. Effects of supplementing Lactobacillus plantarum on growth performance of weaning piglets (n 14)
(Mean values with their standard errors)

CON, control group; PRO, probiotic group; BW, body weight; ADFI, average daily feed intake; ADG, average daily gain; F:G, feed:gain ratio.
Table 4. Effects of supplementing Lactobacillus plantarum on intestinal morphology of weaning piglets (n 6)
(Mean values with their standard errors)

CON, control group; PRO, probiotic group; VCR, ratio of villus height:crypt depth.
Plasma total bile acid and bile acid profile in ileum tissue
Compared with the CON group, piglets in the PRO group tended (P < 0·10) to have lower GLCA, while higher CA level (Table 5) in ileum tissue. Total LCA level in ileum tissue was significantly lower (P < 0·05) in PRO than in CON group (Fig. 1). The other primary and secondary BA were not different (P > 0·05) between groups (Table 5). Plasma TBA levels were not affected by oral administration of L. plantarum (Fig. 1), whereas they were significantly affected by time, with lower (P < 0·05) TBA observed at days 7 and 14 as compared with their baseline levels in both groups.
Table 5. Effects of supplementing Lactobacillus plantarum on bile acid profile in the ileum of weaning piglets (n 6)
(Mean values with their standard errors)

CON, control group; PRO, probiotic group; HCA, hyocholic acid; G-, glyco-; T-, tauro-; CDCA, chenodeoxycholic acid; CA, cholic acid; HDCA, heodeoxucholic acid; LCA, lithocholic acid; UDCA, ursodeoxycholic acid.

Fig. 1. Effects of supplementing Lactobacillus plantarum on plasma total bile acids (A) and total lithocholic acid (LCA) in the ileum (B) of weaning piglets. Values are means with their standard errors, n 12 for plasma total bile acids while n 6 for total LCA. a,b Mean values with unlike letters were significantly different (P < 0·05). * P < 0·05 probiotic group (PRO) v. control group (CON). Total LCA is the sum of LCA, glyco-LCA and tauro-LCA. ![]() , CON;
, CON; ![]() , PRO; D0, day 0; D7, day 7; D14, day 14.
, PRO; D0, day 0; D7, day 7; D14, day 14.
Faecal microbial profile
In the present study, a total of 5 112 798 reads were obtained with an average of 83 609 sequences per sample. The total number of operational taxonomic units detected was 2152, and the two groups shared the same 1651 operational taxonomic units. The α-diversity results were not different (P > 0·10) between groups (Fig. 2). There was a tendency (P < 0·10) towards decreased relative abundance of the Tenericutes phylum in the PRO group (Table 6). The relative abundance of the Lactobacillus genus tended (P < 0·10) to be higher in the PRO than in the CON group. At the genus level, compared with the CON group, the PRO group had higher (P < 0·05) relative abundances of Megasphaera and Collinsella (Table 7), while lower (P < 0·05) relative abundances of Bacteroides, Parabacteroides, Clostridium_sensu_stricto_1, Ruminococcus_1 and Desulfovibrio (Fig. 3).

Fig. 2. Venn diagrams for bacterial operational taxonomic units (A) and α-diversity indices (B) in weaning piglets supplemented with Lactobacillus plantarum or not. Values are means with their standard errors, n 12. ![]() , Control group;
, Control group; ![]() , probiotic group.
, probiotic group.
Table 6. Relative abundances (%) of ten bacteria phyla* (n 12)
(Mean values with their standard errors)

CON, control group; PRO, probiotic group.
* Data were log-transformed before statistical analysis.
Table 7. Relative abundances (%) of twenty bacteria genera* (n 12) (Mean values with their standard errors)

CON, control group; PRO, probiotic group.
* Data were log-transformed before statistical analysis.
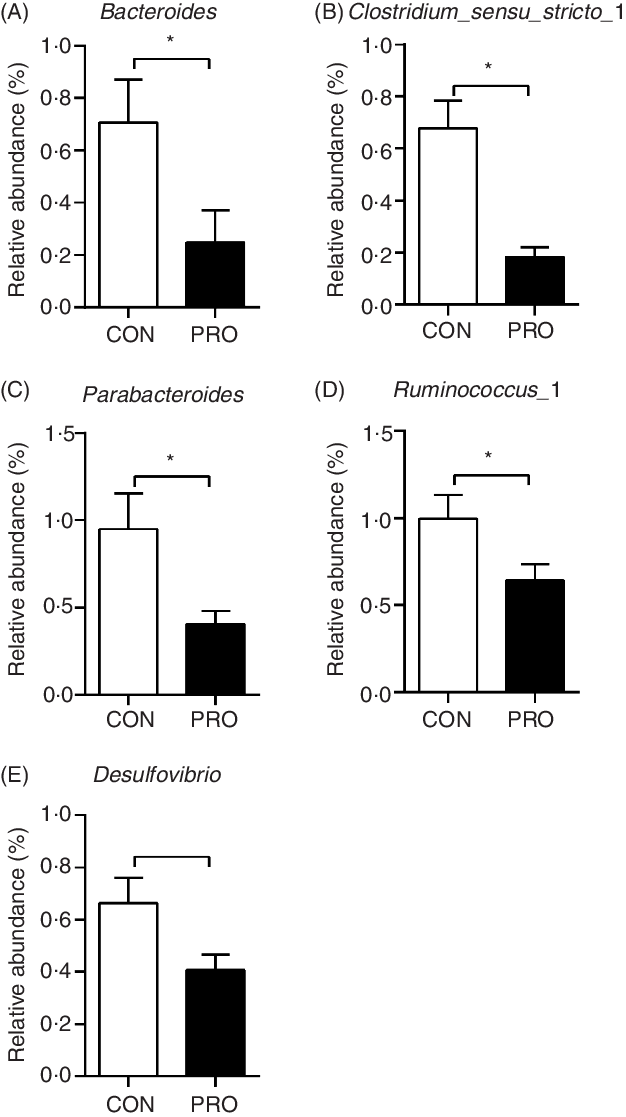
Fig. 3. Effects of supplementing Lactobacillus plantarum on faecal bacteria genera in weaning piglets. Values are means with their standard errors, n 12. * P < 0·05 probiotic group (PRO) v. control group (CON).
Plasma glucose and glucagon-like peptide-1
Oral administration of L. plantarum led to increased (P < 0·05) postprandial blood glucose levels (Fig. 4). Notably, at 180 min postprandial, the PRO piglets had significantly higher (P < 0·05) blood glucose level than the CON piglets. The AUC of glucose was also higher (P < 0·05) in the PRO than in the CON piglets. In contrast, plasma GLP-1 levels tended to decrease (P < 0·10) in piglets fed L. plantarum. Remarkably, the CON piglets had higher (P < 0·05) plasma GLP-1 levels than the PRO piglets at 60 min and 180 min postprandial. The AUC of GLP-1 also tended (P < 0·10) to be lower in the PRO than in the CON piglets.
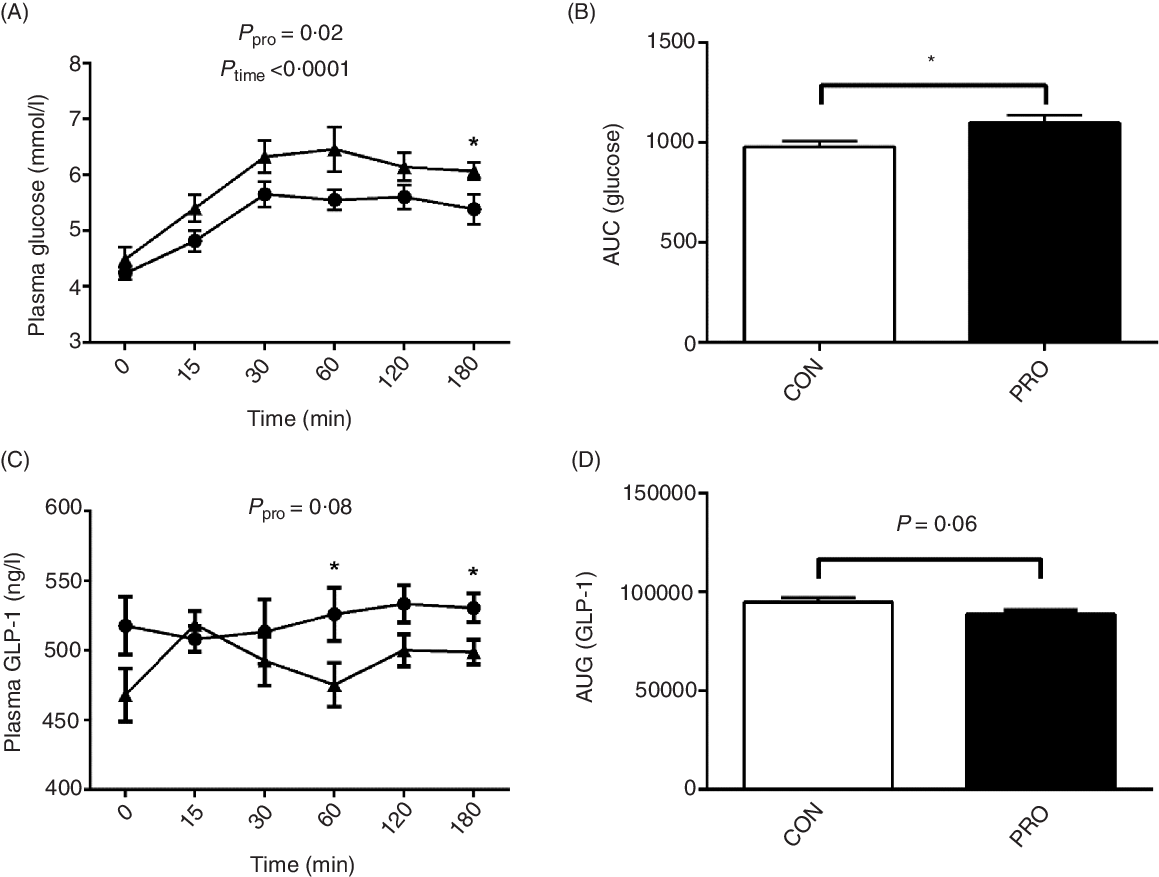
Fig. 4. Effects of supplementing Lactobacillus plantarum on plasma glucose (A) and AUC (B) and glucagon-like peptide (GLP)-1 level (C) and AUC (D) in weaning piglets. Values are means with their standard errors, n 12. * P < 0·05 control group (CON) v. probiotic group (PRO). ![]() , PRO;
, PRO; ![]() , CON.
, CON.
Gene expression in intestine and liver tissues
As shown in Fig. 5, there were no significant (P > 0·05) differences in the relative expression of genes associated with BA metabolism between the CON and PRO groups. The expression of genes related to inflammation and glucose transport was also not affected (P > 0·05) by L. plantarum consumption (online Supplementary Fig. S1).
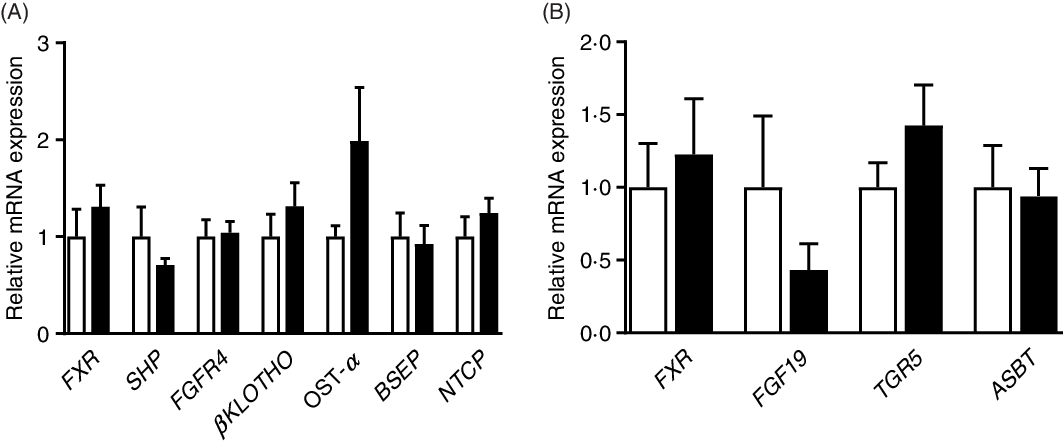
Fig. 5. Effects of supplementing Lactobacillus plantarum on expression of genes related to bile acid metabolism in the ileum (A) and liver (B) of weaning piglets. Mean values with their standard errors, n 6. ![]() , Control group;
, Control group; ![]() , probiotic group.
, probiotic group.
IL-8 secretion and gene expression of IL-6 and IL-8 in IPEC-J2 cells
Secretion of IL-8 from IPEC-J2 cells was augmented (P < 0·05) by both LPS and LCA treatment (Fig. 6(A)). LPS treatment had no effect (P > 0·05) on the relative mRNA abundance of IL-8 (Fig. 6(B)) and IL-6 (Fig. 6(C)), whereas LCA treatment significantly up-regulated mRNA abundance of IL-8 (P < 0·0001) and IL-6 (P < 0·001).

Fig. 6. Effects of lithocholic acid (LCA) on secretion of IL-8 (A) and relative mRNA expression of IL-8 (B) and IL-6 (C) in IPEC-J2 cells in the presence and absence of lipopolysaccharides (LPS). Values are means with their standard errors, n 4. a,b,c Mean values with unlike letters were significantly different (P < 0·05). ![]() , –LPS;
, –LPS; ![]() , +LPS.
, +LPS.
Expression of antioxidant and transporter gene and protein abundances of proliferating cell nuclear antigen and caspase-3
The relative mRNA expression of catalase and superoxide dismutase 1 was down-regulated (P < 0·0001) by LCA treatment (Fig. 7). Interestingly, the mRNA expression of GLUT2 was not affected (P > 0·05) by LPS or LCA treatment alone, whereas was down-regulated (P < 0·05) by the co-treatment of LPS and LCA as compared with the LCA treatment alone (Fig. 8(A)). Similarly, the mRNA expression of Na-dependent glucose co-transporter 1 (SGLT1) (Fig. 8(B)) and peptide transporter-1 (PepT1) (Fig. 8(C)) was not affected (P > 0·05) by LPS or LCA treatment alone, whereas was down-regulated (P < 0·05) by the co-treatment of LPS and LCA as compared with the LPS treatment alone. The protein levels of caspase-3 were not affected (P > 0·05) by treatment of either LCA or LPS. LPS treatment also had no effect (P > 0·05) on protein level of PCNA, whereas LCA treatment alone decreased (P < 0·05) the protein abundance of PCNA (Fig. 9).
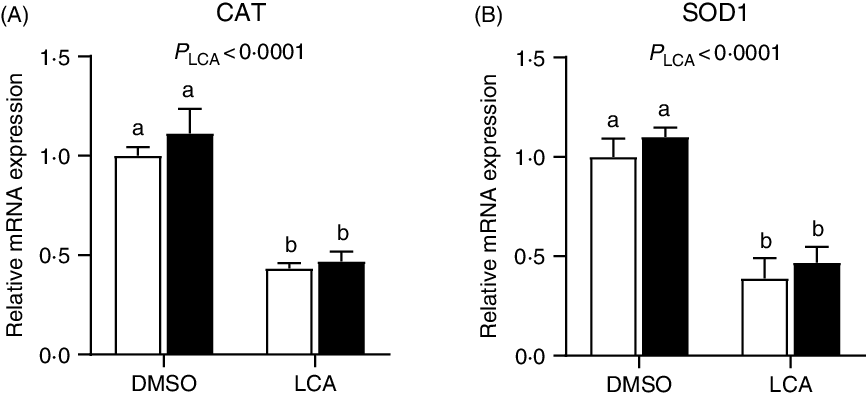
Fig. 7. Effects of lithocholic acid (LCA) on expression of catalase (CAT) (A) and superoxide dismutase 1 (SOD1) (B) in IPEC-J2 cells in the presence and absence of lipopolysaccharides (LPS). Values are means with their standard errors, n 4. a,b Mean values with unlike letters were significantly different (P < 0·05). ![]() , –LPS;
, –LPS; ![]() , +LPS; DMSO, dimethylsulfoxide.
, +LPS; DMSO, dimethylsulfoxide.

Fig. 8. Effects of lithocholic acid (LCA) on gene expression of GLUT2 (A), sodium-dependent glucose co-transporter 1 (SGLT1) (B) and peptide transporter-1 (PepT1) (C) in IPEC-J2 cells in the presence and absence of lipopolysaccharides (LPS). Values are means with their standard errors, n 4. a,b,c Mean values with unlike letters were significantly different (P < 0·05). ![]() , –LPS;
, –LPS; ![]() , +LPS; DMSO, dimethylsulfoxide.
, +LPS; DMSO, dimethylsulfoxide.

Fig. 9. Effects of lithocholic acid (LCA) on the protein abundances (A) of proliferating cell nuclear antigen (PCNA) (B) and caspase-3 (C) in IPEC-J2 cells in the presence and absence of lipopolysaccharides (LPS). Protein abundances were determined by Western blot and normalised to β-actin. Values are means with their standard errors, n 4. ![]() , –LPS;
, –LPS; ![]() , +LPS; DMSO, dimethylsulfoxide.
, +LPS; DMSO, dimethylsulfoxide.
Discussion
BA play critical roles in the regulation of intestinal physiology(Reference Dossa, Escobar and Golden26,Reference Raimondi, Santoro and Barone27) . The most common secondary BA, LCA and DCA, have been shown to induce cell apoptosis and increase intestinal permeability(Reference Stenman, Holma and Eggert5,Reference Katona, Anant and Covey6,Reference Powell, LaRue and Batta28) and have been correlated with colorectal carcinogenesis(Reference Katona, Anant and Covey6,Reference Degirolamo, Modica and Palasciano29) . Our recent study also revealed the detrimental effect of LCA and DCA on porcine enterocytes including suppression of cell proliferation, impairment of tight junction and inducement of inflammatory responses(Reference Lin, Yang and Yuan22). In light of the importance of gut microbiota in the production of secondary BA(Reference Studer, Desharnais and Beutler11,Reference Jia, Xie and Jia12) , supplementation of probiotics appeared to be a promising nutritional strategy regulating secondary BA production and may thus aid in the improvement of intestinal health. Hereby, we used piglets as model considering the higher similarity in BA composition between pigs and human when compared with rats and mice(Reference Fang, Zhang and Meng30,Reference Thakare, Alamoudi and Gautam31) .
In this study, the growth performance of piglets during the first and second week was not different between the CON and PRO groups. This is in line with a previous study in weaning piglets showing that feeding L. plantarum had no effects on growth performance in the first 2 weeks but improved the average daily gain in the third week(Reference Wang, Teng and Liu32). It is therefore inferred that the beneficial effects of L. plantarum on growth performance may require longer time.
Plasma TBA levels were not different between the CON and PRO groups, whereas the highest plasma TBA levels were observed at day 0 in both groups, which might be related to the change of food sources. As elucidated in a previous study, sow-reared piglets had higher conjugated BA and unconjugated BA in serum than formula-fed piglets(Reference Mercer, Bhattacharyya and Diaz-Rubio33), whereas underlying mechanisms need further investigation. After being released into the gastrointestinal tract, most BA can be reabsorbed via BA transporters in the intestine, especially in the ileum(Reference Marin, Macias and Briz34). Measuring the BA composition in the ileum allowed us to assess the potential impacts of individual BA on enterocytes. Interestingly, lower total LCA level was observed in the PRO group. In addition, piglets fed L. plantarum tended to have lower GLCA level while higher CA level in the ileum. In the intestine, CDCA and CA are metabolised by intestinal microbiota with 7α dehydroxylation activity to produce LCA and DCA, respectively(Reference Wahlström, Sayin and Marschall10,Reference Jia, Xie and Jia12) . Neither conjugated nor unconjugated DCA was detected in ileum tissue, which might suggest an extremely low level of DCA reabsorbed. But, the higher CA level in piglets fed L. plantarum may indicate dampened biotransformation of CA to form DCA, which might lead to lower DCA accumulation in the other tissues. Given that LCA and its conjugated forms are all ligands to farnesoid X receptor (FXR)(Reference Parks, Blanchard and Bledsoe35), we also determined the relative mRNA abundance of central molecules in the FXR-FGF19 signalling pathway and observed no difference between groups, which was probably due to the fact that LCA is a relatively weak FXR agonist when compared with CDCA and DCA(Reference Wang, Chen and Hollister36). LCA is also a ligand of G protein coupled with bile acid receptor 1 (TGR5) and proposed to activate TGR5 more potent than DCA, CDCA and CA(Reference Sato, Genet and Strehle37,Reference Kawamata, Fujii and Hosoya38) . GLP-1, an incretin secreted from enteroendocrine cells in the distal intestine(Reference Burrin, Stoll and Moore39,Reference Drucker, Habener and Holst40) with beneficial effects on glucose homoeostasis(Reference Thomas, Gioiello and Noriega41), is an important marker of TGR5 activation(Reference Parker, Wallis and le Roux42,Reference Susumu, Akira and Gozoh43) . We therefore detected the changes of GLP-1 and glucose concentrations in 3 h after feeding. Higher plasma GLP-1 levels in the CON piglets probably indicated that the higher total LCA level maintained the activation of TGR5 and continuous GLP-1 secretion. However, in piglets fed L. plantarum, lower GLP-1 might be attributed to dampened TGR5 activation resulted from lower total LCA concentration. Furthermore, in the PRO piglets, the lower GLP-1 level might consequently lead to increased postprandial glucose level.
To elucidate the potential impacts of gut microbiota on alteration of BA composition, we determined the microbiota profile in faecal samples. Despite most BA are reabsorbed in the terminal ileum, the biotransformation of BA mainly occurs in the colon(Reference Joyce and Gahan44) and secondary BA will come into the blood stream via passive reabsorption and recycle in enterohepatic circulation. Faecal microbiota has been shown to have high similarity to colonic microbiota(Reference Zhao, Wang and Liu45), and thus faecal microbiota profile was determined using 16S rRNA gene sequencing to evaluate the change of microbiota involved in BA metabolism. The most direct change lay in the Lactobacillus genus which showed tendency towards increase in the PRO piglets. This result confirmed the colonisation of L. plantarum supplemented. The PRO piglets also showed higher relative abundances of the Megasphaera genus, a SCFA-producing bacterium(Reference Vo, Tsai and Maxwell46), and the Collinsella genus, which have been shown to be positively correlated with T cell response in blood(Reference Twitchell, Tin and Wen47). Desulfovibrio facilitates the formation of the hazardous gas hydrogen sulphide and causes colonic inflammation(Reference Fava and Danese48,Reference Carbonero, Benefiel and Alizadeh-Ghamsari49) . Accordingly, lower relative abundance of Desulfovibrio was observed in PRO piglets. Therefore, L. plantarum supplementation may benefit the intestine of piglets in different manners. Changes also occurred in gut microbiota related to BA metabolism. Epimerisation of 7α/β hydroxyl group is an important step before the 7α dehydroxylation and formation of LCA and DCA, and Bacteriodes and Ruminococcus exert important roles in this process(Reference Ridlon, Kang and Hylemon7,Reference Jia, Xie and Jia12) . It has been shown in a recent study that high-fat diet-induced increase in secondary BA was correlated with the increase in Ruminococcus (Reference Lin, An and Tang50). Parabacteroides distasonis treatment in mice was reported to be capable of increasing faecal LCA level(Reference Wang, Liao and Zhou51). Clostridium possesses 7a-dehydroxylation ability, the most important BA transformation that produces DCA and LCA(Reference Pereira-Fantini, Lapthorne and Joyce9,Reference Studer, Desharnais and Beutler11,Reference Jia, Xie and Jia12) . It has been shown that L. plantarum had antimicrobial activity against species of Clostridium (Reference Monteiro, do Carmo and Melo19), which might account for the decrease of Clostridium after L. plantarum feeding. Therefore, feeding L. plantarum inhibited the formation of LCA possibly through reducing the relative abundances of Bacteroides, Ruminococcus, Parabacteroides and Clostridium.
High-fat diet-induced increase in intestinal permeability was demonstrated to be accompanied by increased faecal DCA and LCA levels(Reference Stenman, Holma and Korpela52). Our recent study also confirmed the detrimental effects of LCA on tight junction protein expression(Reference Lin, Yang and Yuan22). In our in vivo study, increased LCA accumulation had no significant effects on expression of inflammatory genes in the ileum. Given the role of LCA in disturbing intestinal tight junction and permeability, we propose that LCA may synergise with bacteria endotoxins to augment inflammatory responses in the intestine. Therefore, IPEC-J2 cells were used as an in vitro model to explore the effects of LCA and LPS on immunity and gene expression of antioxidant enzymes and nutrient transporters. LCA treatment appeared to suppress the gene expression of IL-6 and IL-8 and led to decreased protein abundances of PCNA, an important marker reflecting cell proliferation(Reference Waga, Hannon and Beach53). The gene expression of catalase and superoxide dismutase 1, important enzymes that aid in relieving oxidative stresses(Reference Aruoma54), was also down-regulated by LCA treatment. Secretion of IL-8 and expression of GLUT2 were affected by interaction between LPS and LCA. Additionally, LCA treatment led to down-regulation of SGLT1 and PepT1 expression in the presence of LPS while showed no effect in the absence of LPS. Both SGLT1 and GLUT2 are important for the transport of dietary glucose into enterocytes(Reference Chen, Tuo and Dong55), while PepT1 plays a role in the transport of peptide(Reference Shen and Matsui56). These results indicate that LCA may synergise with pathogens to augment inflammation and damage antioxidant activity and nutrient uptake.
In conclusion, our findings indicated that consumption of L. plantarum altered BA profile probably by modulating relative abundances of gut microbial genera that play key roles in BA metabolism and might consequently impact glucose homoeostasis. Our in vitro study showed that LCA could decrease cell proliferation and expression of antioxidant enzymes, while stimulate inflammatory responses and might interact with LPS to disturb enterocyte nutrient transport.
Acknowledgements
This work was supported by the National Natural Science Foundation of China (31472109) and Sichuan Agricultural University Foundation for Fostering Youths Talents (00924104).
The authors’ responsibilities were as follows: Z. F., D. W., L. C., B. F., J. L., Y. Z., Y. L. and S. X. designed the research; S. L., X. Y., Y. L., H. Z., P. W., P. Y. and X. Z. conducted the research; S. L. and Z. F. wrote the paper; Z. F. had primary responsibility for the final content and all authors read and approved the final manuscript.
The authors declare that there are no conflicts of interest.
Supplementary material
For supplementary material referred to in this article, please visit https://doi.org/10.1017/S0007114520001774


