


Diabetes is a serious public health problem. A study published in The Lancet showed that the number of people with diabetes worldwide increased from 108 million to 422 million in 1980–2014(1). According to the 2019 International Diabetes Federation Western Pacific report, approximately 116·4 million adults aged 20–79 years in China have diabetes, representing a regional prevalence of 10·9 %(2). A cross-sectional survey showed an 8·9 % prevalence of diabetes in China, which is higher than that of South Korea (5·7 %) and Japan (4·8 %)(Reference Ma, Sakai and Wakabayashi3). Additionally, patients with diabetes are prone to developing chronic illnesses such as IHD, stroke, chronic kidney disease, peripheral artery disease, specific cancers and tuberculosis(Reference Tripathy4). Preventing or delaying the onset of diabetes is a top priority for global public health.
Dietary factors are closely related to the development of diabetes. Among them, dietary intake is a major modifier in diabetes management(Reference Herrera, Subhan and Chan5). Increased consumption of a healthy diet reduces the risk of diabetes(Reference Schwingshackl, Hoffmann and Lampousi6); therefore, the association between dietary patterns and diseases is gaining attention. Prospective observational studies and clinical trials have evidenced the importance of a healthy diet in preventing and managing diabetes(Reference Ley, Hamdy and Mohan7). Examples include the Mediterranean-style diet, which emphasises synergy among various nutrients and foods(Reference Vitale, Masulli and Calabrese8), and the Dietary Approaches to Stop Hypertension diet, which plays an important role in glycaemic control in long-term interventions(Reference Shirani, Salehi-Abargouei and Azadbakht9). One study found that adherence to the American Dietary Guidelines may reduce the risk of major chronic diseases(Reference Chiuve, Fung and Rimm10). Scholars often use the Alternate Healthy Eating Index to evaluate the dietary habits of local populations(11,Reference Whitton, Rebello and Lee12) . The Alternate Healthy Eating Index enables assessing the relationship between diet and chronic diseases. Additionally, a meta-analysis revealed that the Mediterranean diet, Dietary Approaches to Stop Hypertension and Alternate Healthy Eating Index are closely correlated with a reduced risk of diabetes, even with their different specific components(Reference Jannasch, Kröger and Schulze13).
However, although the effects of a healthy diet on diabetes prevention are known, most studies are conducted in western populations in developed countries(Reference Yu, Zheng and Cai14). Therefore, the results of those studies may not be generalisable to populations with different dietary cultures in different regions, especially to certain Chinese populations who consume fewer whole grains and vegetables and more refined grains, red meat, unhealthy fats and fried foods(Reference Wang, Lin and Bloomgarden15) such as in northern China.
Inner Mongolia is a frontier in northern China, located southeast of the Mongolian plateau, extending 2400 km east to west and 1700 km north to south. Inner Mongolia accounts for nearly one-eighth of the territory in China, which differs geographically and culturally from other regions in China. Because the typical gathering areas are multiethnic and dominated by Han Chinese or Mongolians, Inner Mongolian residents exhibit unique dietary habits. However, large-scale, representative nutritional diabetes-related epidemiological studies are lacking in Inner Mongolia, in particular, research that explored the relationship between dietary patterns and diabetes. Therefore, we conducted this study to understand the diabetes prevalence in Inner Mongolia and explore the dietary quality in association with the risk of diabetes.
Methods
Study design
This study was a surveillance survey of Chronic Disease and Nutrition Monitoring among Chinese Adults in Inner Mongolia in 2015. This was a cross-sectional, population-based survey that characterised the dietary and nondietary factors (i.e. general demographics, lifestyle, diabetes prevalence rate, dietary behavioural habits and daily food intake) among residents aged ≥18 years in Inner Mongolia. The survey used a multistage-stratified cluster random sampling design covering eight monitoring sites including the urban, rural and pastoral areas in the eastern, central and western regions of Inner Mongolia.
The sample size estimation formula in this study according to the stratified random sampling was estimated based on the diabetes prevalence of the Health Service Survey in Inner Mongolia in 2012 (P = 0·0692). We considered a 0·015 permissible δ error value and a 10 % non-response rate, and we estimated the sample size to be 1209. In total, 1861 participants were included. According to the Health Service Survey in Inner Mongolia in 2012, the total number of participants surveyed was 21 500 (P = 0·0692) and our study was 1861 (P = 0·085). The statistical power (1 – β) was 71 %.
The Ethical Committee of the National Institute for Nutrition and Food Safety, Chinese Center for Disease Control and Prevention approved the survey (201519-A). All participants provided written informed consent before the start of the investigation.
Dietary data collection
Dietary data were collected from a 24-h dietary recall and weighing method over three consecutive days. The dietary survey was in accordance with the Chinese Dietary Guidelines for chronic disease and nutrition surveillance in Chinese adults and aimed to determine residents’ nutrient and food intake. All household members (aged ≥2 years) were investigated. In the 24-h dietary recalls, participants recalled and described the types and quantities of food consumed over three consecutive days. Information on daily consumption of major seasonings, such as cooking oil, salt and monosodium glutamate, was collected using a weighing method. Condiments purchased and wasted were also recorded.
Drinking frequency, type (liquor with high alcohol content, liquor with low alcohol content, beer, yellow rice wine, rice wine, wine) and average drinking amount were measured. The average daily alcohol consumption was calculated according to the Manual of Chinese Chronic Disease and Nutrition Surveillance Survey(Reference Wang, Lay and Yu16). Participants’ height, weight and waist circumference were measured directly by trained investigators. Blood and urine samples were also collected. The laboratory director organised the sample quality control assessment at a field laboratory.
Chinese Dietary Balance Index-16
The Chinese Dietary Balance Index-16 (DBI-16) is a method of evaluating dietary structure and quality based on the Chinese Dietary Guidelines, consisting of eight components (value range): (i) cereals (−12 to 12); (ii) vegetables (−6 to 0) and fruits (−6 to 0); (iii) milk (−6 to 0) and soyabeans (−6 to 0); (iv) animal foods (−4 to 4 for meat, −4 to 0 for fish and −4 to 4 for eggs); (v) pure energy foods (0–6 for oil, 0–6 for alcohol); (vi) condiments (0–6 for sugar; 0–6 for salt); (vii) dietary variety (−12 to 0) and (viii) drinking water (−12 to 0)(Reference He, Fang and Xia17). The DBI-16 evaluation of intake quality for different foods is based on consumption patterns of individuals with different energy intakes. A score of 0 for each component indicates that the recommended intake has been met. Positive scores (0–12) indicate excess intake; negative scores (−12 to 0) indicate insufficient intake. The DBI-16 is further divided into twelve food subgroups used to calculate the dietary variety score(Reference He, Qiao and Xiong18).
The DBI-16 contains three dietary quality indicators: the higher-bound score (HBS), the lower-bound score (LBS) and diet quality distance (DQD)(Reference He, Fang and Xia17). The HBS is calculated by adding all positive scores as an indicator of excessive food intake. The LBS is calculated by adding the absolute values of all negative scores as an indicator of insufficient food intake. The DQD is an indicator of unbalanced food intake, calculated by adding the absolute values of both the positive and negative scores. The possible ranges for the HBS, LBS and DQD scores are 0–44, 0–72 and 0–96, respectively. Each indicator is divided into five levels to reflect dietary quality: (i) ‘excellent’ (a score of 0); (ii) ‘good’ (<20 % of the total score); (iii) ‘low level’ (20–40 % of the total score); (iv) ‘moderate level’ (40–60 % of the total score) and (v) ‘high level’ (>60 % of the total score)(Reference He, Fang and Xia17,Reference Zang, Yu and Zhu19) . The total score of each DBI-16 component is divided by the total LBS, HBS and DQD to assess their contribution rate and how much of each food subgroup affects dietary quality.
Definition of diabetes
The main outcome indicator was type 2 diabetes. Meeting one of the following conditions was considered to indicate diabetes. The first condition was self-reported diabetes, in which patients were diagnosed with diabetes, are currently receiving diabetes treatment and/or are taking hypoglycaemic drugs. The second condition was that as per the International Diabetes Federation(2), diabetes was diagnosed if one or more of the following criteria were met: (1) fasting plasma glucose ≥ 7·0 mmol/l; (2) glycated HbA1c ≥6·5 %; (3) 2-h plasma glucose ≥ 11·1 mmol/l following a 75 g oral glucose load and (4) random plasma glucose ≥ 11·1 mmol/l.
Definition of other variables
Age was categorised as 18–, 30– or ≥50 years. Participant household registration location was categorised as urban or rural. Based on regional characteristics, ethnic groups were categorised as Han, Mongolian or other minorities (i.e. all minorities living in Inner Mongolia except Han and Mongolian). Educational level was categorised as low (primary school or lower), medium (junior high school) or high (senior high school and above). Marital status was categorised as married, unmarried or widowed/divorced.
Abdominal obesity was diagnosed as per the Working Group on Obesity of China(20): waist circumference ≥ 90 cm for men and waist circumference ≥ 85 cm for women.
Alcohol consumption was determined for the past year. Participants were categorised according to their average daily alcohol consumption: no drinking (0 g/d), moderate drinking (<25 g/d) or excessive drinking (>25 g/d)(21).
Smoking status was categorised as non-smoker (never having smoked previously), ex-smoker (previously smoked but quit) or current smoker (has smoked at least 1 cigarette/d for more than 1 year and currently smokes). In the present study, metabolic exercise equivalent was calculated by the International Physical Activity Questionnaire(22) and physical activity was divided into low, medium and high levels.
Statistical analysis
Normally distributed continuous variables are presented as means and standard deviations; abnormally distributed continuous variables are presented as medians and interquartile ranges. Categorical variables are presented as numbers and percentages. Student’s t test and the Mann–Whitney–Wilcoxon U test were used to assess two independent groups of continuous variables; the χ 2 test was used to assess categorical variables.
Principal component analysis was used to derive dietary patterns based on twenty-nine food groups. The varimax rotation was used to extract factor loadings. Factors were selected based on their eigenvalues (>1·00). The number of dietary patterns was determined based on scree plots, reasonability of food combination and variance contribution rate. Dietary patterns were named by combining the food composition characteristics of the dietary pattern with the main food types included. Factor scores for each pattern were calculated by adding the coefficient of the factor loading and the standardised daily intake amounts of every food type related to each pattern. Scores for each dietary pattern were categorised into quartiles Q1, Q2, Q3 and Q4 in ascending order of factor scores. Higher factor scores indicated more compliance with the dietary pattern; lower scores indicated more deviation.
Dietary pattern quality was evaluated using generalised linear models, with LBS, HBS and DQD as the dependent variables and dietary patterns as the independent variable after adjusting for other confounders. Multivariate logistic regression models were used to examine the association between dietary patterns and diabetes. The ‘Forward: LR’ method was used to select independent variables. With α = 0·05 as the significance level, P < 0·05 was considered statistically significant. All statistical analyses were conducted using IBM SPSS Statistics version 19.0 (IBM Corp.).
Results
Participant characteristics
We included 1861 participants: 973 women (52·3 %) and 888 men (47·7 %). The participants’ mean age was 52·5 years. Of participants, 159 (8·5 %) had diabetes, and of these, eighty-six were men (54·1 %) and seventy-three were women (45·9 %). Of participants, 61·0 % were over 50 years old, 58·4 % were from rural areas and 18·2 % were of ethnic minorities. Participants aged over 50 years had the highest diabetes prevalence at 11·6 % (P < 0·05). Diabetes prevalence was higher in urban areas than in rural areas (P < 0·05), and thirty-nine participants (12·6 %) had low levels of physical activity. Diabetes prevalence was higher in participants with abdominal obesity than in those without abdominal obesity (P < 0·05) and in participants with dyslipidaemia than in those without dyslipidaemia (P < 0·05). No other variables differed statistically (P > 0·05; Table 1).
Table 1. Demographic and lifestyle characteristics of diabetic and non-diabetic participants (n 1861)
(Numbers and percentages)

Dietary patterns
Principal component analysis identified four distinct dietary patterns. The most prominent dietary pattern (i.e. the pattern that explained the greatest amount of the total variance) was ‘meat/dairy products’ (eigenvalue: 2·615; 9·017 % of the total variance), characterised by milk tea and tea, fried wheat products, beef and mutton, milk and dairy products and had the highest observed positive loading factors. The second most prominent dietary pattern was ‘traditional northern’ (eigenvalue: 2·003; 6·908 % of the total variance), representing a typical traditional diet: high intake of starchy roots and products, pork, pickled vegetables/dried vegetables, maize and desserts. The third most prominent dietary pattern (eigenvalue: 1·875; 6·456 % of the total variance) was ‘high cereal/tuber’, characterised by intake of various vegetables, beans and bean products, wheat flour and products, fresh fruits, various aquatic products, eggs, vegetable oils, sugar, various beverages and nuts. The fourth (least prominent) dietary pattern was ‘high-salt/alcohol’ (eigenvalue: 1·503; 5·184 % of the total variance), characterised by high intake of salt, animal oils, condiments and alcoholic beverages. Together, these four dietary patterns accounted for 27·754 % of the variability in the original dietary variables. The Kaiser–Meyer–Olkin measure of sampling adequacy was 0·615, and Bartlett’s test of sphericity was significant (P < 0·01), determining the suitability of the data set for the principal component analysis (shown as Table 2).
Table 2. Factor loadings of each dietary pattern among Inner Mongolian adults (n 1861) in northern China, 2015

Dietary pattern characteristics
Table 3 shows the food group characteristics of the four dietary patterns. For ‘meat/dairy products’, the dietary factor scores of the different foods for cereals, meat, milk and dairy products, eggs, vegetables, fish and shrimp, tea, fried food and salt intake were statistically significant between Q1 and Q4 (P < 0·05). Among them, Q4 was higher than Q1 for cereals, meat, milk and dairy products, vegetables, tea, fried food and salt. Egg, fish and shrimp intakes were higher in Q1 than in Q4.
Table 3. Food groups according to the lowest (Q1) and highest (Q4) quartile for each dietary pattern among Inner Mongolian adults (n 1861) in northern China, 2015
(Medians and interquartile ranges (IQR))

For ‘traditional northern’, the cereal, meat, vegetable and cooking oil intakes were higher in Q4 than in Q1 (P < 0·05). The milk and dairy product, fish and shrimp, tea and fried food intakes were lower in Q4 than in Q1 (P < 0·05). The soyabean, egg, fruit and salt intakes were not statistically different (P > 0·05).
For ‘high cereal/tuber’, the milk and dairy product, tea, fried food and salt intakes were lower in Q4 than in Q1 (P < 0·05). Intake of other food was higher in Q4 than in Q1 (P < 0·05).
For ‘high-salt/alcohol’, the dietary factor scores for the intake of foods other than fried foods were statistically significant between Q1 and Q4 (P < 0·05). Cereal, meat, soyabean, vegetable, fish and shrimp, cooking oil and salt intakes were higher in Q4 than in Q1 (P < 0·05). Milk and dairy product, egg, fruit and tea intakes were lower in Q4 than in Q1 (P < 0·05).
Nutrient and energy intakes by dietary pattern
Table 4 compares nutrient and energy intakes of the four dietary patterns.
Table 4. Nutrient and energy intakes according to the lowest (Q1) and highest (Q4) quartile of each dietary pattern among Inner Mongolian adults (n 1861) in northern China, 2015
(Medians and interquartile ranges (IQR))
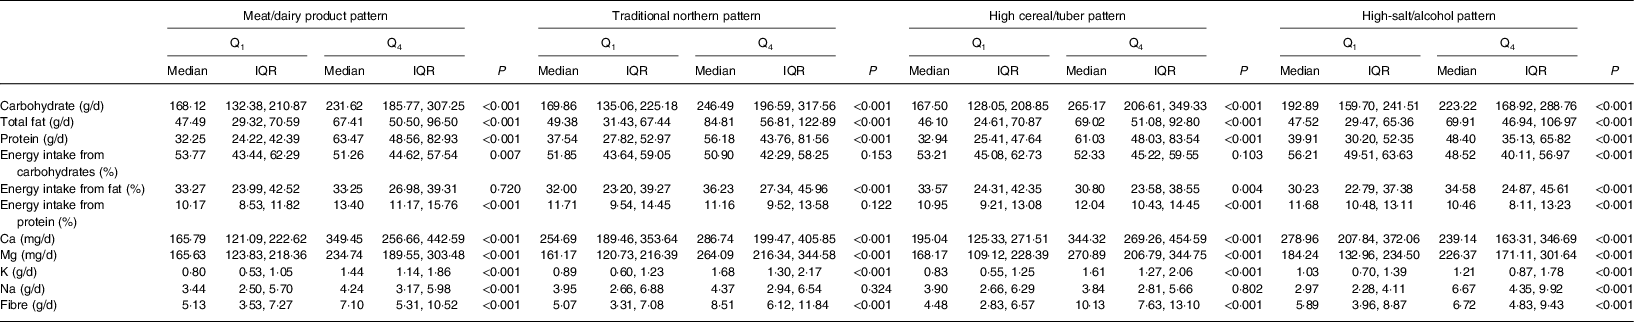
For ‘meat/dairy products’, the carbohydrate, fat, protein, Ca, Mg, K, Na, dietary fibre and energy intakes from protein were higher in Q4 than in Q1 (P < 0·05). Energy intake from carbohydrates was lower in Q4 than in Q1 (P < 0·05). For ‘traditional northern’, the carbohydrate, fat, protein, Ca, Mg, K, dietary fibre and energy intakes from fat were higher in Q4 than in Q1 (P < 0·05). For ‘high cereal/tuber’, energy intake from fat was lower in Q4 than in Q1 (P < 0·05) and the remaining nutrient and energy intakes were higher in Q4 than in Q1 (P < 0·05). For ‘high-salt/alcohol’, Ca intake and energy intake from carbohydrates and protein were lower Q4 than in Q1 (P < 0·05), while other nutrient and energy intakes were higher in Q4 than in Q1 (P < 0·05).
Quality evaluation of dietary patterns using Dietary Balance Index-16 scores
Table 5 shows the generalised linear model of the dietary patterns and DBI-16. For ‘meat/dairy products’, the regression coefficients were all <0: β LBS = −1·993 (95 % CI −2·362, −1·625; P < 0·001), β HBS = −0·206 (95 % CI −0·381, −0·030; P = 0·021) and β DQD = −2·199 (95 % CI −2·598, −1·801; P < 0·001). As the dietary pattern factor scores increased (Q1–Q4), the dietary balance indexes of the LBS, HBS and DQD decreased and the diet was relatively balanced. For ‘traditional northern’, as the factor score increased (Q1–Q4), the LBS decreased, the HBS and DQD increased, and the diet tended to be unbalanced. For ‘high cereal/tuber’, as the factor score increased (Q1–Q4), the HBS increased, the LBS and DQD decreased, and the diet tended to be unbalanced. For ‘high-salt/alcohol’, the regression coefficients were all >0: β LBS = 0·967 (95 % CI 0·570, 1·364; P < 0·001), β HBS = 0·751 (95 % CI 0·570, 0·933; P < 0·001) and β DQD = 1·718 (95 % CI 1·293, 2·143; P < 0·001). As the dietary pattern factor scores increased (Q1–Q4), the LBS, HBS and DQD increased and the diet was relatively unbalanced.
Table 5. Generalised linear model* of dietary quality according to the indicators of the Chinese Dietary Balance Index-16 (DBI-16) for each dietary pattern among Inner Mongolian adults (n 1861) in northern China, 2015
(Regression coefficients (Coef.) and 95 % confidence intervals)

LBS, lower-bound score; HBS, higher-bound score; DQD, diet-quality distance.
* Model adjusted for sex, age, place of residence, educational level, marital status, ethnic group, salt intake control, smoking status, weight control, BMI, hypertension and dyslipidaemia.
Association between dietary patterns and diabetes
Table 6 shows the relationship between dietary patterns and diabetes that was analysed using logistic regression model. After adjusting for sex, age, residence, educational level, marital status, ethnic group, smoking status, abdominal obesity and dyslipidaemia, the ‘meat/dairy product’ pattern was associated with diabetes risk. Compared with Q1, Q4 was associated with a lower risk of diabetes (OR 0·565; 95 % CI 0·338, 0·945; P < 0·05). No other dietary patterns were related to diabetes prevalence.
Table 6. Association of dietary patterns with diabetes across quartiles (Q) of dietary pattern scores among Inner Mongolian adults (n 1861) in northern China, 2015†
(Odds ratios and 95 % confidence intervals)

* P < 0·05.
† Model 1: crude model. Model 2: adjusted for sex, age, place of residence, educational level, marital status, ethnic group, smoking status, abdominal obesity and dyslipidaemia.
Discussion
Diabetes prevalence is related to economic level and tends to increase with societal and economic development(Reference Shaw, Sicree and Zimmet23). In this study, Inner Mongolia had an 8·5 % diabetes prevalence, lower than that in high-income areas, such as Beijing(Reference Wang, Han and Li24) and Shanghai(Reference Fan, Ma and Han25), but higher than that in Jiangxi(Reference Liu, Zhu and Li26) and Guilin(Reference Guo, Shi and Ma27). According to the age distribution of the 2010 population census in China, the estimated standardised diabetes prevalence was 6·0 % in Inner Mongolia, which was lower than the national levels in 2013(Reference Wang, Gao and Zhang28) and 2019(2). Therefore, diabetes is moderately prevalent in Inner Mongolia.
In Inner Mongolia, four dietary patterns were identified: ‘meat/dairy products’, ‘traditional northern’, ‘high cereal/tuber’ and ‘high-salt/alcohol’. These dietary patterns accounted for 27·754 % of the variability in the original dietary variables. And in other studies, the explicable variability for diet by dietary pattern ranged from 18·6 to 31·7 %(Reference Link, Canchola and Bernstein29–Reference Williams, Prevost and Whichelow33). Our result was consistent with other studies and was even higher than some studies.
The relationship between dietary patterns and diabetes in participants showed that the ‘meat/dairy product’ pattern was negatively correlated with diabetes risk. This dietary pattern included dairy products, milk tea and tea, beef and mutton and fried wheat products. Evidence from another study showed that a higher intake of dairy products (e.g. milk, yogurt, cheese and whey protein) was beneficial for glucose regulation and reduced the risk of type 2 diabetes mellitus(Reference Comerford and Pasin34). Fan et al. (Reference Fan, Li and Wang35) showed that consuming 200 g/d of milk reduced the risk of diabetes by 9 %. Dairy products have abundant nutrient elements such as protein, minerals and fat(Reference Tunick and Hekken36). In our study, 13·4 % of the energy consumed by the participants following the ‘meat/dairy product’ pattern came from protein, which exceeds the recommended nutrient intake for Chinese residents(37). A study showed that higher protein intake from plants and certain animal foods helped reduce the risk of diabetes(Reference Comerford and Pasin34). A meta-analysis revealed that high-quality dietary fat was associated with a lower diabetes risk(Reference Merino, Guasch-Ferré and Ellervik38). Dairy fat contributed to the protective relationship between dairy product intake and type 2 diabetes, and high-fat dairy products were negatively correlated with diabetes incidence(Reference Ericson, Hellstrand and Brunkwall39). The median Ca intake of participants adhering to the ‘meat/dairy product’ pattern was 349·5 mg/d, which was lower than the recommended nutrient intake, but higher than that of the other three dietary patterns in Inner Mongolia. A cross-sectional analysis showed that Ca was associated with a lower prevalence of the metabolic syndrome and impaired fasting glycaemia and type 2 diabetes(Reference Fumeron, Lamri and Khalil40).
For ‘meat/dairy products’, rice was not a main food composition. Individuals adhering to this dietary pattern were more likely to eat less or no rice. The rice intake may have been decreased, which partly explains the beneficial effect of this dietary pattern on reducing diabetes risk. Some studies have shown that consuming more white rice was positively correlated with the risk of type 2 diabetes mellitus, especially in Asian countries(Reference Nanri, Mizoue and Noda41,Reference Villegas, Liu and Gao42) . This may be related to the milling process in which white rice loses many of the antidiabetic fibres, vitamins and minerals in the grain(Reference Slavin, Martini and Jacobs43,Reference Schulze, Schulz and Heidemann44) . White rice also has a higher glycaemic index(Reference Foster-Powell, Holt and Brand-Miller45), which may be why white rice carries a higher diabetes risk. Additionally, in our study, vegetable and fruit intakes were lower among residents adhering to the ‘meat/dairy product’ pattern than that suggested by recommended nutrient intake. Research has suggested that increasing vegetable and fruit consumption helps with weight loss, which might indirectly reduce the type 2 diabetes mellitus incidence(Reference Rolls, Ello-Martin and Tohill46); however, some meta-analyses found no relationship between fruit and/or vegetable consumption and diabetes risk(Reference Hamer and Chida47,Reference Carter, Gray and Troughton48) . Huang et al. (Reference Huang, Lu and Xu49) showed that fruits with a moderate or high glycaemic index were positively associated with the occurrence of gestational diabetes mellitus. Therefore, consuming more fruits and vegetables may not help prevent diabetes. In our research, the ‘meat/dairy product’ pattern was negatively correlated with diabetes, possibly because fewer vegetables and fruits were consumed. However, this study was cross-sectional, and the relationship between vegetables and fruits and diabetes risk requires a long-term population intervention experiment.
Except for the ‘meat/dairy product’ pattern, our results showed no association between the other three dietary patterns and diabetes. Among them, the ‘traditional northern’ pattern was characterised by high potato, pork, pickled/dried vegetable, maize and dessert intake, which is similar to the typical traditional diet in northern China(Reference Wang, He and Li50). Characteristics of the ‘high cereal/tuber’ pattern were more vegetables, fresh fruits and aquatic products; thus, this dietary pattern is similar to the Dietary Approaches to Stop Hypertension diet but involved more cereals and meat, and the carbohydrate and Na intakes were higher than recommended. Excessive alcohol and salt intake characterised the ‘high-salt/alcohol’ pattern, in which oil and salt intake was higher than recommended, and the vegetable, egg and dairy product intakes were lower than recommended. Therefore, we found no evidence that these dietary patterns help reduce the risk of diabetes.
The relationship between dietary patterns and diabetes risk varies among populations with different dietary cultures in different regions and racial/ethnic groups(Reference Ma and Chan51,Reference Weng, Zhou and Guo52) . Inner Mongolia across the eastern, central and western regions of north China has a multiethnic culture, thus formed a unique dietary culture. Although some a priori methods can assess a population’s compliance with a specific dietary pattern, such as the Mediterranean and Dietary Approaches to Stop Hypertension and so on, but these high-quality diets included special foods and components such as olive oil and seafood. For geographical and climatic reasons, these types of foods are relatively lacking in Inner Mongolia. Thus, our study used the DBI-16 to assess the dietary quality in participants. The results showed that participants more adhered to the ‘meat/dairy product’ pattern, the dietary quality was relatively balanced. In our research, the relatively balanced dietary pattern was associated with a lower risk of diabetes, which was consistent with other study results(Reference Cheung, Chan and Ko53,Reference McNaughton, Dunstan and Ball54) .
Our study had some limitations. Using a cross-sectional study prevents drawing conclusions about causality between dietary patterns and diabetes prevalence. More cohort and randomised controlled trials are needed. Although we simultaneously adjusted for major sociodemographic characteristics and lifestyle factors, residual unknown or unmeasured confounding factors may have been present.
Conclusions
In summary, Inner Mongolia exhibited a moderate diabetes prevalence and four major dietary patterns were identified. Among them, the dietary quality of the ‘meat/dairy product’ pattern as evaluated via the DBI-16 was relatively balanced and was correlated with a decreased risk of diabetes prevalence. However, more prospective studies are needed to determine the relationship between dietary quality and diabetes in Inner Mongolia.
Acknowledgements
The authors wish to thank the study participants for their contribution to the research, as well as current and past investigators and staff.
This study was supported by National Natural Science Foundation of China (no. 81960603) (Study on the Mechanism of NAMPT Regulated by Hyperglycemia and CpnT Promoting Macrophage Death in Diabetes with Pulmonary Tuberculosis Infection) and Natural Science Foundation of Inner Mongolia (no. 2019MS08112) (Epidemiological Study on Obesity and Metabolic Abnormalities in Adults in Inner Mongolia). The funding sources had no role in the design, analysis or writing of this article.
The research idea was conceived by X. W., data processing and analysis were conducted by S. T., H. L., R. S., J. W., M. X., Y. Q. and W. W. and the manuscript was written by S. T. and H. L. All authors read and approved the final manuscript.
The authors declare that there are no conflicts of interest.
Availability of data and materials
The data that support the findings of this study are available from the National Institute for Chinese Center for Disease Control and Prevention but restrictions apply to the availability of these data, which were used under license for the current study, and so are not publicly available.


 Open access