


India is experiencing the ‘dual burden’ of both chronic widespread under-nutrition and the rapidly emerging problem of over-nutrition. Both are forms of malnutrition as is hidden hunger, related to consuming foods of poor nutritional quality and therefore not meeting requirements for vitamins and minerals in the diet. On the one hand in India, in urban as well as rural settings more than half of the children in ten out of fifteen states suffer from anaemia, and on the other hand, the prevalence of overweight/obesity has also increased(1). This nutritional situation is closely associated with the dietary patterns of Indian people. Analysis(Reference Shankar, Agrawal and Beaudreault2) of the last, 2012, National Nutrition Monitoring Bureau survey shows that Indians continue to consume cereal-based diets which are monotonous and lack micronutrient-rich foods. The scenario is more challenging for rural Indians as their diets are inadequate in diverse foods such as green leafy vegetables, dairy products, foods that are a good source of protein and vegetables containing β-carotene(Reference Shankar, Agrawal and Beaudreault2). Particularly for communities most in need, a tool to rapidly measure dietary diversity and to find out which foods and food groups are consumed or not consumed by individuals and groups within communities is essential to inform and target equitable actions. Dietary diversity scores (DDS) offer a quick and simple assessment of the macro and micronutrient adequacy of the diet. Many questionnaires for assessing DDS have been developed, but methodological differences in the classification and grouping of foods limit the comparability and generalisability of findings(Reference Ruel3) and only a few studies were validated with another measure of food intake.
Multiple efforts were made to improve and harmonise measurement approaches and indicators of DDS in children(Reference Kennedy, Ballard and Dop4,Reference Steyn, Nel and Labadarios5) , adolescents(Reference Mirmiran, Azadbakht and Esmaillzadeh6) and adults(Reference Foote, Murphy and Wilkens7). These culminated in 2013 when the UN FAO published guidelines and questionnaires to measure individual dietary diversity scores (IDDS) from nine food groups(8). A further refinement of a minimum dietary diversity score for women (MDD-W) from ten food groups(9) was published in 2016. The validity of DDS to assess nutritional adequacy measured by other dietary intake measures such as 24-h dietary recalls has little evidence and no reviews. Reports of small to moderate associations between micronutrient intake adequacy measured by 24-h dietary recalls and the nine FAO IDDS food groups are reported for children aged between 6 months and 12 years from China(Reference Zhao, Yu and Tan10), Philippines(Reference Kennedy, Pedro and Seghieri11), South Africa(Reference Steyn, Nel and Nantel12) Kenya(Reference Gewa, Murphy and Weiss13) and rural Bangladesh(Reference Arsenault, Yakes and Islam14) where children and their mothers were assessed. A cut-off MDD-W of 6 best predicted adequate micronutrient status (by food recall) in pregnant adolescent girls and women in Bangladesh(Reference Nguyen, Huybregts and Sanghvi15). A study conducted in three South African towns among women aged 15–49 years reported higher food security and MDD-W in urban locations than in peri-urban or rural ones(Reference Chakona and Shackleton16). To the best of our knowledge, only three studies with youth(Reference Nguyen, Huybregts and Sanghvi15–Reference Korkalo, Erkkola and Heinonen17) have used FAO scores and included adolescent girls aged 16–18 years. No studies were found including boys of this age. In addition, there were no reports from India. Most reports have calculated DDS based on diet composition analysis from either a 24-h dietary recalls or a FFQ, and the same measurements were used to derive the DDS to demonstrate relative validity; therefore, under-, over- and misreporting were not accounted for(Reference Castro-Quezada, Ruano-Rodriguez and Ribas-Barba18). The single study(Reference Korkalo, Erkkola and Heinonen17) that used four objective biomarkers of circulating Hb, ferritin, Zn and folate and the only finding was that in the hunger season there was an association of low MDD-W with low serum Zn. Globally and in India, there a high prevalence of deficiency of vitamin B12, folate and Hb, biomarkers of micronutrient status relevant for maternal and child health(Reference Gupta Bansal, Singh Toteja and Bhatia19–Reference Thomas, Chandra and Sharma21).
The Pune Maternal Nutrition Study (PMNS), a longitudinal birth cohort study initiated in 1993(Reference Rao, Yajnik and Kanade22,Reference Yajnik, Fall and Coyaji23) conducted in rural region of Maharashtra in India, provides an opportunity to objectively examine the validity of DDS to measure biomarkers. When the youth were aged 17 years, circulating concentrations of vitamin B12, folate and Hb were measured, and at the age of 18 years dietary intake was measured with a quantitative FFQ (150 foods) at 18 years before the youth were randomised to a controlled trial of vitamin B12 supplementation.
This analysis of the PMNS data aimed to investigate associations and validity of the consumption of food groups as defined by FAO DDS with nutrient intakes derived from the FFQ and vitamin B12, folate and Hb concentrations in youth living in a rural area of Pune, India.
Methods
Study design
The methodology of the longitudinal PMNS has been published previously(Reference Rao, Yajnik and Kanade22,Reference Ganpule, Yajnik and Fall24) . Briefly, the study was established between 1993 and 1995 in six rural villages (total population 35 000) near the city of Pune in the state of Maharashtra, to prospectively study the influence of maternal nutrition on growth and later cardio-metabolic risk of the offspring. Detailed measurements of offspring were undertaken at birth and at 6 years (2001–2003), 12 years (2006–2008), 17 years (2012–2014) and 18 years (2013–2015) in addition to regular body size measurements every 6 months. At the age of 17 years, between February 2012 and July 2012, 353 boys and 303 girls had blood samples drawn for Hb and plasma vitamin B12 and folate concentration measurements. At the age of 18 years, follow-up between April 2013 and September 2014, these youth completed FFQ and body size measurements at 18 years follow-up. These youth formed the sample for this study.
Ethics
Approval for the study was obtained from the village leaders, participants, their parents and the Ethics Committee of KEM Hospital Research Centre, Pune, India.
Anthropometry
At the age of 18 years, weight was measured to the nearest 0·1 kg using digital scales (Omron), and height was measured to the nearest 0·1 cm using a wall-mounted stadiometer (CMS Instruments Ltd). Anthropometric measures were recorded in duplicate and an average of both values used for analysis. Inter-observer variation studies were conducted to maintain quality; coefficients of variation for height and weight were <0·5 %. BMI was calculated as the ratio of weight to height (in metres) squared (kg/m2). Subjects were classified according to WHO BMI criteria(25,26) into underweight (<18·5 kg/m2), normal (18·5–24·9 kg/m2), overweight (25·0–29·9 kg/m2) and obese (>30·0 kg/m2). Stunting was defined as height for age less than minus two standard deviations of the WHO growth reference (boys <161·6 cm, girls <150·2 cm).
Dietary assessment
All youth with a trained nutritionist recorded the amount and frequency of consumption over the last 12 months of 150 commonly consumed food items in a locally validated(Reference Rao, Yajnik and Kanade22,Reference Rao27) FFQ. First, the frequency for each food was recorded as never, daily, weekly, monthly or yearly. Then, within that time interval, the number of times the food was consumed was asked. Finally, the quantity consumed in each eating occasion was recorded. A variety of two- and three-dimensional food models (bowls, spoons and roti sizes pre-calibrated for volume) were provided to assist the respondent to estimate the quantity of each food. The weight of each food item consumed was determined and divided by a time factor to determine daily intake, for example, once a month divided by 30 and once a week was divided by 7(Reference Rao, Yajnik and Kanade22). Foods were grouped as cereals, legumes, green leafy vegetables, other vegetables, fruits, milk and milk products, non-vegetarian foods, snacks, confectionery and beverages. Detailed information concerning ingredients and the recipes for local mixed dishes were recorded.
Determination of macro- and micronutrient intakes
Each food item was matched by a trained nutritionist to a food (line) in a combination of local(Reference Rao, Yajnik and Kanade22) and national food composition databases(Reference Longvah, Ananthan and Bhaskarachary28). The local food composition database was initiated in 1993 when macronutrient composition for cooked and commonly consumed food was measured in the Biometry and Nutrition department of the Agharkar Research Institute, Pune(Reference Rao, Yajnik and Kanade22). Proximate analysis of energy content was by Bomb calorimetry, protein by the Kjeldahl technique, fat by Soxlet and carbohydrate by difference. Vitamin B12 and folate content of foods were estimated using values from the national database with assumptions based on the predominant foods, ingredients and moisture gain or loss during cooking in each recipe.
Assessment of dietary diversity
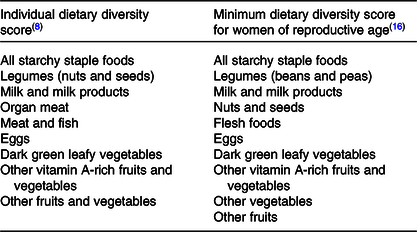
Foods were grouped according to characteristics and nutrient profile predetermined by the FAO for the IDDS as an indicator of dietary adequacy and the MDD-W as an indicator of micronutrient intake adequacy(8,9) (Table 1). For a food group to be counted in the dietary diversity analysis, the minimum average quantity was set at ≥5 g/d. Maximum score of the IDDS was 9 and for the MDD-W was 10.
Table 1. Comparison of food groupings utilised to determine dietary diversity scores
Adequacy of dietary intake for selected nutrients
Nutrient adequacy ratios for the intake of energy, protein, fat, Fe, vitamin B12 and folate were calculated by dividing the daily intake of the nutrient by the recommended daily intake for that nutrient according to the Indian Council of Medical Research guidelines(29) accounting for age, sex and activity(Reference Rao30). As a measure of overall micronutrient adequacy, mean adequacy ratio was calculated as the mean of the nutrient adequacy ratios for the intake of the micronutrients Fe, vitamin B12 and folate. For both nutrient adequacy ratio and mean adequacy ratio, a value of 1 is ideal, that is, the intake is the same as the requirement.
Biochemical measurement of circulating nutrients
Blood samples were collected into EDTA vacutainers. The haemogram was measured (Beckman Coulter, T540 and AC.T diff TM Analyzers). Within an hour of collection, the remaining blood was centrifuged (2500 g × 15 min), and the separated plasma was used for standard biochemical measurements. Aliquots were stored at –70°C until further analysis. Plasma vitamin B12 and folate were measured by microbial assays(Reference Kelleher, Walshe and Scott31,Reference Molloy and Scott32) . The inter- and intra-assay CV were <5 % for all measurements. At the age of 17 years, seven boys and seven girls with vitamin B12 concentrations above 400 pmol/l were not considered for analysis. Low plasma vitamin B12 was defined as <150 pmol/l vitamin B12, low plasma folate as <7 nmol/l(Reference De Benoist33,Reference Deshmukh, Katre and Yajnik34) and low Hb levels <130 g/l for boys and <120 g/l for girls(Reference De Benoist33).
Statistical analysis
All continuous data were examined for outliers and tested for normality. Variables with skewed distribution (vitamin B12 and folate concentrations) were transformed to the natural logarithm. Normally distributed variables are summarised as means and standard deviations. Continuous variables with skewed distributions are presented as medians and 25th and 75th centiles. Categorical variables are summarised as frequencies and proportions (percentages). Boys and girls were analysed separately. Binary logistic regression was used to study the association of lower and higher micronutrient concentrations at the age of 17 years (outcome variables) and DDS at the age of 18 years, sex, BMI, socio-economic status score and total daily energy intake at the age of 18 years. We also compared circulating vitamin B12 and Hb concentrations among youth consuming the three basic groups namely starchy staples, legumes and other vegetables plus, for example, dark green leafy vegetables or flesh foods by ANOVA. The statistical analysis was conducted using SPSS 22 (IBM).
Results
Blood measures at the age of 17 years and food frequency data at the age of 18 years were available for 355 boys and 303 girls. At the 18 years age of measurement point, boys were 6 months older, 10·6 kg heavier and 12·7 cm taller than girls (Table 2). Using WHO adult BMI criteria(26,35) , 25·6 % of boys and 21·1 % of girls (P for sex difference 0·174) were underweight, 7·6 % of boys and 4·3 % of girls (P = 0·077) were overweight and obese, and 10·7 % of boys and 11·8 % of girls (P = 0·655) were stunted. When we checked for micronutrient deficiencies, around half of the boys and girls had lower circulating vitamin B12 levels, 14 % of boys and remarkably high, that is, 30 % of girls were anaemic.
Table 2. Characteristics of participants at the age of 18 years
(Mean values and standard deviations; frequencies and percentages; differences and 95 % confidence intervals; medians and interquartile ranges (IQR))
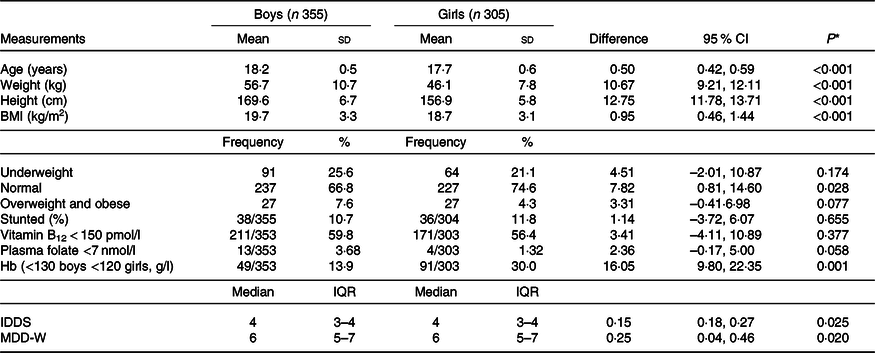
IDDS, individual dietary diversity scores; MDD-W, minimum dietary diversity scores for women.
* P values for differences between boys and girls, independent t test for continuous variables, χ 2 test for proportions.
The distributions of the summed number of IDDS dietary food groups consumed were similar for both boys and girls (median 4; interquartile range 3–4) while that for MDD-W was higher (P = 0·020) among boys than girls (median 6; interquartile range 5–7). Consumption of dairy foods and fruits was very low (Fig. 1). Some youth reported that they did not consume the protein-containing foods: legumes, milk and milk products, flesh foods and eggs, and boys consumed these foods substantially more often than girls. The typical meal of these rural Maharashtrian children consists of an Indian bread (made from wheat or jowar or bajra flour) along with a savoury side dish of other vegetables/leafy greens/sprouts and a savoury dal (pulses) with boiled rice.
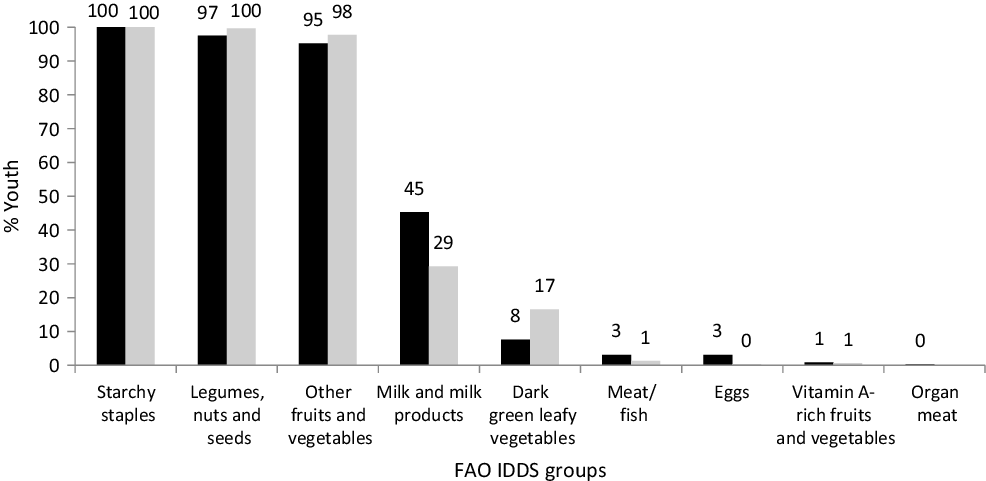
Fig. 1. Proportion of boys and girls consuming different dietary groups. Individual dietary diversity scores (IDDS) by FAO guidelines. ![]() , % Boys;
, % Boys; ![]() , % girls.
, % girls.
Dietary analysis of all foods consumed showed that a substantial proportion of both boys and girls had inadequate intakes of energy and protein (Table 3). These inadequacies were substantially higher for girls (53 % had inadequate energy and protein intakes) than boys (33 % had inadequate energy and 18 % had inadequate protein intakes). Also, more girls than boys had inadequate micronutrient intakes for Fe (49 v. 2 %) and vitamin B12 (81 v. 59 %). The nutrient adequacy ratio and mean adequacy ratio (r 0·66) were positively and significantly correlated with the IDDS as well as MDD-W among boys and girls.
Table 3. Daily nutrient intakes, nutrient adequacy ratio (NAR) and association with dietary diversity scores*
(Median values and 25th, 75th percentiles; mean values and standard deviations; Pearson r values and 95 % confidence intervals)
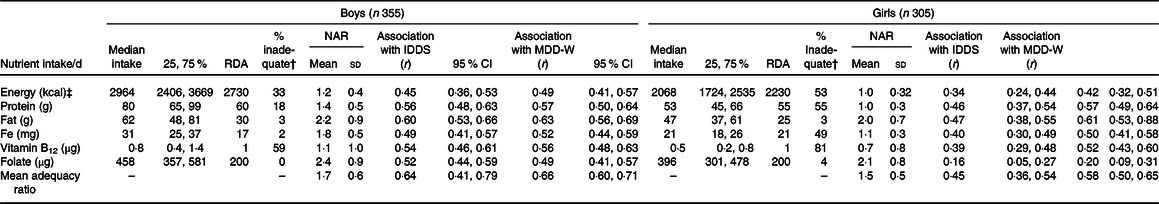
RDA, Recommended Dietary Allowances by Indian Council of Medical Research, 2010; IDDS, individual dietary diversity scores; MDD-W, minimum dietary diversity scores for women.
* P < 0·01 for all correlations. NAR is intake/recommended intake by the Indian Council for Medical Research 2010(29).
† % with inadequate intake than RDA by the Indian Council for Medical Research 2010.
‡ To convert energy values from kcal to kJ, multiply by 4·184.
Unadjusted and adjusted binary logistic regression was used to compare the OR for youth with and without micronutrient deficiency and consuming ≤4 IDDS food groups every day (Table 4). Youth with insufficient plasma vitamin B12 at the age of 17 years had almost two times higher (1·89; 95 % CI 1·24, 2·87; P = 0·001) likelihood of having IDDS ≤ 4. Similarly, youth with low Hb concentrations, <130 g/l for boys and <120 g/l for girls, had significantly higher likelihood of having IDDS ≤ 4 (Table 4). Circulating folate concentrations were not associated with IDDS. Youth with insufficient plasma vitamin B12 at the age of 17 years had higher chances of scoring MDD-W of 5 or less (1·40; 95 % CI 1·02, 1·94; P = 0·040) (results not shown in table). Circulating folate or Hb concentrations were not associated with MDD-W. All the associations remained unchanged when adjusted for socio-economic score, BMI and energy intake at the age of 18 years and sex of the child.
Table 4. Adjusted and unadjusted associations between risk factors and individual dietary diversity score (IDDS) less in 660 youth aged 18 years*
(Frequencies and percentages; odds ratios and 95 % confidence intervals)
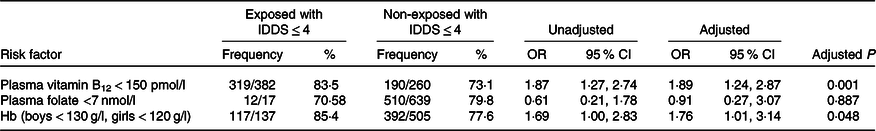
* All associations adjusted for socio-economic score, BMI at the age of 18 years, energy intake at the age of 18 years and sex.
We compared circulating vitamin B12 and Hb concentrations among participants who consumed different combinations of food groups. Youth with lowest circulating vitamin B12 and Hb concentrations consumed only starchy staples, legumes and other fruits and vegetables, that is, IDDS score of ≤3 (n 240), while those who had higher micronutrient levels additionally consumed flesh or eggs (n 51, 13F 38M) (difference in vitamin B12 –19·2 pmol/l 95 % CI –53·96, 15·59, P = 0·03; difference in Hb –7·0 g/l, 95 % CI –12·8, –1·2, P = 0·01). When separated by sex, these differences remained significant for boys but not in girls. Youth who consumed dark green leafy vegetables and milk or milk products but not flesh or eggs did not have significantly higher vitamin B12 or Hb values. This may be as overall proportion of youth consuming nutrient-rich food groups was low. The folate values did not differ by any combination of dietary diversity food groups.
On binomial regression analysis, youth with lower vitamin B12 concentrations at the age of 17 years had a one and half times higher chance of low consumption of milk products (1·66, 95 % CI 1·17, 2·35, P = 0·005) and three times higher chance that they had low consumption of any flesh and egg foods every day at the age of 18 years (3·02, 95 % CI 1·27, 7·19, P = 0·013) (results not shown). These results were adjusted for sex, BMI, height, energy intake and socio-economic status at the age of 18 years. Lower Hb and folate concentrations at the age of 17 years were not associated with consumption of specific food groups
Discussion
The key and novel finding of this retrospective analysis of prospective data provides evidence that the FAO DDS are valid predictors of vitamin B12 deficiency and anaemia in youth with a high prevalence of underweight and inadequate energy intakes. In addition, it highlights that the food groups like milk and milk products were only consumed by 45 % of boys and 29 % of girls. The lack of vitamin A-rich vegetables, dark green leafy vegetables, fruits, eggs and flesh foods in the diet highlights that these foods should be produced and consumed in adequate quantities to ensure improved dietary quality and food security. The second key finding is the sex inequity as girls consumed less micronutrient-rich foods and more foods from relatively cheaper dietary sources such as green leafy vegetables than boys. This sex difference in diet was paralleled with more underweight girls than boys. Consumption of any food group or combination of food groups was not associated with plasma folate concentration. This information is strategic for the assessment of the impact of agriculture and the food supply on nutritional status.
To our knowledge till now, the only study that reports associations between DDS and circulating biomarkers is the one conducted among adolescent Mozambican girls (14 to 19 years old)(Reference Korkalo, Erkkola and Heinonen17). This Mozambican study looked at associations between MDD-W with concentrations of Hb, serum ferritin, Zn and folate, and plasma retinol in both the hunger and the harvest season. They report that the only association found was where low serum Zn (the lowest 25 %) in the hunger season was best predicted by an MDD-W ≤ 3 derived from a 24-h dietary recalls and ≤5 from a 7-d FFQ. In our study, IDDS cut-off of ≤4 FAO food groups was associated with a high prevalence of insufficient circulating micronutrient levels of vitamin B12 and Hb.
Many studies(Reference Verger, Ballard and Dop36) have measured DDS as a measure of adequate dietary intakes; however, very few have followed the FAO guidelines to calculate the DDS making it difficult for comparison. The studies we found did not directly ask the diversity questions, but like Mozambican study utilised other dietary assessment tools and variably adapted criteria to determine the count of food groups. For example, both the studies from Kenya(Reference Gewa, Murphy and Weiss13) and from rural Bangladesh(Reference Arsenault, Yakes and Islam14) among schoolchildren reported that the number of food groups counted for the DDS based on a minimum of 15 g/d was better associated with nutrient adequacy than the count of food groups with no requirement for a minimum quantity. A study from Nepal(Reference Henjum, Torheim and Thorne-Lyman37) determined the IDDS score for eight food groups (organ meat was included with meat and fish) averaged over 3 d for 500 lactating women (17–44 years) residing in a peri-urban area with a miniumum of 15 g/d. They reported that the IDDS (mean 3·9 (sd 1·0)) was associated with multiple micronutrient intakes below the estimated average requirements.
Our finding of low DDS agrees with other studies with children from China(Reference Zhao, Yu and Tan10), Philippines(Reference Kennedy, Pedro and Seghieri11) and South Africa(Reference Steyn, Nel and Nantel12), and among pregnant adolescent girls and adult women from rural Bangladesh(Reference Arsenault, Yakes and Islam14) which report DDS of less than five groups. We report similar findings among rural Indian youth as the IDDS were lower than five food groups among two-thirds of youth and MDD-W less than six groups among more than one-third. Similar to the present study, diet in these developing countries has limited diversity with a predominance of starchy staples and infrequent and relatively small amounts of flesh foods, dairy products and vitamin A-rich vegetables.
Previous studies comparing adequacy of micronutrient intakes among pregnant adolescent girls and women in Bangladesh(Reference Nguyen, Huybregts and Sanghvi15) observed when six rather than five food groups every day was used as the cut-off, there was better sensitivity to classify micronutrient intake inadequacies including riboflavin, vitamin B12, Ca, Zn and folate. We not only reported association of DDS with circulating micronutrients but also studied association of consumption with specific food groups. In our study, consumption of foods from nutrient-rich food groups like flesh foods, eggs and milk was associated with higher circulating micronutrient concentrations of vitamin B12 and Hb and folate was not associated.
Though the median DDS was similar between sexes, there were marked differences in the fourth food group consumed by the adolescent boys and girls. Girls consumed foods from cheaper sources as green leafy vegetables, while boys consumed pricier food sources as meat and eggs. This is similar to that reported by Aurino(Reference Aurino38) who report, from two longitudinal studies in Andhra Pradesh and Telangana, that the pro-boy gap in diet diversity widens at 15 years of age when appetites increase and boys are rapidly growing. These authors did not measure diversity scores. Food allocation especially among south Asian countries including India favours men and boys who often receive greater quantities of higher quality, nutritious food such as dairy products(Reference Bhate, Joshi and Ladkat39–Reference Miller41). It is important to consider sex and food allocation issues while planning nutritional policies in south Asian countries to achieve the Sustainable Development Goals 2020 with a particular focus on zero hunger and sex equality(42). DDS have been understudied in Indian settings, and this is the first to our knowledge in a rural setting with a birth cohort.
Strengths and limitations
One strength of this study is that both girls and boys were assessed and that the age of 17–18 years is an important stage of growth and development. Soon, these youths, especially the girls, will be parents, and to help break the intergenerational cycle of malnutrition, intervention should be before parenthood(Reference Gluckman, Hanson and Low43). The IDDS(8) as well as MDD-W(9) guidelines by FAO provide questions that determine if any foods from each of the nine/ten food groups were consumed in the last 24 h and the minimum quantity of at least 10 g/d. This is when a 24 HDR is used. Our dietary assessment method was a 150-item 12-month FFQ so is not directly comparable with other studies(Reference Nguyen, Huybregts and Sanghvi15,Reference Chakona and Shackleton16,Reference Castro-Quezada, Ruano-Rodriguez and Ribas-Barba18) . We used the minimum quantity of an average of 5 g/d rather than the 10 g suggested by the FAO because of the large number (150) of food items in the FFQ and the small portions consumed and the relatively small body mass of the youth (about 50 % underweight).
One limitation is that the measure of circulating nutrients was undertaken at the age of 17 years of age, while the DDS were based on dietary records at the age of 18 years when a number of the youths were moving from the rural farm to the urban college environment, but some had been randomised to receive dietary supplementation which meant that a measure of circulating biomarkers would be affected and the allocation to treatment could not be broken for this report. However, we have shown previously that food patterns track over time(Reference Rush, Paterson and Obolonkin44,Reference Savila, Obolonkin and Rush45) and are intergenerational(Reference Bhate, Joshi and Ladkat39). We have presented content validity in that we find the expected association of DDS and micronutrient intakes when determined by the same instrument. However, the real strength of our study is the internal validity of the associations of the DDS with objective measures of vitamin B12 and Hb which to the best of our knowledge has not been reported in youth or a rural population before.
The way ahead and conclusion
Considering food variety and geographical, cultural, sex difference and socio-economic limitations that influence the variation in the dietary patterns and diversity, we need more population-specific studies. These studies are needed to use an objective, separate measure of DDS rather than comparing DDS and intakes calculated using the same questionnaire. More studies using the conventional FAO guidelines need to be conducted in wide age and physiological groups such as among pregnancy, during lactation and separately among both sexes to check the suitability of the DDS as a tool to measure nutrient inadequacy and inform and measure the effectiveness of changes in policy and action. Such studies will be helpful for agricultural and nutritional programmes and policymakers to quickly reach those most in need.
Acknowledgements
The inputs of Dr Shobha Rao with the quality assurance of the nutritional data cleaning and analysis are appreciated. The authors are grateful to the PMNS participants for taking part in this study. The authors thank Dr K. J. Coyaji, Director of the KEM Hospital, Pune, and Dr Laila Garda Director, KEMHRC, for providing research facilities. The authors thank the social workers, coordinators and PMNS team for their invaluable contribution to the study.
A. G.-R. was supported by a research fellowship from Tufts University, funded by UKAid through its programme on Innovative Methods and Metrics for Agriculture and Nutrition Actions (IMMANA).
A. G.-R. devised the IMMANA postdoctoral fellowship project under the mentorship of Elaine Rush and C. S. Y.; PMNS data were provided by C. S. Y.; A. G.-R. and E. R. conceived of the main conceptual ideas and worked on the drafts, and A. G.-R. performed the statistical analysis. A. G.-R. with E. R. wrote the manuscript. D. B. did the circulating micronutrient measurements and the writing of the Methods section. C. S. Y. as leader of the PMNS longitudinal study data kept a check on the integrity of the findings. All authors approved the final draft.
None of the authors had any financial or personal conflicts of interest associated with this manuscript and research.


