


Lifestyle factors such as diet may play a role in breast cancer prognosis. The World Cancer Research Fund (WCRF) has suggested that consuming foods with fibre and soya and having a lower intake of fat, particularly SFA, may improve breast cancer survival. However, the evidence is too limited to justify making specific recommendations(1). The WCRF recommends that cancer survivors, in general, follow recommendations for cancer prevention(2,3) . This includes maintaining a healthy weight, being physically active, having a healthy diet with more grains, fruits, vegetables and beans, limiting the intake of salt, red and processed meat and avoiding alcohol and high-energy and sugary foods and drinks. Importantly, these lifestyle recommendations are in line with the American Society of Clinical Oncology Breast Cancer Survivorship Care Guideline(Reference Runowicz, Leach and Henry4) and the general Norwegian dietary guidelines(5).
Previous studies have demonstrated that between 30 and 60 % of breast cancer patients report that they changed their diet after being diagnosed with breast cancer(Reference Maunsell, Drolet and Brisson6–Reference Shaharudin, Sulaiman and Shahril10). Reasons for making dietary changes include: to follow health care professionals’ advice; to diminish symptoms related to adjuvant treatment and a desire to cure the disease(Reference Salminen, Lagstrom and Heikkila7,Reference Shaharudin, Sulaiman and Shahril10) . Self-reported dietary changes after being diagnosed with breast cancer have often been reported as healthy changes in line with the WCRF recommendations(Reference Maunsell, Drolet and Brisson6–Reference Salminen, Bishop and Poussa9,Reference Thomson, Flatt and Rock11) . However, a limitation in many of the studies reporting healthy changes is that they have often used only simple questionnaires assessing dietary changes that ask for increased, decreased or no change in intake of given food groups(Reference Maunsell, Drolet and Brisson6–Reference Salminen, Bishop and Poussa9). Studies providing detailed quantitative information on dietary changes, using repeated dietary assessments, have shown inconsistent results; healthier dietary changes, changes in an unfavourable direction and no changes in diet have been reported(Reference Velentzis, Keshtgar and Woodside12–Reference Lei, Ho and Cheng17).
The main aim of the present study was therefore to study dietary changes among breast cancer patients from 12 months pre-surgery before any treatment, and over the 12 months post-surgery with a focus on nutrients and food groups highlighted in the recommendations for cancer prevention by WCRF. Two different dietary assessment methods were used: repeated 7-d pre-coded food diaries providing data on specific days to assess dietary changes over the 12 months post-surgery and repeated FFQ providing data on usual diet to study dietary changes from 12 months pre-surgery to 12 months post-surgery. Furthermore, we compared dietary changes between those who answered yes and those who answered no to the following question: ‘Have you made any significant changes to your dietary habits in the last year?’.
Material and methods
Study population and design
Women aged between 18 and 75 years were invited to participate in a clinical study from January 2011 to October 2017 at the Cancer Centre, Oslo University Hospital, Oslo, Vestre Viken, Drammen and St Olav University Hospital, Trondheim, Norway. The women in the present study were newly diagnosed (histologically verified) with invasive breast cancer (TNM stages I and II). Women with ductal carcinoma in situ and pleomorphic lobular carcinoma in situ, known severe illnesses (i.e. severe heart disease, dysregulated diabetes), incapable to write and understand the Norwegian language or being physically active were excluded. All patients were receiving standard care of treatment(18), and general advice related to dietary intake was given – to exclude the intake of supplements during chemo- or radiotherapy and having a diet in line with the Norwegian dietary guidelines(5).
A total of 589 women were invited to participate, and 506 breast cancer patients (stage I or II) had dietary data available at a minimum of one time point, measured using at least one dietary assessment method (food diary or FFQ) with 504 having at least one food diary and 491 having at least one FFQ (Fig. 1).
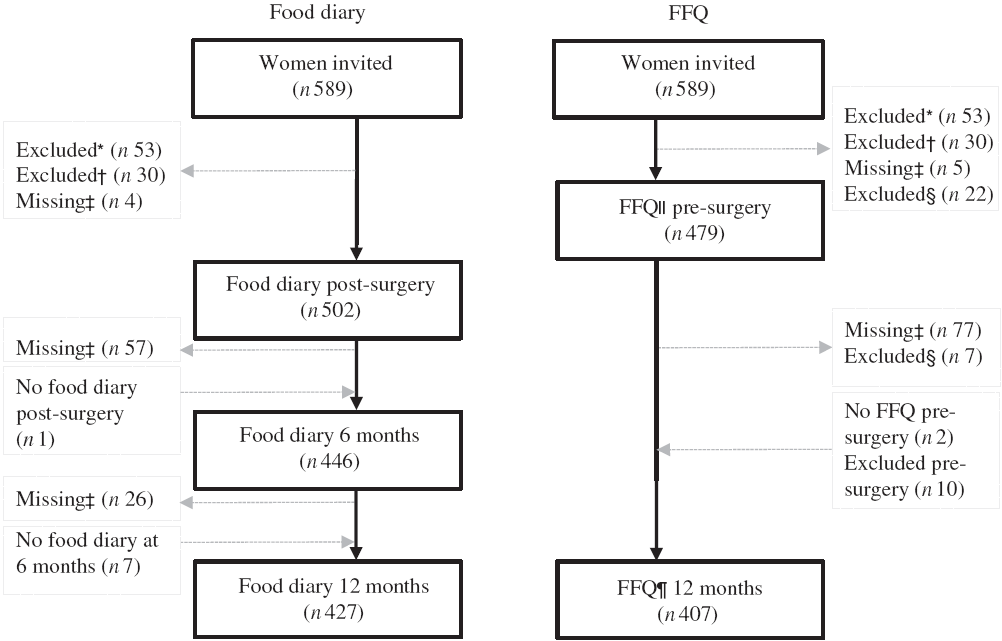
Fig. 1. Flow chart of the present study. * Excluded due to not meeting inclusion criteria. † Excluded due to diagnosed with ductal carcinoma in situ, not breast cancer. ‡ Missing due to surgery (resection), other (i.e. related to side effects of treatment, family setting, time). § Excluded due to energy intake >14 700 kJ/d. ‖ FFQ asked for the usual diet the 12 months before diagnosis, filled in 2–8 d pre-surgery and before any treatment. ¶ FFQ asked for the last month’s diet at 12 months post-surgery. The food diary was filled in for 7 consecutive days within 3 weeks post-surgery (before any other treatment), at 6 months and 12 months post-surgery.
Tumour characteristics
All breast cancer surgical specimens were histologically and immunohistochemically examined. The tumours were classified according to invasive histological type: no special type, lobular and others, and histological grade (1–3). The axillary lymph nodes were examined to detect macro- or micro-metastases using a sentinel lymph node biopsy technique for identifying axillary metastasis. The tumours were routinely investigated with immunohistochemistry for selected markers: oestrogen receptor (ER), progesterone receptor (PgR), human epidermal growth factor 2 (HER2) and tumour cell proliferation (Ki67 hotspot index). ER-positive status was defined as ≥1 % ER-expressing tumour cells and PgR-positive status as ≥10 % PgR-expressing tumour cells. HER2 immunohistochemistry equivocal cases (2+) were examined with HER2 Dual SISH in situ hybridisation to detect gene amplification. The ER-negative, PgR-negative and HER2-negative tumours were aggregated to the molecular subtype triple negative breast cancer. The percentage expression of Ki67-positive tumour cells was determined according to national and international guidelines(18,Reference Dowsett, Nielsen and A’Hern19) . Further details about the assessment of tumour characteristics in the present study can be found elsewhere(Reference Flote, Vettukattil and Bathen20).
Dietary assessment: pre-coded food diary and FFQ
Two different dietary assessment methods were used to measure dietary intake in order to capture both the period 12 months post-surgery (food diary) and the period from 12 months pre-surgery to 12 months post-surgery (FFQ). The patients registered all food and drink consumed in a pre-coded food diary developed by the Department of Nutrition, Institute of Basic Medical Sciences, University of Oslo, Norway. Patients completed the food diaries daily for seven consecutive days within 3 weeks post-surgery (before any other treatment), 6 months post-surgery and 12 months post-surgery (i.e. 3 × 7 d). More than 98 % of the food diaries filled in by the patients had a complete set of 7 d, none had fewer than 4 d and all were included in the analyses. The food diary is nineteen pages long, includes 310 questions on the consumption of different food items and has previously been described in detail(Reference Brunvoll, Thune and Frydenberg21). Household units and photos from a validated photo booklet were used to estimate amounts of specific items consumed(Reference Lillegaard, Overby and Cersen22). In addition, throughout the food diary, there are open text fields where food items not covered in the pre-coded part can be described.
An FFQ, also developed by the Department of Nutrition, Institute of Basic Medical Sciences, University of Oslo, was used to gather data on the usual diet. Pre-surgery and before any treatment, the FFQ asked for the usual diet over the 12 months before breast cancer diagnosis. At 12 months post-surgery, the FFQ asked for the diet in the last month. The two FFQ are identical but covered different time periods. The FFQ is fourteen pages long, includes 256 questions about food items and has previously been described in detail(Reference Brunvoll, Thune and Frydenberg21). The FFQ also included the question ‘Have you made any significant changes to your dietary habits in the last year?’. At 12 months, we stratified by ‘yes’ or ‘no’, to see if dietary changes differed between those who claimed dietary changes and those who claimed no changes. FFQ with energy intake <2100 kJ/d (n 0) and >14 700 kJ/d (n 29) were excluded (see Fig. 1)(Reference Willett23). Height and weight were self-reported in the FFQ, and BMI (kg/m2) was calculated.
Dietary information was obtained by self-report, but trained personnel manually checked all food diaries and FFQ. In case of inconsistencies or missing information, the patients were contacted by phone and missing information was obtained. The completed food diaries and FFQ were scanned using the Cardiff TeleForm programme version 10.5.1 (Datascan). Food and nutrient calculations were made using the food database AE-14 and the KBS calculation software system (Kostberegningssystem) at the Department of Nutrition, Institute of Basic Medical Sciences, University of Oslo. The food database AE-14 is based on the Norwegian food composition tables from 2014 and 2015(24), supplemented with data from calculated recipes and other databases.
Both dietary assessment methods have been validated in various groups of the Norwegian population(Reference Andersen, Tomten and Haggarty25–Reference Andersen, Pollestad and Jacobs34) including in a pilot study of the present clinical study (the first included patients)(Reference Brunvoll, Thune and Frydenberg21).
Food categories and nutrients
The food categories and nutrients that we focused on in this study are among highlighted categories/nutrients in the WCRF Cancer Prevention Recommendations, the Continuous Updating Project report for Breast Cancer prevention and/or the Continuous Updating Project report for Breast Cancer Survivors(1–3,35) . The category fruit, berries and juice included all fresh fruit and berries as well as fruit juices/smoothies. Fruit and berries comprised approximately 70 % of this category, while juice comprised 30 %. The category vegetables included all fresh and frozen vegetables, consumed raw or cooked. All meats (red and white) that were salted, cured, smoked, fermented or put through other processes to improve preservation or flavour were classified as processed meat. The category included sausages, cold cuts and pates for sandwiches, minced meat and products made out of minced meat such as meatballs. In total, 88 and 84 % of the processed meat were reported as cooked meat, measured by the food diary and the FFQ, respectively. The category red meat (unprocessed) included all red meat such as beef, veal, mutton, lamb and pork. In total, 65 and 86 % of red meat were reported as cooked meat measured by the food diary and the FFQ, respectively. Dairy products included all milk, yogurt, cheese and cream-based products (all cream, ice cream, sour cream, cream-based puddings and porridge). The intake of dietary supplements (yes/no) was also studied, where supplements with vitamins, minerals, trace elements and/or n-3 fatty acids were included. In addition to the food groups mentioned, total energy intake, energy percentage (E%) from carbohydrates, sugar, protein, fat and SFA, as well as intake of alcohol and fibre in grams, were assessed.
Statistical analyses
Descriptive statistics, including age, anthropometric measurements (weight and height were self-reported), education, tumour characteristics and adjuvant treatment, are presented as either means and standard deviations, or as percentages. Linear mixed models, which take into account any missing data at any time point, were used to estimate dietary intake and changes. Patients were included in the analyses if they had dietary data available for at least one time point from either or both of the dietary assessment methods. Separate analyses were run for dietary changes measured using the food diary and the FFQ. Sensitivity analyses were also performed examining dietary intake and changes among those with complete dietary data, and the results were approximately the same as when including data from all patients. The final mixed models were fitted, taking into account repeated measures within the individual over time (patient ID and time as random effects). Age, BMI and time were the only covariates (fixed effects) included in the final models. To avoid making too strong assumptions on the structure of the data, an unstructured covariance matrix for the random effects was used. In a few situations, an independent covariance matrix was used to avoid numerical non-convergence during estimation of the models. We performed stratified analyses by lymph node-positive (stage II) v. lymph node-negative disease (stage I) for the intake and changes in intake of macronutrients, in order to study whether patients with more aggressive disease changed their diet differently than women diagnosed with less aggressive disease.
Dietary changes from 3 weeks post-surgery to 6 months post-surgery (food diary) and changes from pre-surgery (FFQ) and 3 weeks post-surgery (food diary) to 12 months post-surgery (FFQ and food diary) were studied (see Fig. 1). Furthermore, we examined the percentage of patients who changed their intake of food groups (fruit, berries and juice; vegetables; dairy products; and red and processed meat) from the first quartile to the fourth quartile and from the fourth quartile to the first quartile (from low to high/high to low intake combined). In addition, differences in change over time were assessed between the patients who claimed that they changed their diet v. those who claimed that they did not change. Binary outcomes (intake of dietary supplements) were assessed using a logistic mixed model. Estimated marginal means were calculated for all dietary variables 3 weeks post-surgery for food diary and pre-surgery for FFQ, and plots of the estimated margins with 95 % CI were created to visualise the intake over time for those who claimed dietary changes and those who claimed no changes. Primarily, we present change in intake as E% from each nutrient and change in intake in grams is presented only if intake in E% changed significantly. An exception is for the intake of fibre and alcohol, which are presented in g/d. If there was a change in intake of alcohol in grams, we also presented the change in E%. If there was a change in intake of fibre in grams, we did the analysis with energy intake included as a continuous variable and also presented the energy-adjusted change. A significance criterion of P < 0·05 was used. However, most importantly, the statistical significant changes were considered according to the actual size and relevance of the changes. All statistical analyses were performed with the statistical software package Stata SE version 15.1 (StataCorp LLC).
Ethical considerations
All patients signed an informed consent form. All procedures were approved by the Norwegian Regional Committee for Medical Research Ethics (REK 2011/500 and 2014/945) and carried out according to the guidelines in the Declaration of Helsinki. All data are unidentified, and the results are presented as aggregated measures at the group level and the study is registered in the clinical trial database (ClinicalTrials.gov, identifier NCT02240836).
Results
In the present study among women diagnosed with stage I or II breast cancer, patients were on average aged 55·3 years at diagnosis with a mean BMI of 25·5 kg/m2. The breast tumours were, on average, 17·1 mm, 87·9 % of tumours were ER positive and 68·9 % PgR positive. All patients underwent surgery with 73·1 % receiving breast-conserving surgery, 57·6 % of the patients received chemotherapy, 61·0 % endocrine therapy and 82·5 % radiotherapy (Table 1). Overall, estimated mean BMI (adjusted for age) at 12 months post-surgery was not statistically different from the BMI pre-surgery (details not shown). Also, there were no differences in BMI and age, or change in BMI, between the patients who claimed to have changed their diet and those who claimed no changes. Dietary intake and changes were examined using two different dietary assessment methods, that is, a food diary to examine dietary changes during the 12 months post-surgery and an FFQ to examine dietary changes from 12 months pre-surgery to 12 months post-surgery.
Table 1. Descriptive statistics of the breast cancer patients (stage I or II) at diagnosis (n 506)*(Mean values and standard deviations; percentages)
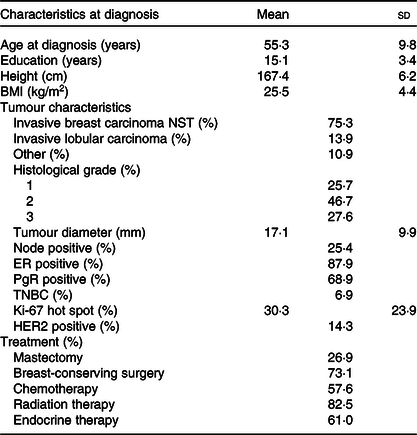
NST, no special type; ER, oestrogen receptor; PgR, progesterone receptor; TNBC, triple negative breast cancer; HER2, human epidermal growth factor receptor 2.
* Numbers may vary due to missing information.
Food diary, dietary changes
Dietary intake and changes in intake measured with the food diary are presented in Table 2. In general, the intake did not change much and the changes that were reported mostly appeared from 3 weeks post-surgery to 6 months post-surgery, including a 0·3 MJ/d (P = 0·001) decrease in total energy intake. Only the intake of E% from carbohydrates (increase) and fat (decrease) changed significantly from 3 weeks post-surgery to both 6 and 12 months post-surgery. The dietary intake of alcohol was 1·9 g/d (P < 0·001) lower at 6 months post-surgery than 3 weeks post-surgery, but there was no significant change to 12 months post-surgery. In total, 79 % consumed alcohol 3 weeks and 6 months post-surgery and 84 % at 12 months post-surgery. Of the consumers, 60, 52 and 54 % consumed more than 10 g alcohol/d 3 weeks post-surgery, 6 and 12 months post-surgery, respectively. The dietary intake and changes in intake of macronutrients among women with stage I v. stage II breast cancer were similar.
Table 2. Estimated dietary intake per d 3 weeks post-surgery and change in intake to 6 and 12 months post-surgery measured by the pre-coded food diary (n 504) (Mean values and 95 % confidence intervals; numbers and percentages)
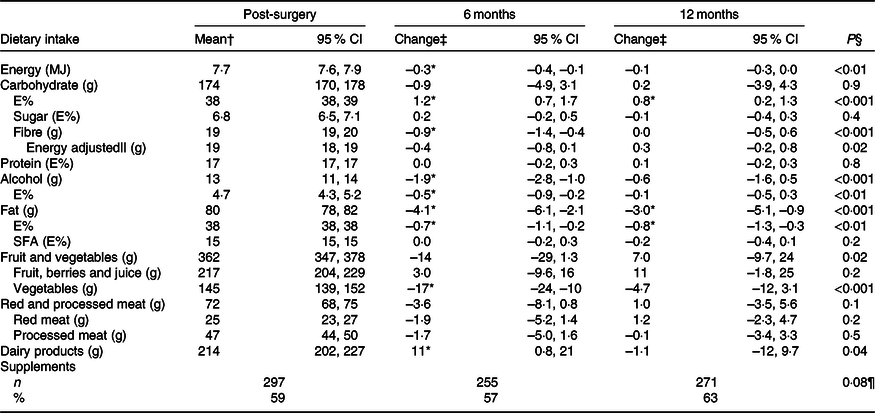
E%, percentage energy from nutrient; Post-surgery, within 3 weeks post-surgery; 6 months, 6 months post-surgery; 12 months, 12 months post-surgery.
* Significant change from 3 weeks post-surgery (P < 0·05).
† Estimated mean and 95 % CI intake adjusted for age and BMI (pre-surgery) in a linear mixed model. For supplements, n and % taking supplements.
‡ Change and 95 % CI from mean intake 3 weeks post-surgery adjusted for age and BMI (pre-surgery) in a linear mixed model. For supplements, n and % taking supplements.
§ Test for change over time (as a continuous variable) in a linear mixed model.
|| Adjusted for energy intake, total energy intake included in the linear mixed model.
¶ Test for change over time (as a continuous variable) in a logistic mixed model.
The intake of most food groups did not change over time. Furthermore, examining the percentage of patients who changed their intake from first to fourth quartile or from fourth to first quartile, it ranged from 1 % for dairy products to 7 % for red and processed meat, both measured from 3 weeks post-surgery to 12 months post-surgery (details not shown). Nevertheless, a few minor mean changes were observed (Table 2). The intake of vegetables was lower (–17 g/d, P < 0·001), whereas the intake of dairy products was slightly higher (11 g/d, P = 0·04) at 6 months post-surgery than 3 weeks post-surgery. Around 3 weeks post-surgery, approximately half of the dairy consumption was milk, 19 % yogurt, 20 % cheese and 15 % cream-based products, and the distribution was similar at both 6 and 12 months post-surgery. There were no changes in the intake of either fruit, berries and juice, or red and processed meat. Of the meat consumed 3 weeks post-surgery, 65 % was processed meat, the largest sources being minced meat products (38 %), sausages (26 %) and cold cuts and pates (26 %), and a similar distribution was observed at 6 and 12 months post-surgery. In total, 59, 57 and 63 % of the participants were taking dietary supplements 3 weeks post-surgery, at 6 and 12 months post-surgery, respectively. The odds of taking supplements did not change over time.
FFQ, dietary changes
In general, the diet measured with the FFQ was quite stable from 12 months pre-surgery to 12 months post-surgery (Table 3). However, a few small changes were observed, such as the intake of energy which was reported 0·4 MJ/d lower (P < 0·001) at 12 months post-surgery than pre-surgery. The intake of carbohydrates was higher (1·0 E%, P < 0·001), and the intake of protein, fat and SFA was lower (0·2 E%, P = 0·02, 0·6 E%, P = 0·02 and 0·2 E%, P = 0·05, respectively) at 12 months post-surgery compared with pre-surgery. In addition, the intake of alcohol decreased with 1·5 g/d (P < 0·001) to 12 months post-surgery. In total, 91 % of the women reported any intake of alcohol both pre-surgery and at 12 months post-surgery. Among the consumers of alcohol, 46 and 37 % consumed more than 10 g alcohol/d pre-surgery and 12 months post-surgery, respectively. The dietary intake and changes in intake of macronutrients among women with stage I v. stage II breast cancer were similar.
Table 3. Estimated dietary intake per d pre-surgery and change in intake to 12 months post-surgery measured by the FFQ (n 491) (Mean values and 95 % confidence intervals; numbers and percentages)
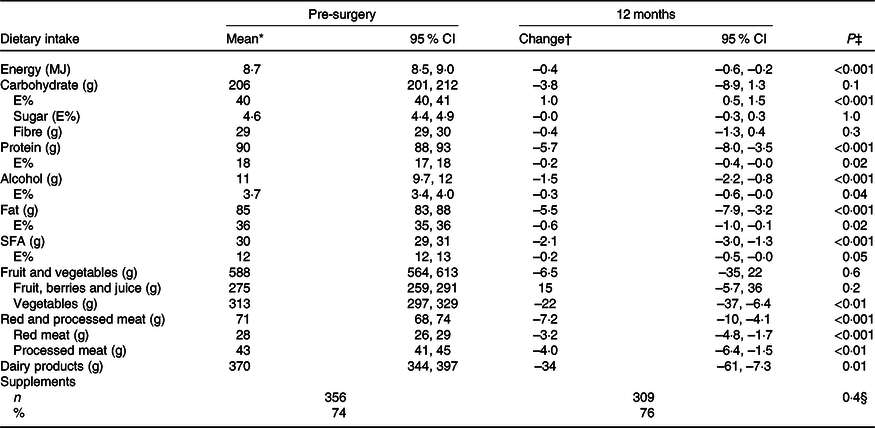
E%, percentage energy from nutrient; Pre-surgery, 12 months before diagnosis; 12 months, 12 months post-surgery.
* Estimated mean and 95 % CI intake adjusted for age and BMI (pre-surgery) in a linear mixed model. For supplements, % (n) taking supplements.
† Change and 95 % CI from mean intake pre-surgery adjusted for age and BMI (pre-surgery) in a linear mixed model. For supplements, n and % taking supplements.
‡ Test for change over time (from pre-surgery to 12 months) in a linear mixed model.
§ Test for change over time (from pre-surgery to 12 months) in a logistic mixed model.
There were only small changes in the intake of different food groups (Table 3). The intake of vegetables, red and processed meat, and dairy products was lower (–22 g/d, P = 0·006, –7·2 g/d, P < 0·001 and –34 g/d, P = 0·01, respectively) 12 months post-surgery than pre-surgery. In addition, the percentage of patients changing their intake from first to fourth quartile or from fourth to first quartile was ≤3 % for all the food groups (details not shown).
Have you made any significant changes in your dietary habits in the last year?
Twelve months post-surgery, 24 % (n 98/412) answered ‘yes’ to have made changes in their dietary habits the last year. Comparing those who said ‘yes’ to dietary changes with those who claimed ‘no’ dietary changes, there were no differences in change in dietary intake measured with the food diary or the FFQ, with a few exceptions (see online Supplementary file 1 and 2 for details).
For the food diary, there was a minor difference in the change in intake of fibre at 2·4 g/d (95 % CI 1·0, 3·7, P < 0·001) from 3 weeks post-surgery to 12 months post-surgery, where those who claimed dietary changes increased (P = 0·002) their intake, whereas there was no significant change among those who claimed no changes (Fig. 2(a)). Furthermore, there was a 2·4 g/d (95 % CI –4·6, –0·1, P = 0·04) difference in the change in intake of alcohol to 6 months post-surgery. Those who claimed dietary changes decreased (P = 0·001) their intake from 11 g/d (95 % CI 8·3, 13) to 7·4 g/d (95 % CI 5·0, 9·8) v. a non-significant change from 13 g/d (95 % CI 11, 14) to 12 g/d (95 % CI 10, 13, see Fig. 2(b)) for those who claimed no dietary changes. However, when the change in alcohol intake was calculated as E%, there was no difference between the strata. Lastly, for the food diary, there was a difference in the change (P = 0·001) in intake of vegetables from 3 weeks post-surgery to 12 months post-surgery (Fig. 2(c)). Those who claimed no dietary changes consumed 145 g/d (95 % CI 136, 153) of vegetables 3 weeks post-surgery and decreased their intake by 12 g/d (95 % CI –21, –2·7, P = 0·01) to 12 months post-surgery. Those who claimed dietary changes consumed 147 g/d (95 % CI 132, 161) of vegetables 3 weeks post-surgery and increased their intake by 20 g/d (95 % CI 3·7, 36, P = 0·02) to 12 months post-surgery.
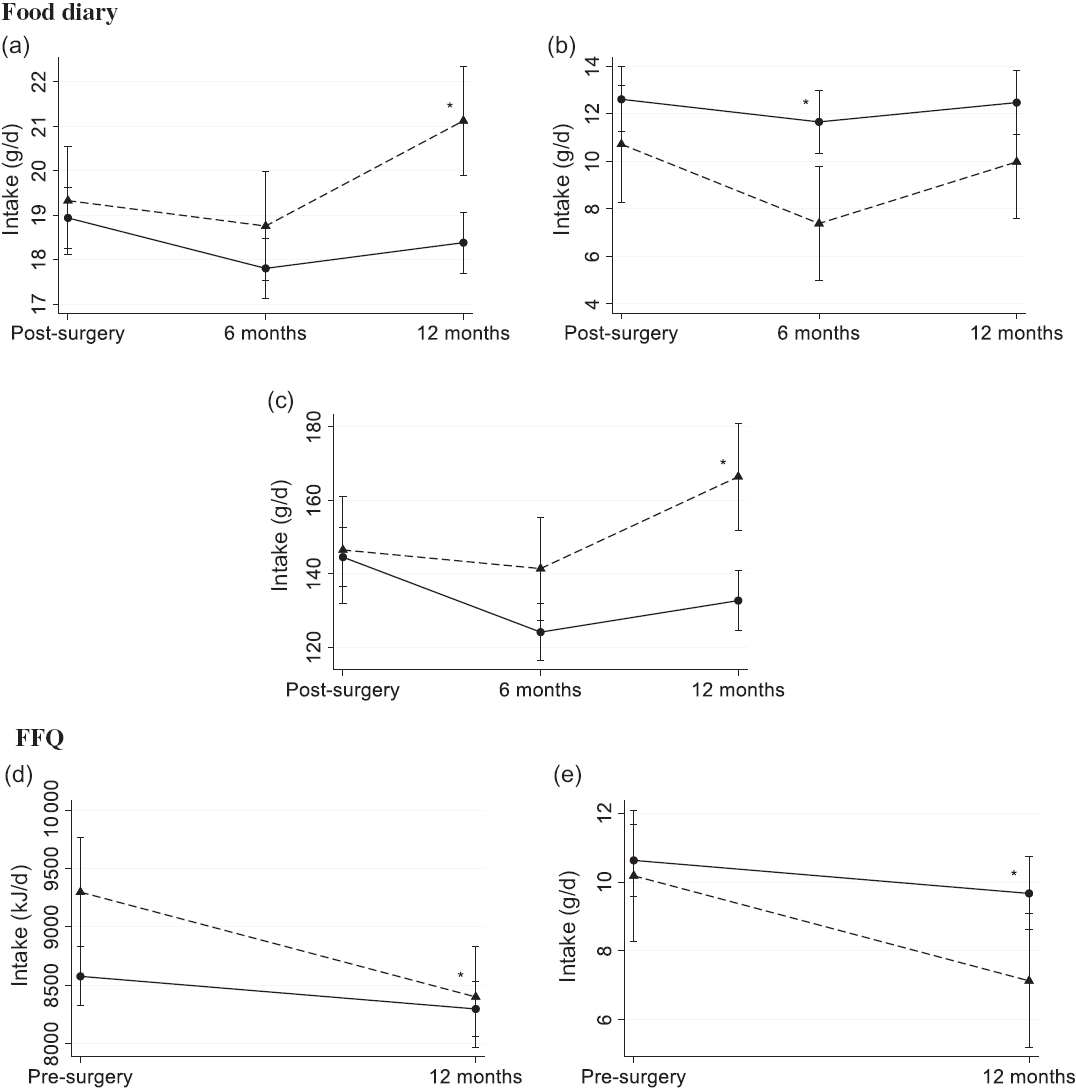
Fig. 2. Estimated mean (95 % CI) dietary intake of (a) fibre, (b) alcohol and (c) vegetables measured using the pre-coded food diary (n 412) and (d) energy and (e) alcohol using the FFQ (n 407) by those who claimed dietary changes (![]() ) and those who claimed no changes (
) and those who claimed no changes (![]() ). Pre-coded food diary post-surgery, within 3 weeks post-surgery; 6 months post-surgery; 12 months post-surgery. FFQ pre-surgery, the 12 months before diagnosis; 12 months post-surgery. * Significant difference in change from 3 weeks post-surgery food diary (a–c) and pre-surgery FFQ (d and e) in a linear mixed model (P < 0·05).
). Pre-coded food diary post-surgery, within 3 weeks post-surgery; 6 months post-surgery; 12 months post-surgery. FFQ pre-surgery, the 12 months before diagnosis; 12 months post-surgery. * Significant difference in change from 3 weeks post-surgery food diary (a–c) and pre-surgery FFQ (d and e) in a linear mixed model (P < 0·05).
For the FFQ, the patients who claimed dietary changes reported a 0·7 MJ/d higher energy intake (95 % CI 0·2, 1·3, P = 0·008) pre-surgery, but they also reduced their energy intake by 0·6 MJ/d (95 % CI –1·1, –0·2, P = 0·009) more than the patients who claimed no dietary changes (Fig. 2(d)). Consequently, at 12 months post-surgery, the energy intakes were 8·4 MJ/d (95 % CI 8·0, 8·8) and 8·3 MJ/d (95 % CI 8·1, 8·5) for those who reported dietary changes and no changes, respectively. In addition, the patients who claimed dietary changes reduced their intake of alcohol by 2·1 g/d (95 % CI –3·8, –0·4, P = 0·02) more than those who claimed no changes (Fig. 2(e)). At 12 months post-surgery measured by the FFQ, the dietary intake of alcohol was 7·1 g/d (95 % CI 5·2, 9·1) and 9·7 g/d (95 % CI 8·6, 11) for those claiming dietary changes and those claiming no changes, respectively. However, when the change in alcohol intake was calculated as E%, there was no difference between the strata.
Discussion
In the present study among women diagnosed with breast cancer stage I or II, the reported diet was quite stable overall. The dietary intake of energy, most nutrients and food groups changed <5 %, and all changes were <15 %. This applies both measured by the food diary (throughout the 12 months post-surgery) and the FFQ (from 12 months pre-surgery to 12 months post-surgery). Nevertheless, the dietary intake of energy, alcohol and vegetables was lower at 6 months measured by the food diary and at 12 months post-surgery measured by the FFQ than 3 weeks post-surgery and pre-surgery, respectively. Furthermore, E% from carbohydrates increased and E% from fat decreased over time, measured by both dietary assessment methods. The FFQ demonstrated a decrease in the intake of red and processed meat and dairy products from pre-surgery to 12 months post-surgery, whereas the food diary demonstrated no change in the intake of red and processed meat over time and a minor increase in the intake of dairy products to 6 months from 3 weeks post-surgery. In total, 24 % of the patients claimed to have changed their diet. Interestingly, they did not change their diet in a different way or to a different extent than the patients who claimed no dietary changes, with a few minor exceptions.
Two different dietary assessment methods were used to examine dietary changes. The methods intended to measure changes over slightly different periods where the food diary measured intake on specific days and changes over the 12 months post-surgery, and the FFQ asked for the usual intake and changes from 12 months pre-surgery to 12 months post-surgery. We here demonstrated that the diet of women diagnosed with early-stage breast cancer was quite stably measured with both methods over the two different, but overlapping, periods.
The mean intake of alcohol among the participants was above the Norwegian dietary recommendations (<10 g/d)(36) pre-surgery measured by the FFQ, and even higher in the food diary and thus above the recommendations at all three time points. It was also higher than that previously reported in the general Norwegian female population comparable for age and time although not from same geographical area(37,Reference Lundblad, Andersen and Jacobsen38) . A lower intake of energy, alcohol and protein has been reported among breast cancer patients during adjuvant chemotherapy compared with both before the treatment and with women without cancer(Reference de Vries, van den Berg and de Vries39,Reference Boltong, Aranda and Keast40) , although the results are conflicting(Reference Demark-Wahnefried, Peterson and Winer41,Reference Harvie, Campbell and Baildam42) . In the present study, the intake of energy and alcohol decreased from 3 weeks post-surgery to 6 months post-surgery, which was the time period at which many of the patients underwent chemotherapy. However, the reduction was small and appeared to be temporary, as the intake at 12 months did not differ from the intake 3 weeks post-surgery. The FFQ also demonstrated decreased intake of energy, alcohol and protein from before to 12 months post-surgery, as seen in other studies(Reference Velentzis, Keshtgar and Woodside12,Reference Fassier, Zelek and Lecuyer14,Reference Lei, Ho and Cheng17) . When comparing the intake of alcohol among the patients at 12 months in the food diary and FFQ, 46 % reported a mean intake >10 g/d in the food diary over the 7 d of registration, whereas 34 % reported >10 g/d over 1 month measured by the FFQ at around the same time. The patients were informed about the dietary recommendations on alcohol intake and advised to limit their intake (<7 units of alcohol/week). This could have influenced how they reflected on and answered the FFQ, but probably not to the same degree for the food diary, where they could tick off whether the day reported was a normal or an unusual day with regard to dietary intake. In addition, the patients who claimed that they changed their diet decreased their intake of alcohol more than those who claimed no dietary changes (assessed by the food diary to 6 months and the FFQ to 12 months). However, the difference in change in E% from alcohol was not significant.
The E% from carbohydrates was lower than that reported by women in the nationwide Norkost 3 study(37), and although it increased slightly over the study period, it was still below the recommendation (45–60 E%)(36). On the contrary, the E% from fat decreased slightly over the study period, but was within the recommendation at all time points (25–40 E%)(36).
The intake of vegetables was lower than the recommendation measured by the food diary over the study period but comparable to the intake reported among women in the Norkost 3 study(5,37) . For the FFQ, the overall intake of vegetables was about double the amount reported with the food diary. At least some of this may result from the method itself because the retrospective nature of the FFQ could be more prone to social desirability bias and overreporting of food groups such as fruit and vegetables(Reference Di Noia, Cullen and Monica43,Reference Hebert, Ebbeling and Matthews44) . Most previous studies have reported increased intake of vegetables after diagnosis among breast cancer survivors(Reference Thomson, Flatt and Rock11,Reference Velentzis, Keshtgar and Woodside12,Reference Skeie, Hjartaker and Braaten15,Reference Lei, Ho and Cheng17) . On the contrary, the French NutriNet-Santé cohort reported decreased intake of vegetables among all cancer patients, but no change among the breast cancer patients(Reference Fassier, Zelek and Lecuyer14). Others have reported decreased intake of dark-green and orange vegetables and legumes during chemotherapy among breast cancer patients(Reference Custodio, Marinho Eda and Gontijo45). In the present study, although the decrease was not large, the intake of vegetables decreased to 6 and 12 months post-surgery, measured by the food diary and the FFQ, respectively.
The period after being diagnosed with cancer has been described as a ‘teachable moment’, a period for making positive lifestyle changes(Reference Demark-Wahnefried, Aziz and Rowland46) such as healthy dietary changes(Reference Maunsell, Drolet and Brisson6–Reference Salminen, Bishop and Poussa9,Reference Thomson, Flatt and Rock11,Reference Velentzis, Keshtgar and Woodside12,Reference Skeie, Hjartaker and Braaten15,Reference Lei, Ho and Cheng17) . However, behavioural change is challenging, and even dietary intervention studies for cancer survivors have reported contradictory results in dietary changes after a cancer diagnosis(Reference Burden, Sremanakova and Jones47). Individual physiological, psychological and social factors may all affect the patient in this vulnerable phase and represent reasons for not implementing any changes(Reference Corbett, Cheetham and Muller48). Also, the patients may have intended to make the changes, but it can be hard to distinguish between actual and intended dietary changes when recalling their diet, as may have been demonstrated for the intake of red and processed meat in the present study. This may be due to the media focus on the carcinogenicity report from the International Agency for Research on Cancer in 2015(49). The total meat intake was about the same in the FFQ pre-surgery and the food diary 3 weeks post-surgery, and just around the upper limit of the Norwegian dietary guidelines (<500 g/week)(5). Still, the intake of processed meat was substantial and not in line with the recommendation to limit intake. In the FFQ, the intake of red and processed meat slightly decreased to 12 months, whereas no dietary change was observed in the food diary during the study period.
There was a discrepancy in reporting dairy products in the food diary and the FFQ. Overall, the intake was reported to be >1·5 times higher when measured with the FFQ than the food diary. Previous studies have demonstrated inconsistent results regarding change in the intake of dairy products after a breast cancer diagnosis(Reference Salminen, Bishop and Poussa9,Reference Skeie, Hjartaker and Braaten15) . In the present study, the change in intake differed between the dietary assessment methods. In the food diary, the intake of dairy products increased slightly to 6 months, but there was no change in the intake from 3 weeks post-surgery to 12 months post-surgery. In the FFQ, a lower intake was observed 12 months post-surgery than pre-surgery.
In the present study, 24 % claimed to have made significant changes in their dietary habits over the last year, which is lower than reported in other studies(Reference Maunsell, Drolet and Brisson6–Reference Shaharudin, Sulaiman and Shahril10). However, in general, the patients who claimed dietary changes did not change their diet to a greater degree than the ones that claimed no dietary changes. Two previous studies using both qualitative questions on dietary changes, and quantifying the changes using quantitative or semi-quantitative methods, demonstrated that the actual changes appeared to be quite small(Reference Shaharudin, Sulaiman and Shahril10,Reference Wayne, Lopez and Butler13) . Nevertheless, there is a possibility that changes may have been made in parts of the diet that we did not examine or were too small to capture with the dietary assessment methods used.
Studies investigating dietary changes after a breast cancer diagnosis have presented a large range of time points as ‘post-diagnosis’, ranging from months after diagnosis(Reference Maunsell, Drolet and Brisson6,Reference Fassier, Zelek and Lecuyer14) to several years after(Reference Alfano, Day and Katz50), and even with different time points in the same study(Reference Salminen, Lagstrom and Heikkila7,Reference Salminen, Bishop and Poussa9,Reference Thomson, Flatt and Rock11,Reference Skeie, Hjartaker and Braaten15,Reference Affret, His and Severi16) . It is possible that we have captured only small dietary changes associated with side effects and issues related to the treatment, in particular for those undergoing chemotherapy(Reference Marinho, Custodio and Ferreira51,Reference Marinho, Custodio and Ferreira52) . Furthermore, it has been reported that changes are more likely to occur among those receiving three or more treatments compared with one treatment(Reference Patterson, Neuhouser and Hedderson8). The breast cancer patients in the current study mostly receive at least three types of treatment: breast cancer surgery, radiation therapy (all women with breast-conserving surgery) and endocrine therapy. Based on lymph node-positive v. lymph node-negative disease subgroup analyses, which may reflect both aggressiveness of the disease and those receiving chemotherapy, the groups had similar results for the intake and changes in intake of macronutrients. However, dietary changes within this study population due to variation in breast cancer treatment may exist and should be studied in more detail. Of note, some studies have demonstrated that intentional dietary changes may come at a later time point(Reference Salminen, Bishop and Poussa9,Reference Thomson, Flatt and Rock11,Reference Skeie, Hjartaker and Braaten15) . In the present study, dietary data are also collected 24 months post-surgery, so potential dietary changes at a later stage can be captured. Only women with breast cancer stage I and II were included in the study, and patients with other known severe illnesses (i.e. severe heart disease, dysregulated diabetes) or incapable of being physically active were excluded (no restrictions on exercise). It is unknown to what extent the current results on dietary changes also apply to these groups of breast cancer patients who also have other serious diseases.
The strengths of this clinical study include the relatively large number of patients, the low dropout during follow-up and using mixed models that take into account any missing data at any time point. Furthermore, repeated administrations of two different validated dietary assessment methods were used to capture dietary intake and changes over slightly different, but overlapping periods, where both methods demonstrated that the diet did mostly not change. The patients were followed closely and phoned if there was any missing or inaccurate dietary information. Furthermore, the present study provides insight into the complexity of and challenges in the interpretation of dietary data when using different dietary assessment methods.
However, the study also has some limitations. The dietary intake is self-reported, and measurement errors cannot be excluded, such as reactivity when filling in the food diary and recall errors related to memory with the FFQ. Based on the previous results of the validation of the FFQ and the food diary, there may be more uncertainty related to the dietary assessment from pre-surgery and 3 weeks post-surgery than at the other time points, especially for the food diary(Reference Brunvoll, Thune and Frydenberg21). Furthermore, many statistical tests were performed, and no adjustments were made for multiple testing. Still, the actual size of the changes and their clinical relevance are the most essential findings.
Conclusion
The present clinical study provides results on dietary changes in women newly diagnosed with stage I or II breast cancer; the diet was quite stable, and the few reported dietary changes were mostly small. The patients decreased their intake of vegetables, alcohol, E% from fat and total energy, and increased the E% from carbohydrates measured with both the food diary and the FFQ over time. There were only minor differences in change in dietary intake between the patients who claimed to have changed their diet compared with those who claimed no changes. In conclusion, even though the time period after a breast cancer diagnosis has been referred to as a period for making positive dietary changes, our data suggest that only minor dietary changes took place.
Acknowledgements
We acknowledge each woman who participated in this study. Furthermore, we acknowledge our study nurses Alexandra Østgaard, Ragnhild Tveit, Harriet Børset, Therese Larner and Eline Holli Halset and administrator Marianne Corneliussen and Tora Bettum.
This work was funded by the Institute of Basic Medical Sciences, University of Oslo with supplementary funds from the Throne Holst Nutrition Research Foundation. Also, the present study was supported by grants from South-East Norwegian Health Authority (grant no. 2012064), Norwegian Research Council (grant no. 213997) and Active Against Cancer Gjensidige Stiftelsen (grant no. 2012). Dr. McTiernan was supported by grants from the Breast Cancer Research Foundation (BCRF-18-107 and BCRF-19-107). The funders had no role in the design, collection of data, analysis, interpretation of data or writing of this article.
The authors’ roles were as follows: S. H. B., I. T. and A. H.: conception and design of the present study. I. T., G. F. B., F. F., V. G. F., H. F., S. L., H. S. and E. S.: patient follow-up, data collection and construction of the clinical database. S. H. B. and A. H.: collection and construction of the dietary database. J. L.: histological examinations. S. H. B.: statistical analyses with supervision from M. W. F. S. H. B.: drafting the manuscript. S. H. B., I. T., A. M. and A. H.: interpretation of the results. All the authors have been critically reviewing and approved the manuscript.
The authors declare that there are no conflicts of interest.
Supplementary material
For supplementary materials referred to in this article, please visit https://doi.org/10.1017/S0007114520002627


 Open access