


Diet is one of the most important modifiable risk factor for obesity, type 2 diabetes and CVD( Reference Hruby, Manson and Qi 1 ). Excess dietary intake and low energy expenditure through lack of physical activity lead to a positive energy balance and accumulation of excess fat in adipose tissue( Reference Pemberton, McCrindle and Barkin 2 , Reference Rocha and Libby 3 ). Although the primary function of adipose tissue is to store excess nutrients as TAG and to release NEFA during fasting, it also secretes a large amount of hormones and signalling molecules( Reference Abranches, Oliveira and Conceicao 4 , Reference Jung and Choi 5 ). These adipose tissue products are collectively referred to as adipokines and may act as mediators between dietary pattern and disease risk( Reference Ko, Park and Mantzoros 6 – Reference Silva, de Almeida and Feoli 8 ).
Adipokines may play an important role in the pathogenesis of complications of obesity such as type 2 diabetes, metabolic syndrome and CVD( Reference Feakins 9 – Reference Shibata, Ouchi and Ohashi 14 ). Obesity is associated with up-regulation of pro-inflammatory and down-regulation of anti-inflammatory adipokines, which promote and ameliorate insulin resistance, respectively( Reference Kwon and Pessin 15 , Reference Antuna-Puente, Feve and Fellahi 16 ). Some adipokines also directly influence β-cell apoptosis and insulin secretion( Reference Dunmore and Brown 17 ). Anti-inflammatory adipokines counteract these effects( Reference Dunmore and Brown 17 ). Lower adiponectin and rising C-reactive protein (CRP) are associated with declining β-cell function in women at high risk for type 2 diabetes( Reference Xiang, Kawakubo and Trigo 18 ). In meta-analyses and reviews, associations between diet, dietary pattern and adipokines were demonstrated for adiponectin( Reference Schwingshackl and Hoffmann 19 ), CRP( Reference Schwingshackl and Hoffmann 19 – Reference Neale, Batterham and Tapsell 21 ) and IL-6( Reference Schwingshackl and Hoffmann 19 ). On the basis of these studies, several dietary inflammation indices were constructed to reflect biological pathways mediating inflammation( Reference Shivappa, Steck and Hurley 22 , Reference Tabung, Smith-Warner and Chavarro 23 ). However, our understanding of dietary intake on broader adipokine profile remains limited.
The goal of the present study was to address this knowledge gap by examining the relationship between the consumption of major food groups, three measures of adiposity and a large set of adipokines in a Mexican American cohort enriched with individuals at high risk for type 2 diabetes. The findings from our study help identify the most influential dietary drivers of obesity and adipokine levels, which in turn may be used to elucidate the primary dietary components that contribute to metabolic dysfunction in Mexican Americans.
Methods
Study design and subjects
Participants of this study were from the BetaGene study, a family-based study of obesity, insulin resistance and β-cell dysfunction in Mexican Americans( Reference Watanabe, Allayee and Xiang 24 ). Study design and recruitment has been previously described( Reference Watanabe, Allayee and Xiang 24 ). Probands were individuals with the condition of interest for the BetaGene study seeking medical attention at Los Angeles County/University of Southern California Medical Center, the Kaiser Permanente Southern California health plan membership, and obstetric/gynaecologic clinics at local southern California hospitals (online Supplementary Fig. S1). Inclusion criteria for all probands were a Mexican-American ancestry (both parents and at least three grandparents Mexican or of Mexican descent) and one of two general family structures: (a) at least two siblings and three first cousins from a single nuclear family or (b) at least five siblings available for study participation. All participants are either (1) probands with a diagnosis of gestational diabetes mellitus (GDM) within 5 years of enrolment of the study, (2) probands with normal glucose levels (non-GDM) during a pregnancy within the 5 years of enrolment of the study, or (3) siblings or first cousins of probands. Non-GDM probands were age, BMI and parity-matched to the GDM probands.
Participants were excluded if they showed evidence of β-cell autoimmunity by glutamic acid decarboxylase-65 testing or if they had fasting glucose >7·0 mmol, as acute insulin response to glucose is often absent above this level. Final study participants were probands, or siblings and first cousins of probands who completed the baseline screening (n 1585). For the present study, we further excluded participants who did not meet the inclusion criteria after baseline screening (n 101) and those with incomplete visits (n 231) or data (n 91), resulting in a final analytical cohort of 1128 participants.
Data were collected in two separate visits to the General Clinical Research Center at the University of Southern California. The first visit consisted of a physical examination, dietary and physical activity questionnaires, a fasting blood draw for lipid measurements and sample storage for adipokine measurement, as previously described( Reference Black, Fingerlin and Allayee 25 – Reference Shu, Hartiala and Xiang 27 ). Non-GDM probands and family members of probands with fasting glucose <7·0 mmol/l were invited for a second visit as previously described and dual-energy X-ray absorptiometry scan was performed to assess their total body fat and trunk fat( Reference Buchanan, Xiang and Kjos 28 ). A total of 1128 participants from 403 families (ranging from one to twelve participants per family) completed the dietary assessment, and had all adiposity (BMI, dual-energy X-ray absorptiometry scan) and adipokine measures.
Ethics
All protocols for BetaGene were approved by the Institutional Review Boards of participating institutions, and all participants provided written informed consent before participation. The study is registered under NCT03301519.
Dietary assessment
Assessment of dietary intake for this cohort has been previously reported( Reference Black, Watanabe and Trigo 29 ). The food consumption for the past 12 months was assessed using the 126-item semi-quantitative Harvard food frequency questionnaire (FFQ)( Reference Willett, Sampson and Stampfer 30 ). Trained bilingual interviewers administered the FFQ to all participants. The FFQ consisted of a list of foods with a standardised serving size and a selection of nine frequency categories ranging from never or <1 serving per month to >6 servings per day during the past year. An open-ended free-text section was used to capture food items that did not appear on the standard list and included information on usual serving size and number of servings consumed per week for incorporation in the dietary intake calculations for each subject. The frequency of consumption of each food from the FFQ was multiplied by the specified portion size to calculate the food consumption in servings per day, and then converted to grams per day. FFQs with reported energy intakes >3sds from the mean were considered invalid and excluded from analysis (n 37)( Reference Black, Watanabe and Trigo 29 ). Food items were grouped into dairy products (low- and high-fat items such as cheese, milk, yoghurt, ice cream, cream cheese and butter), fruits (raw, cooked, fresh, canned, frozen or dehydrated fruits), fruit juices, meat (fresh and processed meats such as beef, lamb, pork, poultry), fish (including other seafood), starchy foods (pasta, rice, grains, bread, potatoes, etc.), sugar-sweetened beverages (SSB) (caffeinated colas, caffeine-free colas, other carbonated SSB and non-carbonated SSB such as fruit punches, lemonades or others) and vegetables (raw, cooked, fresh, canned, frozen or dehydrated vegetables and legumes).
Body mass and composition
Height and weight were measured using a beam medical scale and wall-mounted stadiometer to the nearest 0·1 kg and 0·1 cm, respectively. BMI was calculated as body weight (kg)/height (m)2. Total body fat mass and trunk fat mass were determined by dual-energy X-ray absorptiometry (Discovery-WTM DEXA system).
Adipokines
Fasting plasma samples were used to measure adipokines. Adiponectin, IL-1β, IL-6, leptin, lipocalin, monocyte chemo-attractant protein-1 (MCP-1), that is chemokine ligand 2, or CCL2, resistin and TNF-α were assayed using two Millipore multiplex kits with magnetic bead panels (Millipore). Assay sensitivity for adiponectin, lipocalin and resistin are 11, 1·7 and 2·2 pg/ml, respectively. Intra- and inter-assay variations are <10 and <15 % respectively, and accuracy ranged from 87 to 91 % for all adipokines in the panel. Sensitivities for leptin, IL-1β, IL-6, MCP-1 and TNF-α are 19·0, 0·4, 0·2, 1·3 and 0·3 pg/ml, respectively. Intra- and inter-assay variations are <15 % and accuracy is >90 % for all adipokines in the panel. ELISA was used to measure CRP (Millipore), apelin, dipeptidyl peptidase-4 (DPP-IV), IL-18, visfatin (Ray Biotech), IL-1ra (AssayBiotech), secreted frizzled protein 4 (SFRP-4) and SFRP-5 (USCN Life Science). Assay sensitivity for CRP, apelin, DPP-IV, IL-18, visfatin, IL-1ra, SFRP-4 and SFRP-5 is: 0·0002 µg/ml, 36·55 pg/ml, 0·261 ng/ml, 6·1 pg/ml, 13·5 pg/ml, 2·4 pg/ml, 28·3 pg/ml and 0·39 pg/ml. Intra- and inter-assay variations are <10 and <15 %, respectively, for all adipokines. Accuracy was >95 % for most adipokines; accuracy for SFRP-4 and SFRP-5 ranged from 85 to 95 %.
The proportion of participants with measures below the limit of detection was less than 2 % for IL-6, MCP-1, TNF-α, IL-1β, SFRP-5, apelin and IL-1ra, whereas those for IL-1β and IL-18 reached 7 and 14 %, respectively. Values of these adipokines that were lower than the limit of detection were imputed using the square root of the limit of detection( Reference Croghan and Egeghy 31 ).
Statistical analysis
The cohort characteristics are described by medians and corresponding 25th and 75th percentiles. The consumption of major food groups, measures of adiposity and adipokines were log-transformed to approximate univariate normality where appropriate before data analyses. Correlation among the consumption of the major food groups, between each of the major food groups and measures of adiposity, and among adipokines were estimated after adjustment for age and sex.
Canonical correlation analysis (CCA) was used to assess the multivariate associations between the food groups and adiposity (BMI, percentage of body fat and trunk fat), as well as food groups and adipokines. CCA is a multivariate analysis of cross-correlations among two sets of quantities where each set has multiple variables. CCA finds linear combinations of each set that have the maximum correlation with each other( Reference Knapp 32 , Reference Hotelling 33 ). The loading coefficient represents each variable’s contribution to the specific set being investigated. To appropriately account for relatedness among individuals owing to family structure in this study, linear mixed-effect kinship models were used and CCA analyses were performed on the kinship-adjusted covariance of food group consumption v. adiposity, and food group consumption v. adipokines after adjustment for age, sex and total energy intake( Reference Therneau 34 ). The top canonical correlation was displayed by a heliograph where the bar length is an indicator for the strength of association for each variable to the top linear component identified in CCA( Reference Degani and Shafto 35 ).
To characterise the sample from the CCA results, we grouped the cohort into three groups based on participant’s consumption of the top dietary components identified from CCA analyses relative to the tertile distribution of the whole cohort. Measures of adiposity and adipokines were compared among the three groups after adjusting for age, sex, total energy intake and kinship using the mixed-effects model( Reference Therneau 34 ). To visualise the impact of dietary group on different adipokines relative to each other, we applied a standardisation method to remove the measurement units associated with each adipokine and displayed the standardised residuals by dietary groups after adjusting for age, sex, total energy intake and kinship. All statistical analyses were conducted using SAS version 9.3 (SAS Institute, Inc.) and R v.3.3.0( 36 ).
Results
Characteristics of BetaGene participants
Participants of the BetaGene study (n 1128) were 34·7±8·2 years of age, mostly female (73·2 %) and had a median BMI of 28·7 kg/m2 (interquartile range, 25·4, 32·6) and total body fat of 35·9 % (29·0–40·6) (Table 1). The BetaGene proband generation included 338 probands (30·0 %), 527 siblings (46·7 %) and 263 first cousins (23·3 %). The majority of participants were overweight or obese (n 887, 79 %). The median (interquartile range) energy intake was 9514 (7314, 11912) kJ/d. Although 55·4 % of total energy intake that accounted for was by carbohydrates, 23·6 % was derived from sugar. The energy intake from fat was 28·7 %, and 17·3 % from protein. Participants consumed a median (interquartile range) of 385·5 (277·99, 544·0) g/d vegetables, 240·6 (146·7, 365·3) g/d fruits, 142·2 (48·3, 252·1) ml/d fruit juices and 346·9 (137·1, 497·3) ml/d SSB (Table 1).
Table 1 Characteristics of BetaGene study participants (Medians and 25th, 75th percentiles; percentages)
DPP-IV, dipeptidyl peptidase-4; MCP-1, monocyte chemo-attractant protein-1; SFRP, secreted frizzled protein.
Food consumption and body composition
All measures of adiposity (BMI, total percentage body fat and percentage trunk fat) were negatively correlated with the consumption of fruits and fruit juice, marginally with vegetables and starchy foods, and positively correlated with SSB (Table 2).
Table 2 Age-, sex and kinship-adjusted correlations between consumption of major food groups, body composition and adipokines
SSB, sugar-sweetened beverages; DPP-IV, dipeptidyl peptidase-4; MCP-1, monocyte chemo-attractant protein-1; SFRP, secreted frizzled protein.
* Correlations are significant at P≤0·05.
In multivariate analysis using CCA on variables adjusted for sex, age, energy intake and kinship, a total of 66 % of the shared variation between diet and measures of adiposity was explained by the top linear association between the two (P<0·001) with loading coefficients for food consumption and body composition given in Table 3. No other canonical component explained the association between the two (P>0·05). The strongest predictors of adiposity were a higher consumption of SSB (canonical loading ρ=0·73) as well as a lower consumption of fruit (ρ=–0·45) and fruit juices (ρ=–0·46). The consumption of meat, dairy products and starchy foods showed a modest to low association (ρ≤0·30) with measures of adiposity. The top canonical correlation is shown as heliograph in Fig. 1(a).
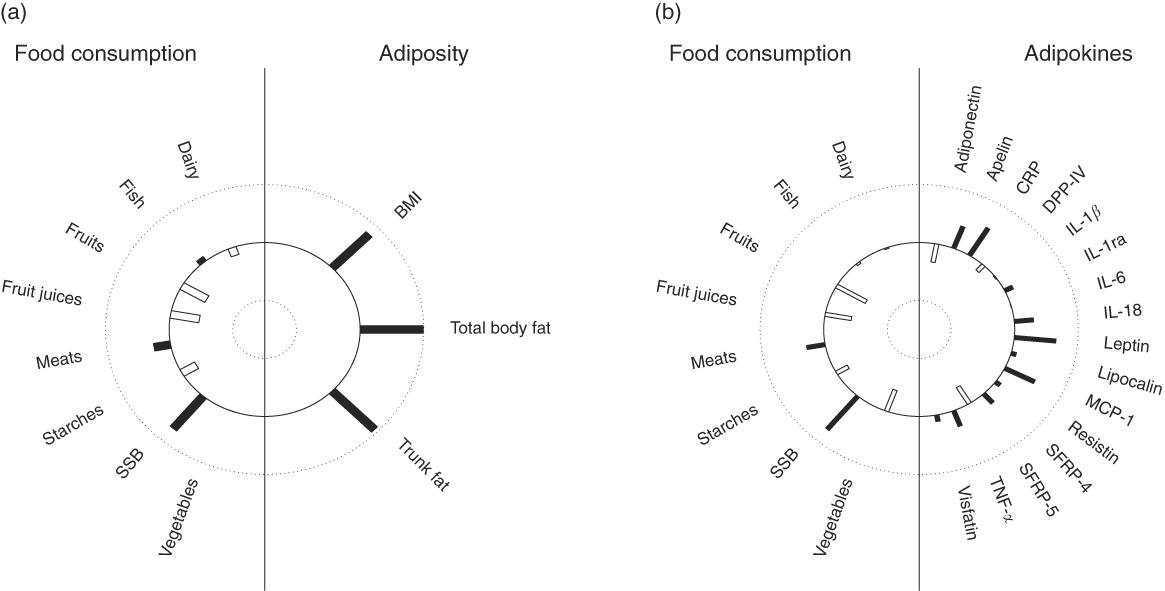
Fig. 1 Canonical-correlation heliograph demonstrating the joint multivariate association between food consumption and adiposity ((a) explained variation 66 %, P<0·001) as well as food consumption and adipokines ((b) explained variation 33 %, P=0·017) after adjusting for sex, age, energy intake and kinship: dark bar=positive association, white bar=negative association; bar length=strength of association ranging from 1 (outer circle) to –1 (inner circle). SSB,sugar-sweetened beverages. CRP, C-reactive protein; DPP-IV, dipeptidyl peptidase-4; MCP-1, monocyte chemo-attractant protein-1; SFRP, secreted frizzled protein.
Table 3 Joint multivariate canonical loadings between food consumption, measures of adiposity and adipokines
DPP-IV, dipeptidyl peptidase-4; MCP-1, monocyte chemo-attractant protein-1; SFRP, secreted frizzled protein.
* Model 1: Adjusted for age, sex and kinship.
† Model 2: Adjusted for age, sex, kinship and total energy intake.
‡ Loadings ≥0·30.
Food consumption and adipokines
In partial correlations adjusted for sex, age and kinship, several food groups were correlated with adipokine levels (Table 2). A higher consumption of SSB was significantly associated with higher CRP, leptin, MCP-1, SRFP-4 and TNF-α. Fruit consumption was negatively correlated with CRP, IL-1β, IL-1ra and leptin and positively with DPP-IV. Fruit juice consumption was negatively correlated with apelin and leptin. A higher vegetable consumption was associated with lower leptin, MCP-1, SRFP-4 and TNF-α. A higher meat consumption was associated with lower SRFP-5 and a higher consumption of starchy foods with lower leptin.
In multivariate analysis using CCA on variables adjusted for sex, age, energy intake and kinship, a total of 33 % of the shared variation between diet and adipokines was explained by the top linear association between the two (P=0·017; Table 3). No other components explained the association between the two (P>0·05). The top dietary component was most represented by SSB (canonical loading ρ=0·74), fruits (ρ=–0·54), fruit juices (ρ=–0·42) and vegetables (ρ=–0·39), whereas the adipokine component was most represented by leptin (ρ=0·65), CRP (ρ=0·55), MCP-1 (ρ=0·52), apelin (ρ=0·40), SRFP-5 (ρ=–0·34), adiponectin (ρ=–0·32) and IL-18 (ρ=0·30). All other canonical loading factors were <0·30. The top canonical correlation is shown as heliograph in Fig. 1(b). To assess the role of adiposity in the multivariate association between diet and adipokines, we repeated the CCA analysis by further adjusting for total body fat. Adjusting for adiposity removed the shared variation between diet and adipokines and the top linear association between the two was no longer significant (P=0·36).
Adiposity and adipokines by tertiles of the top dietary components from canonical correlation analysis results
CCA analysis identified SSB, fruit, fruit juice and vegetable as the top dietary components that were associated with adiposity and/or adipokines. Next, we classified participants as ‘High’ intake if their consumptions were at or greater than the third tertile of the distribution, and ‘Low’ intake if were at or lower than the first tertile of the distribution. Three groups were formed: (1) ‘High’ in SSB but ‘Low’ in fruit (including fruit juice) and vegetable consumption (HighSSB/LowFV), (2) ‘Low’ in SSB but ‘High’ in fruit (including fruit juice) and vegetable consumption (LowSSB/HighFV) and (3) the remaining combinations as ‘Other’. Table 4 presents the sex, age, total energy intake and kinship-adjusted adipokines by the three dietary groups. Participants consuming a LowSSB/HighFV diet had lower BMI, total percentage body fat, percentage trunk fat than participants consuming a HighSSB/LowFV diet. Participants consuming a HighSSB/LowFV diet had higher CRP, leptin, apelin and MCP-1, but lower SFRP-5 and adiponectin than participants consuming a LowSSB/HighFV diet, although the differences in adiponectin and apelin were not statistically significant. Participants consuming a HighSSB/LowFV diet also had higher BMI, total percentage body fat, percentage trunk fat than participants consuming a LowSSB/HighFV diet. Standardisation revealed that the differences in anti-inflammatory adipokines between HighSSB/LowFV and LowSSB/HighFV were most pronounced for SFRP-5, whereas the differences in pro-inflammatory adipokines was most pronounced for leptin and MCP-1 (Fig. 2).
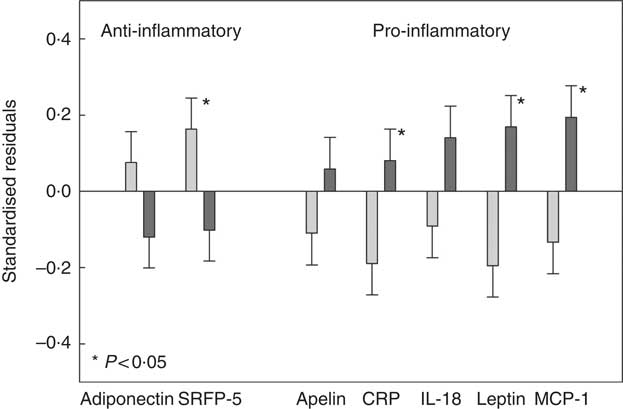
Fig. 2 Standardised residuals after adjusting for sex, age and energy intake of selected adipokines of participants consuming a diet which was high in sugar-sweetened beverages (SSB) and low in fruit, fruit juices and vegetables (HighSSB/LowFV, n 147) compared with participants consuming a diet which was low in sugar-sweetened beverages and high in fruit, fruit juices and vegetables (LowSSB/HighFV, n 147). Adipokines shown exhibited loadings ≥0·30 in canonical correlation analysis. The standardisation was to remove measurement units to better picture the impact of dietary group on different adipokines relative to each other. P values comparing HighSSB/LowFV and LowSSB/HighFV are provided from linear mixed-effect kinship models. ![]() , LowSSB/HighFV;
, LowSSB/HighFV; ![]() , HighSSB/LowFV. CRP, C-reactive protein; MCP-1, monocyte chemo-attractant protein-1.
, HighSSB/LowFV. CRP, C-reactive protein; MCP-1, monocyte chemo-attractant protein-1.
Table 4 Adipokine concentrations in participants consuming a diet which was (1) high in sugar-sweetened beverages (SSB) and low in fruit and vegetables (HighSSB/LowFV), (2) low in SSB and high in fruit and vegetables (LowSSB/HighFV) or (3) any other consumption
(Geometric or arithmetic means with their standard errors)
DPP-IV, dipeptidyl peptidase-4; MCP-1, monocyte chemo-attractant protein-1; SFRP, secreted frizzled protein.
* Data are geometric means (except BMI, MCP-1 and SFRP-5, which are given as arithmetic means) and standard errors adjusted for sex, age and total energy intake based on linear mixed-effect kinship models.
Discussion
In this cross-sectional analysis in Mexican Americans with a high prevalence of overweight or obesity, high SSB and low fruit and vegetable intake was identified as the main dietary factors associated with increased adiposity. A high consumption of SSB but low fruit and vegetable intake also correlated with a pro-inflammatory adipokine profile characterised by increased CRP, leptin and MCP-1, and decreased SFRP-5 compared with a low SSB but high fruit and vegetable intake. The association between dietary intake and adipokine profile was primarily explained by adiposity rather than an independent association between diet and adipokines.
The novelty of this study is the use of a multivariate analysis approach accounting for collinearity to assess the multivariate association between diet, three measures of adiposity (i.e. BMI, total body fact percentage and trunk fat percentage) and a large set of adipokines. Adipokines were chosen because each adipokine has previously shown association with energy homeostasis and β-cell function; these also include adipokines that are less studied in humans, such as apelin, MCP-1 and SFRP-5. We identified that high SSB and low fruit and vegetable intake were the main common food groups associated with increased adiposity and pro-inflammatory adipokine profiles. Obesity may be the pathway linking the association between diet and adipokines. Obesity is a disorder of the energy homeostasis system; the mechanisms to regulate and defend excess body weight are currently not well understood and involve several adipokines( Reference Despres and Lemieux 37 , Reference Schwartz, Seeley and Zeltser 38 ). Our results are consistent with previous evidence that obesity is generally characterised by up-regulation of pro-inflammatory and down-regulation of anti-inflammatory adipokines. We adjusted for total energy intake in our analysis. Our finding that adiposity was associated with high SSB and low fruit and vegetable intake independent of total energy intake is consistent with previous findings that well-balanced diets rich in fruit and vegetables but low in sugar, such as the Dietary Approaches to Stop Hypertension (DASH) or a Mediterranean diet, are associated with lower adiposity and morbidity( Reference Rees, Hartley and Flowers 39 – Reference Soltani, Shirani and Chitsazi 43 ).
It is concerning that the consumption of SSB in the USA has steadily increased over the past 30 years, and is particularly high among Mexican Americans( Reference Ogden, Kit and Carroll 44 , Reference Yngve, Haapala and Hodge 45 ). A recent systematic review and meta-analyses of prospective cohort studies and randomised controlled trials strongly suggests that the consumption of SSB promotes weight gain in children and adults( Reference Malik, Pan and Willett 46 , Reference Malik, Willett and Hu 47 ), and increases the risk of metabolic syndrome and diabetes( Reference Malik, Popkin and Bray 48 ). In the present study, BetaGene participants consumed an average of 347 ml or approximately 12 fl oz of SSB per day. The mechanisms linking SSB and adiposity are not entirely clear, but it has been speculated that SSB can lead to weight gain through several different pathways independent of high-added sugar content. For example, consumption of SSB may result in an incomplete compensatory reduction in energy intake at subsequent meals after intake of liquid energy, and/or unregulated hepatic uptake and metabolism of fructose, which in turn leads to liver lipid accumulation, dyslipidaemia, decreased insulin sensitivity and increased uric acid levels( Reference Malik, Pan and Willett 46 , Reference Stanhope 49 ). On the contrary, a diet rich in fruits and vegetables has been shown to be associated with lower adiposity and less weight gain( Reference Newby, Muller and Hallfrisch 50 ). In one study, an increase in the intake of fruits and vegetables reduced the long-term risk of obesity and weight gain among middle-aged women( Reference He, Hu and Colditz 51 ). The mechanisms for the inverse association between fruit and vegetable intakes and body weight may include a higher intake of dietary fibre and polyphenols as wells as greater satiety( Reference Bell, Castellanos and Pelkman 52 – Reference Rangel-Huerta, Aguilera and Martin 54 ).
Our understanding of the complex regulation of pro-inflammatory adipokines under varying dietary patterns remains limited. Studies investigating a wider spectrum of food groups, nutrients or adipokines are scant and the effects of fruits, vegetables and SSB on the regulation of adipokines are not well defined( Reference Schwingshackl and Hoffmann 19 – Reference Tabung, Smith-Warner and Chavarro 23 ). In the present study, the main correlates of a diet with high SSB and low fruit and vegetable intake were increased CRP, leptin and MCP-1, and decreased SFRP-5, which is consistent with metabolic dysfunction as found in obesity( Reference Dunmore and Brown 17 , Reference Deshmane, Kremlev and Amini 55 , Reference Ouchi, Higuchi and Ohashi 56 ).
Leptin, an adipokine that regulates energy balance, has been widely studied with regard to dietary associations and has often been measured with the pro-inflammatory marker CRP( Reference Dunmore and Brown 17 , Reference Chen, Li and Li 57 – Reference Yeh and Willerson 59 ). Leptin has an important role in regulation of glucose homeostasis, independent of its actions on food intake or body weight( Reference Freitas Lima, Braga and do Socorro de Franca Silva 60 ). In a feedback loop, insulin stimulates leptin secretion from adipose tissue, while leptin inhibits insulin biosynthesis and secretion( Reference Freitas Lima, Braga and do Socorro de Franca Silva 60 ). Insulin resistance is associated with hyperleptinaemia and selective leptin resistance in individuals who are obese( Reference Abella, Scotece and Conde 61 ). Leptin plays a crucial role in inflammatory pathways and increases the secretion of TNF-α, IL-6 and MCP-1( Reference Koh, Park and Quon 62 ). Human CRP is correlated with increased adiposity and plasma leptin. Circulating CRP binds to leptin, attenuates its physiological functions and may contribute to leptin resistance( Reference Chen, Li and Li 57 ). A high consumption of fruits and vegetables has been associated with lower CRP in several( Reference Neale, Batterham and Tapsell 21 , Reference Bhupathiraju and Tucker 63 – Reference AlEssa, Ley and Rosner 70 ) but not in all studies( Reference Fisk, Middaugh and Rhee 64 , Reference McCall, McGartland and McKinley 71 – Reference Williams, Baines and Berthon 74 ). The effects reported may be explained by their effect on energy balance and body weight( Reference Bhupathiraju and Tucker 63 , Reference Fisk, Middaugh and Rhee 64 , Reference Navarro, de Dios and Jois 68 , Reference Heinonen, Laaksonen and Karhu 75 ). In two studies, the association between the consumption of fruits and vegetables with lower CRP became insignificant after adjusting for adiposity( Reference Fisk, Middaugh and Rhee 64 , Reference AlEssa, Ley and Rosner 70 ). In several other studies, the results were not adjusted for adiposity( Reference Neale, Batterham and Tapsell 21 , Reference Bhupathiraju and Tucker 63 , Reference Navarro, de Dios and Jois 68 ). The results from the present study indicated that a diet low in fruits and vegetables but high in SSB is associated with higher leptin and CRP but this association is mainly through adiposity.
In addition to these findings, we identified substantial contributions of SSB and fruit/vegetable consumption to levels of MCP-1 and SFRP-5. MCP-1 is one of the key chemokines regulating the migration and infiltration of monocytes and macrophages( Reference Deshmane, Kremlev and Amini 55 , Reference Kanda, Tateya and Tamori 76 ) and drives obesity-related inflammation and insulin resistance( Reference Freitas Lima, Braga and do Socorro de Franca Silva 60 ). An increase in adipocyte mass is related to an increase in MCP-1, which in turn increases the production of other pro-inflammatory adipokines such as IL-6 and TNF-α, leading to a down-regulation of adiponectin, decreased glucose uptake in muscle cells and a metabolism favouring glycogenolysis and gluconeogenesis( Reference Freitas Lima, Braga and do Socorro de Franca Silva 60 , Reference Kanda, Tateya and Tamori 76 ). Systemic insulin resistance, lipid accumulation in the liver and hepatic insulin resistance form are the consequences( Reference Rui 77 ). Although circulating levels of MCP-1 are increased in overweight and obese individuals( Reference Kim, Park and Kawada 78 , Reference Sartipy and Loskutoff 79 ), little is known about the association between dietary factors and MCP-1. In a small study of young Taiwanese women, a daily tomato juice supplementation resulted in reduced MCP-1 but did not affect leptin concentrations( Reference Li, Chang and Huang 80 ). In mice, a high-fat diet increased the expression of MCP-1( Reference Cranford, Enos and Velazquez 81 ). Another recent study indicates that MCP-1 may play a key role in hyperglycaemia-induced inflammation that was alleviated after short-term insulin therapy in newly diagnosed patients with type 2 diabetes( Reference Lin, Ye and He 82 ). We previously reported that increasing adiposity contributed to a worsening imbalance of pro- and anti-inflammatory adipokines over time, but the canonical correlation between adiposity and MCP-1 was small( Reference Black, Shu and Wu 83 ). Results from the present study suggest that a high consumption of SSB and low consumption of fruit and vegetables lead to increased MCP-1 concentrations. Future studies have to reveal if this association is mediated by obesity or if MCP-1 has a direct role in up-regulating inflammation in response to diet.
SRFP-5 is an adipokine with possible insulin sensitising and anti-inflammatory properties which leads to improved metabolic function in white adipose tissue cells( Reference Ouchi, Higuchi and Ohashi 56 ). SRFP-5 is an inhibitor of the Wnt signalling pathway, which is an important factor in energy balance regulation( Reference Helfer and Tups 84 ). In a recent study, recombinant SRFP-5 significantly alleviated the expression of pro-inflammatory adipokines (IL-1β, IL-6, TNF-α and MCP-1) in the liver of a mouse model with induced non-alcoholic fatty liver disease( Reference Chen, Zhao and Liang 85 ), suggesting a link between SRFP-5 and MCP-1 consistent with findings from the present study. However, studies on its role in humans are scant and results are somewhat conflicting( Reference Helfer and Tups 84 , Reference Herder, Carstensen and Ouwens 86 ). No studies could be identified linking a healthy dietary pattern to an increase in SRFP-5. However, energy restriction and weight loss were associated with improved insulin sensitivity and an increase in SRFP-5 in adults( Reference Schulte, Muller and Neumann 87 ) and children( Reference Tan, Wang and Chu 88 ) with obesity. In the present study, a high consumption of fruit and vegetables was associated with higher SRFP-5, and a high SSB consumption with lower SRFP-5 concentrations.
There are several strengths to this study. The large cohort of Mexican Americans without type 2 diabetes allowed us to identify significant dietary drivers of a wide range of pro- and anti-inflammatory adipokines, which has not been available in the literature to date. Use of CCA allowed us to capture the underlying multivariate correlation of multiple adipokines and multiple dietary factors to better understand their joint relationships while accounting for the collinearity among them. Our detailed measures of adiposity allowed us to investigate the association between dietary factors, adiposity and adipokines as well as to assess the role of adiposity in the relationship between diet and adipokines. The dietary factors represent the most important food groups and the adipokines were chosen to reflect relevant pro- and anti-inflammatory markers associated with β-cell dysfunction( Reference Abranches, Oliveira and Conceicao 4 , Reference Ko, Park and Mantzoros 6 , Reference Sanchez, Miguel and Aleixandre 7 , Reference Matsuzawa 13 , Reference Dunmore and Brown 17 , Reference Fantuzzi 89 , Reference Wang, Bao and Liu 90 ). Our study provides a unique insight in the complex joint relationship between diet, adiposity and adipokines.
Several potential limitations should be mentioned. The cross-sectional design of the present analyses precluded us from assessing the impact of changes in dietary factors on changes in adiposity and adipokine profiles over time. Our results demonstrate associations, so no causal conclusions can be made. We acknowledge that using a single dietary assessment may not account appropriately for within-subject variability. However, the FFQ has been validated and the food-based measures of dietary factors were reasonably accurate, although the FFQ tends to over-represent socially desirable foods( Reference Salvini, Hunter and Sampson 91 ). Finally, results from this cohort of predominantly female Mexican Americans with a high prevalence of overweight and obesity may not be generalisable to other populations.
In conclusion, a diet high in SSB and low in fruits and vegetables may be associated with increased adiposity and a pro-inflammatory adipokine profile characterised by higher leptin, CRP and MCP-1 and lower anti-inflammatory SFRP-5 in Mexican Americans compared with a diet low in SSB and high in fruits and vegetables. Additional longitudinal studies, in a variety of populations, are warranted to understand the long-term implications and underlying mechanisms.
Acknowledgements
The authors thank the families who participated in the BetaGene Study and also acknowledge the efforts of our recruiting and technical staff.
This work was supported by grants R01-DK-100302 and R01-DK-061628 from the National Institute of Diabetes and Digestive and Kidney Diseases (NIDDK), and by grant UL1-TR-001845 from the National Center for Advancing Translational Science, National Institutes of Health (NIH).
The authors have no potential conflicts of interest relevant to this article.
Supplementary material
For supplementary material/s referred to in this article, please visit https://doi.org/10.1017/S0007114518002726


