


The first years of life are characterised by rapid growth and development thus requiring greater nutritional needs(1). Considering the increased biological vulnerability of this age group to nutritional deficiencies and deviations, the quantity and quality of food consumed by the baby during early childhood are highly relevant as it may affect them with increased risk of disease in the long term, until adulthood(Reference Ou-yang, Sun and Liebowitz2).
Recent decades have shown a scenario where infant food and children’s feeding, whether born at term or not, is far from ideal(Reference Mello, Barros and de Morais3). Consumption rates of fresh food and healthy culinary preparations are on decline, with an exaggerated and early increase in the intake of ultraprocessed foods, characterised by having high energy density, and excess of free sugar, total and saturated fats and Na, and lower content of fibres and micronutrients when compared with unprocessed or minimally processed foods(Reference Mello, Barros and de Morais3,Reference Carvalho, Fonsêca and Priore4) . Such a feeding pattern has been shown to be associated with unfavourable outcomes in children such as asthma, lipid profile change, greater waist circumference and obesity(Reference Batalha, França and da Conceição5,Reference Monteiro, Cannon and Lawrence6) . Factors such as prematurity, small or large for gestational age (GA), and low or high birth weight have been shown to increase the risk of childhood obesity(Reference Ou-yang, Sun and Liebowitz2).
Given this context, the use of instruments for food quality assessment can be considered an essential resource for dietary evaluation and, consequently, for more efficient food guidance for different age groups, especially children(Reference Martinchik7).
Among the existing instruments, the Healthy Eating Index (HEI) was developed by Kennedy et al. in 1995(Reference Kennedy, Ohls and Carlson8), in the USA. The main objective of this index was to measure the global food quality of the population, incorporating, into a single measure, the nutritional needs and dietary guides for American consumers, according to the recommendations of the American Dietetic Association(Reference Kennedy, Ohls and Carlson8,Reference Bowman, Lino and Gerrior9) . The HEI evaluates the diet in general, incorporating the presence of the main food groups and their amounts (in portions) and of certain nutrients that, when consumed in excess (Na, saturated fat, cholesterol, among others), can cause harm to health, as well as identifying the variability of the diet(Reference Previdelli, De Andrade and Pires10).
Since its creation, the original HEI was reformulated over the years(Reference Guenther, Reedy and Krebs-Smith11–Reference Krebs-Smith, Pannucci and Subar13) to reflect changes made in American recommendations. This instrument has been adapted for different populations and age groups(Reference Previdelli, De Andrade and Pires10,Reference Mota, Rinaldi and Pereira14,Reference Rauber, da Costa Louzada and Feldens15) , as well as for other countries(Reference Marshall, Burrows and Collins16), including Brazil(Reference Morais, Moraes and da Silva17). Despite being widely used to assess the quality of a population’s diet, few studies have used HEI to assess the diet of pre-schoolers(Reference Morais, Moraes and da Silva17–Reference Leal, Schneider and França19), fewer for children under 2 years of age(Reference da Conceição, de Oliveira and Rizzin20) and none to evaluate the quality of the diet of children born preterm.
Given this context and the cultural characteristics of each country’s diet, Conceição et al. (Reference da Conceição, de Oliveira and Rizzin20) elaborated an adapted HEI that proved valid to evaluate the quality of the diet of children between 1 and 2 years old, using ‘Food Guide for Children: Ten steps for healthy eating’ proposed by the Brazilian Ministry of Health(21) published in 2013 as a basis. However, new Brazilian recommendations were proposed for children under 2 years and published in 2019(22), among them contraindicates the presence of ultraprocessed foods in children’s diet. In view of this update, it is necessary to consider the concept of ultraprocessed foods in current evaluations and it is essential to develop a new adaptation.
This study thus aims to evaluate the cross-cultural measurement equivalence of the HEI for children aged 1–2 years and to analyse the quality of the diet of premature children aged between 1 and 2 years of corrected age (CA).
Methods
Study design and population
This was a cross-sectional study conducted with preterm infants born between October 2008 and December 2019 in Perinatal Centers of Pedro Ernesto University Hospital and Gaffrée Guinle University Hospital, located in the city of Rio de Janeiro, Brazil. This study is part of a larger research project developed by the Neonatology Department with the main objective of evaluating the clinical and nutritional evolution of high-risk preterm infants during follow-up. The sample was non-probabilistic and consisted of all preterm infants who were assisted in specialised outpatient clinics (follow-up) in both hospitals after hospital discharge until they reached a CA of the second year, totalising 106 preterm infants selected by convenience.
The inclusion criteria considered preterm births of GA <37 weeks and at least one dietary record every 6 months between 1 and 2 years of CA. Preterm infants who presented conditions that could interfere with dietary parameters – for example, major malformations, chromosomal disorders, hydrocephalus, necrotising enterocolitis, grade ≥3 intraventricular haemorrhage, congenital infections, children of diabetic mothers, use of illicit drugs by the mother or severe neuropathy – were excluded. This study was approved by the Research Ethics Committee of University Hospitals (protocol 3.301.859).
Data collection
Demographic, anthropometric and maternal information were extracted from the attendance protocol regarding the admission of premature infants at the follow-up clinics between March and December 2019. To estimate the CA of the child, the estimated date of delivery was considered. The preterm infants were classified as small for GA, appropriate for GA, large for GA, with birth weight percentile of <p10, p10–90 and >p90, respectively, according to the curves and classification proposed by Fenton et al.(Reference Fenton and Kim23). Extremely low birth weight preterm infants weighed <1000 g, very low birth weight preterm infants who weighed <1500 g and BW infants were those who weighed <2500 g(24). These variables are self-explanatory and presented in the tables of the Results section.
Dietary assessment
Dietary data were collected from standardised 24-h recalls (R-24h) for each patient in one of the following CA periods: between 11 and 13 months; between 14 and 20 months or between 23 and 26 months. However, only the first R-24h obtained from each patient was considered in analysis; this choice was made from the understanding that evaluating the quality of the child’s diet before receiving the dietetic guidelines from the health team would be more reliable. Preterm children dietary intake was estimated by R-24h obtained during the consultations by personal interviews using the multiple-pass method(Reference Conway, Ingwersen and Vinyard25), in which the mothers were asked by a trained nutritionist for all food items, preparations, infant formulas, dairy products and other beverages consumed by the premature infant in the day before the consultation, from the first to the last meal. For an auxiliary description of the size of the portions consumed and recorded at each visit, a photo album with portions of food, tools and standardised measures was used. The R-24h form used in the study was the same for both hospitals.
The dietary intake was assessed by Avanutri Revolution® software, which uses the Brazilian Food Composition Table (Tabela Brasileira de Composição de Alimentos) as its basis(26).
Diet quality measurement tool
Diet quality was analysed by an adaptation of the original HEI instrument by Kennedy et al. (Reference Kennedy, Ohls and Carlson8). This instrument underwent a process of cross-cultural adaptation, including its translation from English into Brazilian Portuguese by the researchers included in this research. After the translation and retranslation process, the resulting instrument was a modified version that still contemplated the following changes: (1) inclusion of the consumption of ultraprocessed foods, following the NOVA classification(Reference Monteiro, Cannon and Lawrence6); (2) exclusion of the item cholesterol; (3) separation of the group of legumes items from the group of meat and (4) use of dietary recommendations for Brazilian children aged between 12 and 24 months(27,28) to determine food portions according to the food group (kcal).
The instrument proposed contemplates eleven items: (1) cereals, vegetable tubers and bread; (2) total vegetables; (3) fruits and fruit juices; (4) milk and derivatives; (5) meat and eggs; (6) legumes (beans); (7) ultraprocessed foods; (8) total fat; (9) saturated fat; (10) Na and (11) variety of the diet (Table 1). The proposed instruments are available in online Supplementary Table S1.
Table 1. Healthy Eating Index adapted for children aged 1–2 years
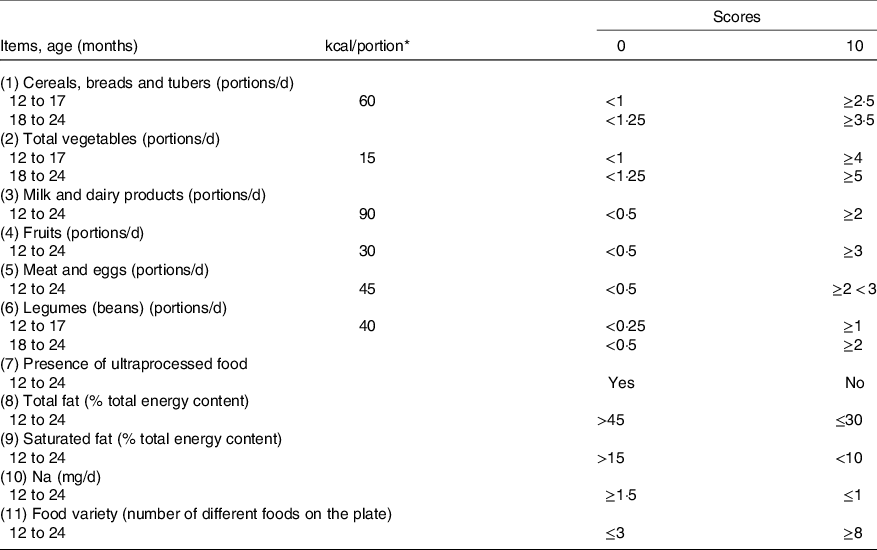
* To convert kcal to kJ, multiply by 4·184.
The culinary preparations consumed had their ingredients dismembered by food group. Within the milk group, the daily intake of maternal milk was estimated by the method proposed by Drewett et al. (Reference Drewett, Woolridge and Jackson29), in which the volume of breast milk consumed was predicted using various linear regression models that include the number of feeds per d, the energy provided by the complementary feeding (kcal) and the age of the child (in d). The intake of energy (4·184 kJ (1 kcal)/100 ml) and protein (g) from breast milk was estimated considering the volume of breast milk consumed by premature infants.
Only foods referring to the first six items of the instrument (food groups) were considered in the diet variety analysis. The foods considered similar (such as meat cuts or types of cheese) were grouped, as well as those prepared in various ways (such as boiled or roasted potatoes). Their classification varied according to the number of foods present in each group.
The ultraprocessed group considered as industrialised foods those made with five or more ingredients such as salt, sugar, oils, fats and food additives(Reference Monteiro, Cannon and Lawrence6) (chips, snacks, ham, sausage, nuggets, ham, bacon sausage, candies, chocolates, milk drinks, biscuits, stuffed cakes, honey, soft drinks, powdered drink mix, powdered chocolate mix, ice cream, industrialised juices and soups, instant noodles).
When necessary, portions were differentiated by age groups to meet the respective nutritional recommendations for age. For children with consumption equal to or greater than the recommended portions of the food groups, 10 points were attributed. When a group was not consumed, 0 score was assigned. For all items, where possible, proportional values were assigned. For the score of the items total fat, saturated fat and Na, the parameters recommended by the Institute of Medicine(28,Reference Uauy and Dangour30) were adopted for each age group. Thus, the score for each of the adapted HEI items ranged from 0 to 10 points. Since the Dietary Guidelines for the Brazilian Population recommend avoiding ultraprocessed foods for children under 2 years, the presence or absence of ultraprocessed foods in the diet received score 0 and 10, respectively.
The HEI score for items 1–7 (food groups and ultraprocessed food consumption) received a value of 50 %. The other 50 % of the score went to items 8–11 (micronutrients and diet variety). Therefore, the total score can range from 0 to 100 points. To classify the diet quality, values above 80 points were characterised as of adequate quality; between 51 and 80 points as requiring improvement (regular) and values below 51 points as a poor diet(Reference Kennedy, Ohls and Carlson8).
The proposed instrument can be applied to evaluate the diet quality of children born preterm or at term due to the similarity of nutritional recommendations after 1 year, and the evaluation is performed by the CA, instead of chronological age(31).
Statistical analysis
Descriptive analysis of the study population was expressed in measures of central tendency (mean or median) accompanied by their dispersion (sd or interquartile range) depending on the symmetry of their distribution for continuous variables and relative and absolute frequencies for categorical variables.
The proposed HEI measurement equivalence was assessed via internal consistency analysis and inter-observer reliability and the validity of the construction. Cronbach’s α-coefficient was used to evaluate internal consistency following the criteria of Nunnally & Bernstein(Reference Nunnally and Bernstein32), in which α ≥ 0·70 is considered appropriate. κ with quadratic weighting was used to estimate inter-observer reliability. The weighted κ was estimated separately for each item, with 95 % CI obtained by bootstrap. The values obtained were interpreted according to the criteria proposed by Shrout (1987)(Reference Shrout, Spitzer and Fleiss33) (moderate: 0·60–0·79, substantial: ≥0·80).
Principal component analysis (PCA) was used to obtain the eigenvalues and then to elaborate the scree plot. The model used varimax rotation to evaluate the correlation between all items of the proposed instrument. Eigenvalues >1 refer to the number of factors to be maintained(Reference Damásio34).
The validity of a construct assesses whether the instrument can measure what is proposed. This study used Spearman’s coefficient to evaluate the correlation between the total score obtained by the proposed HEI and the amount of energy ingested from the diet, as well as evaluated the score by each item of the instrument. The associations between descriptive variables collected at birth (sex, skin colour, GA, weight adequacy for GA, prematurity status, maternal age, education level and birth weight) and the quality of diet were analysed through a logistic regression model. In this analysis, the diet quality variable was treated as a binary variable (adequate v. not adequate). Data analysis processes used the STATA software version 15.0 (Stata Corp LLC), considering a 95 % significance level.
Results
Initially, 140 care protocols were tracked. Among them, 28 R-24h were discarded because it was impossible to obtain information on the amounts of food consumed by preterm infants. Six children were excluded because they had clinical conditions that did not meet the inclusion criteria, resulting in a final sample of 106 patients.
Regarding the total, most preterm births were female (53·8 %), white skin colour (51·4 %), with very low birth weight (50·9 %), but with appropriate weight for GA (62·3 %). Regarding maternal characteristics, 56·7 % mothers completed high school and 25·5 % had ≥35 years of age at delivery (online Supplementary Table S2).
In the reliability analysis, Cronbach’s α-coefficient was 0·54. Regarding inter-observer reliability, ten of the eleven diet items showed strong agreement. The item related to the consumption of ultraprocessed products had perfect agreement (κ = 1·00), whereas the item of milk and dairy products had the lowest agreement (κ = 0·57) (Table 2). The scree plot (Fig. 1) showed the presence of two factors representing 47·6 % of the total variance of the adapted HEI.
Table 2. Internal consistency, inter-observer reliability and item-to-item endorsement (n 106)
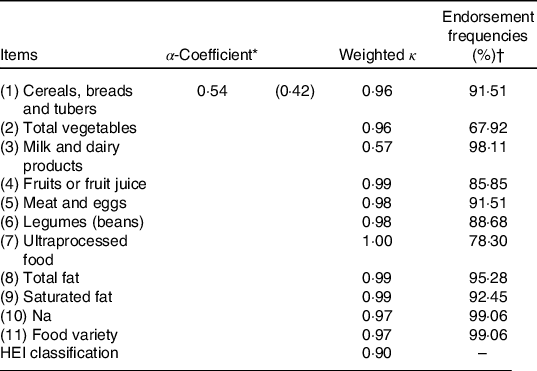
HEI, Healthy Eating Index.
* Minimum α-coefficient limit.
† Proportion of children scored 2·5, 5, 7·5 or 10. With the exception of the ultraprocessed item that refers to those scored 0, that is, those who obtained consumption.
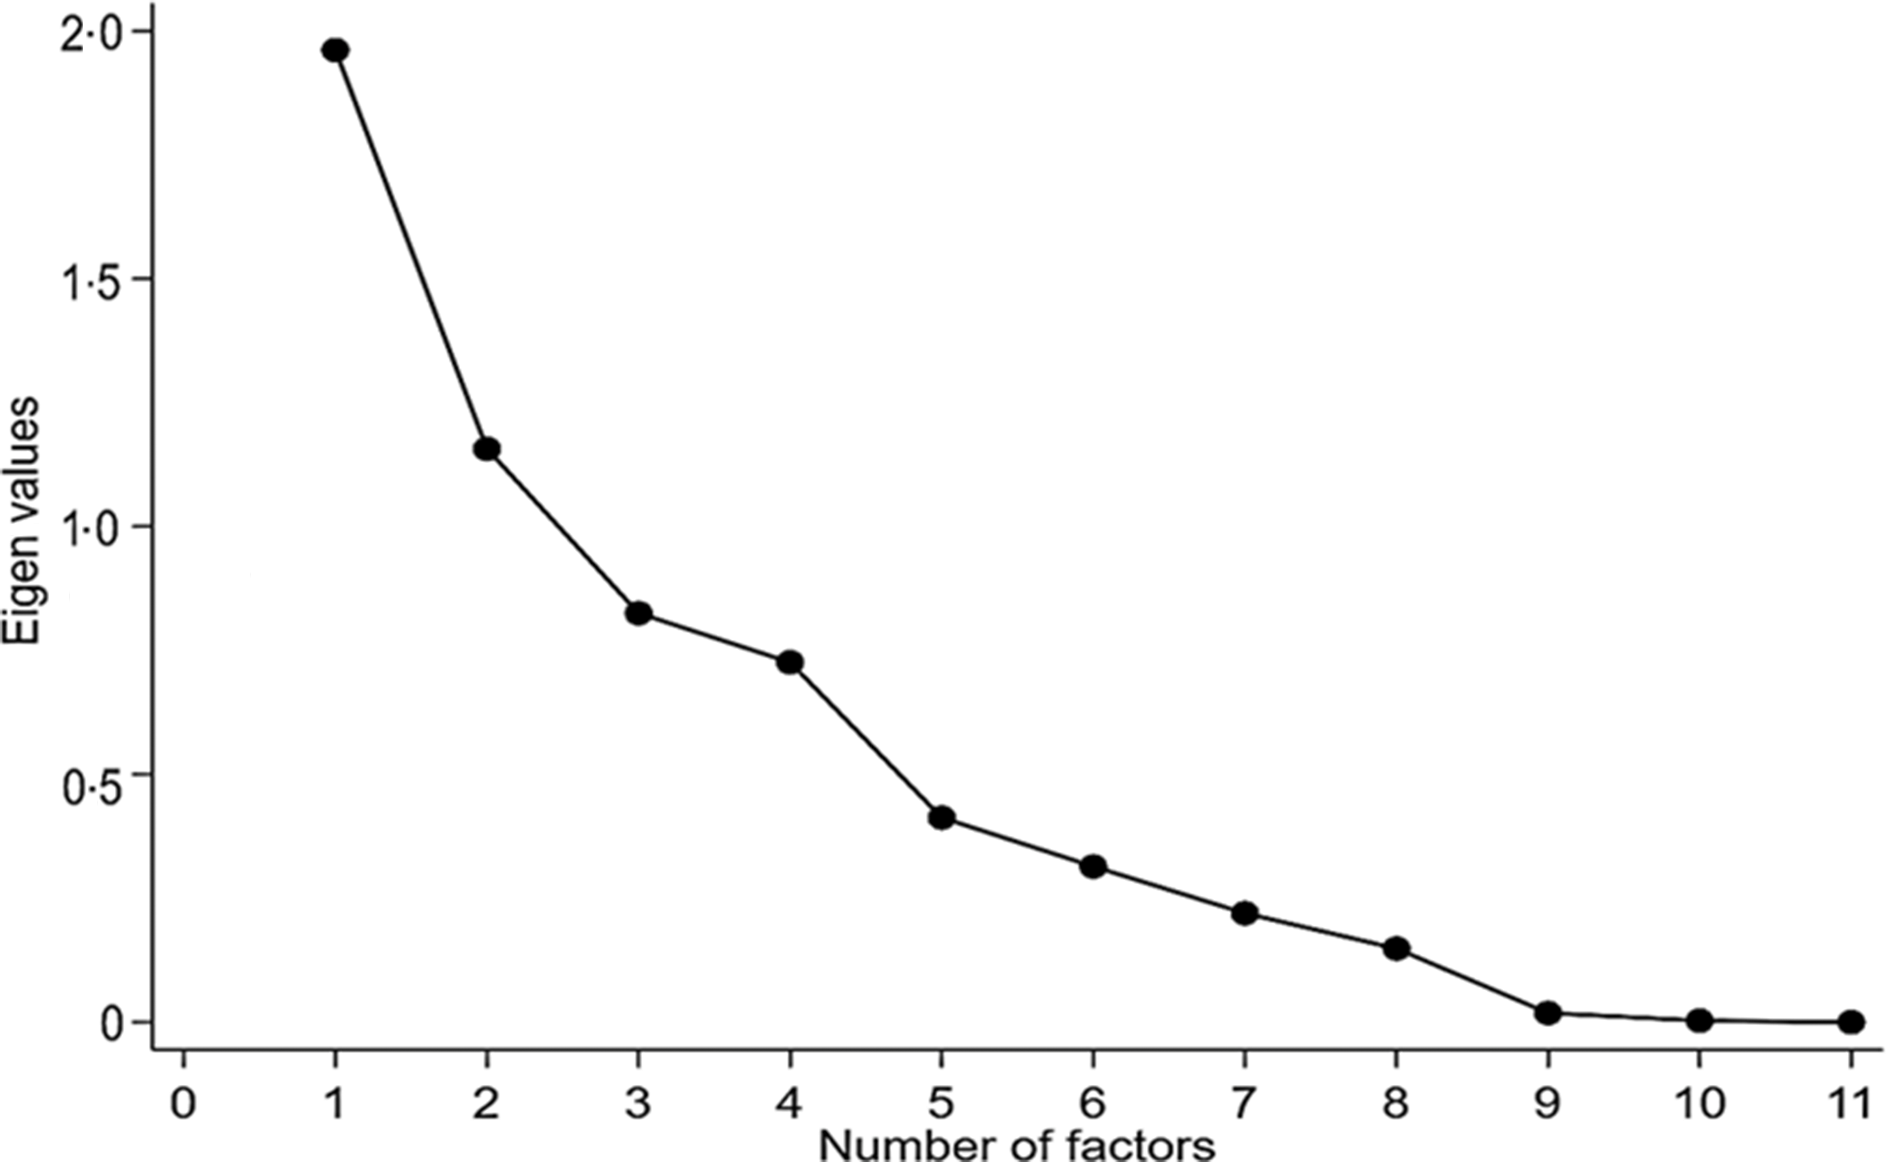
Fig. 1. Scree plot of main component analysis of adapted Healthy Food Index.
Table 3 shows the results of the correlation between the scores of the items of the proposed instrument and the total score and the energy consumed. The scores of the items of the adapted HEI presented low correlations with energy consumed (r ≤ 0·37), and only for Na (P = 0·02), the correlation was negative.
Table 3. Spearman correlations between Healthy Eating Index (HEI) item scores adapted to total score and energy consumed by children aged 1–2 years (n 106)
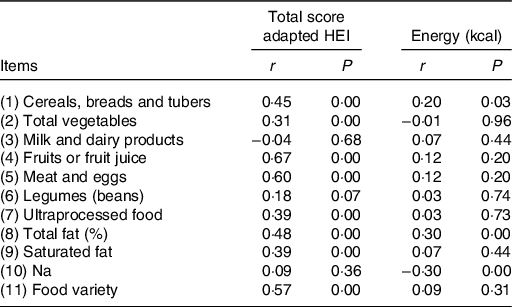
Regarding the correlation between the total HEI scores and the instrument’s items, it was observed a positive and moderate correlation with fruits (r 0·67), meat (r 0·60) and with the variety of the diet (r 0·57). Moreover, 75 % of the premature children consumed at least two portions of fruits and more than half (69 %) consumed, on average, 70 g of meat per d (data not shown). Regarding the items milk and dairy products, Na and legumes (beans), no correlations were observed between the total HEI and the score obtained from these items (Table 3).
Table 4 and online Supplementary Table S3 show the medians and the means of the score for each of the eleven items of HEI according to total sample and sex, respectively. From the maximum of 100 achievable points, the median was 78·7, ranging from 70·4 to 85·3. The highest prevalence of 0 scores was attributed to the ultraprocessed item (78·3 %), followed by the total vegetables (32·1 %). On the other hand, the items of milk and dairy products (87·7 %) and beans/leguminous (85·8 %) were the most scored with 10. Regarding the items related to nutrients, almost all children were scored with the maximum score for Na intake (92·5 %). Regarding the variety of the diet, only 57·5 % had a varied diet. No significant difference was observed, by sex, between the HEI scores obtained in each item.
Table 4. Healthy Eating Index score for each item according to sex and percentage of maximum (10) or minimum (0) score for each item investigated
(Median values and interquartile ranges (IQR))

* Mann–Whitney U test.
When investigating the association between the HEI score and the explanatory variables investigated, it was observed that the HEI score was higher among children born small for GA (P = 0·02) and in children of mothers who had at least high school education (P = 0·01) (Table 5). The evaluation of the quality of the diet of premature infants by the instrument showed that only 44·3 % had received an adequate diet (Table 5).
Table 5. Median Healthy Eating Index (HEI) score according to demographic, child’s anthropometric and maternal variables and classification of diet quality
(Median values and interquartile ranges (IQR); odds ratios and 95 % confidence intervals)
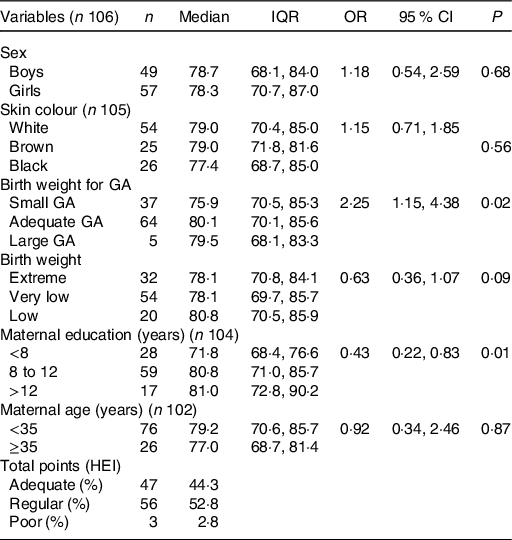
GA, gestational age.
Discussion
In this study, the adapted HEI evaluated the food groups and nutrients. The analyses of internal consistency, reliability and construct validity showed that the instrument is a promising and reproducible tool to be applied in the population of children between 1 and 2 years of age, including preterm infants. We must note that the HEI can be used to monitor changes in dietary patterns and as nutrition education instrument; thus, its application since early childhood is relevant since it is a period when eating habits are still under formation(Reference Lazarou and Newby35).
Despite a low Cronbach’s α value (0·54), it was still higher than that found in other studies such as Kennedy et al. (Reference Kennedy, Ohls and Carlson8), Guenther et al. (Reference Guenther, Reedy and Krebs-Smith11) and Conceição et al. (Reference da Conceição, de Oliveira and Rizzin20), whose values ranged from 0·28 to 0·48. Nevertheless, it was close to that observed by Guenter et al. (Reference Guenther, Casavale and Reedy12) (α = 0·59) and Horta et al. (Reference Horta, Junior and Santos36) (α = 0·58). This index allows the magnitude to which HEI items are correlated to be assessed, but comparison with other studies should be made with caution due to differences in the instrument (number of items analysed) and study population. The acts of eating and choosing a food are complex processes that involve several socio-cultural, demographic, economic and psychological factors(Reference Monteleone, Spinelli and Dinnella37). Many food choices can occur without full awareness, and therefore, individuals are not necessarily able to adapt to all the food standards imposed by society and/or outlined by food guides, which may, at least partially, justify the low coefficient found(22,Reference Cohen and Babey38,Reference Felippe, Balestrin and Silva39) .
The inter-observer reliability result shows that the proposed instrument presents good reproducibility. No previous study has evaluated this psychometric property. Future studies focusing on reliability evaluation are needed to evidence the stability and robustness of the instrument. The scree plot graph (Fig. 1) shows the presence of two factors. These factors represent 46·2 % of data variability. In the same age range, Conceição et al. (Reference da Conceição, de Oliveira and Rizzin20) observed four factors with 58 % variability. Other studies also conducted with children, although with different age groups, also found four factors, with 67 and 45·9 % of the total variance(Reference Caesar De Andrade, Nogueira and Dirce40,Reference D’Innocenzo, Marchioni and Prado41) . Regarding construct validity, the index scores presented low correlations with energy, suggesting that the indexes evaluate the quality of the diet regardless of the amount of energy ingested, a phenomenon also observed in other studies(Reference Guenther, Reedy and Krebs-Smith11,Reference Guenther, Casavale and Reedy12,Reference da Conceição, de Oliveira and Rizzin20) . The analysis of the micronutrient Na showed that it is negatively associated with energy, although in a weak way. We stress the difficulty in estimating the amount of Na used in food – especially added salt – due to the high probability of occurrence of underreporting of consumption.
Another relevant point in the study was the high consumption of ultraprocessed food products. These products should not be part of the diet of children under 2 years, since they are highly palatable, can cause dependence and interfere in the consumption of in natura and minimally processed foods; babies have low gastric capacity, creating conflicts between healthy foods and ultraprocessed ones. The consumption of ultraprocessed foods also negatively affects the self-regulation mechanism of hunger and satiety, which can be extremely harmful and lead to hypertension, CVD, diabetes, obesity, dental caries and cancer when consumed in excess(Reference Carvalho, Fonsêca and Priore4,Reference Batalha, França and da Conceição5,21,22,Reference Ortelan, Neri and D’Aquino Benicio42) . Attaining proper nutrition in the early years of life is critical to infant growth and development; moreover, dietary habits acquired early in life tend to persist not only into childhood but also into adulthood(Reference Ou-yang, Sun and Liebowitz2,Reference Batalha, França and da Conceição5) .
Although the consumption of ultraprocessed foods was prevalent in the study, we must note that other items such as fruit and meat, followed by the item ‘variety of the diet’, contributed more to the variation in the total score of the instrument. This shows that only premature children who presented adequate and varied consumption achieved a higher score in the total. These results are consistent when considering that 75 % of the investigated patients consumed at least two portions of fruit and 69 % about 70 g of meat per d. In contrast, the consumption of vegetables was unsatisfactory, since 32 % of the investigated patients did not eat any portion a day, which may be one of the reasons why this item had no correlation with the total score.
In general, children have a preference for fruit, which contributes to greater consumption rates of this food when compared with vegetables(Reference Ramsay, Shriver and Taylor43,Reference Korinek, Bartholomew and Jowers44) . Furthermore, an infant cohort study showed that the more often fruit was consumed between 12 and 16 months, the less likely preschool children were to report consumption of less than a daily portion of fruit(Reference Valmórbida and Vitolo45). Regarding vegetables, some studies argue that they are consumed less frequently and generally less preferred by babies due to attributes such as the bitter taste and fear of asphyxiation by the parents(Reference Ramsay, Shriver and Taylor43,Reference Nekitsing, Blundell-Birtill and Cockroft46) . Several researchers have shown a link between increased fruit and vegetable intake and lower body weight(Reference Lin and Morrison47,Reference Ledoux, Hingle and Baranowski48) as well as a reduced risk of chronic diseases, including CVD, diabetes, certain types of cancer and the metabolic syndrome(Reference Appleton, Hemingway and Saulais49).
We note that, although not correlated with the total HEI score, milk and vegetables were the items that presented the adequate consumption by most children, contributing to the probable adequacy of protein, Fe, folic acid, Ca and fibres in the diet of the evaluated babies(22).
Regardless of those findings, when looking at the overall quality of the diet, a little more than half of the children (52·8 %) need improvements in their diet. This fact can be mainly attributed to the low total vegetable intake and the presence of ultraprocessed foods in the diet of the studied population, a food scenario also present in other studies(Reference Bielemann, Santos and Costa50,Reference Lopes, De Pinho and Prates51) . However, the median score (78·7) obtained from the proposed HEI was higher than that in other studies conducted on infants and pre-schoolers(Reference Domene, Jackix and Raposo18,Reference da Conceição, de Oliveira and Rizzin20) .
Regarding the other explanatory variables investigated in the study, we found that only the variables birth weight to GA and maternal schooling were able to influence the quality of the diet. These findings may be partially justified due to parents’ anxiety in recovering the weight or stature of their children, especially for infants born with low birth weight according to GA, such worry often results in the early introduction of foods with high energy density and exposure to ultraprocessed products(Reference Valmórbida and Vitolo45,Reference Ribas, de Rodrigues and Mocellin52,Reference Norris, Larkin and Williams53) . The mothers in our study who had the most years of schooling were those whose children scored the highest (>80 points). These results are consistent with findings from other studies on infant feeding conducted in Brazil, as well as with studies from other countries(Reference Ortelan, Neri and D’Aquino Benicio42,Reference Ribas, de Rodrigues and Mocellin52,Reference Saldiva, Venancio and De Santana54,Reference Imdad, Yakoob and Bhutta55) .
Saldiva et al. (Reference Saldiva, Venancio and De Santana54) state that the consumption of unhealthy food by Brazilian children is influenced by their mother’s schooling. Children living in the capitals whose mothers have lower education level are 2–3 times more likely to consume ultraprocessed juices, soft drinks and sugary foods than the children of mothers with higher schooling level. These studies increase the evidence of the role of education in the improvement of knowledge, including the diet(Reference Al-Shookri, Al-Shukaily and Hassan56).
The major strength of this study is related to the instrument itself. Indexes that evaluate the quality of the diet in children supported by validation studies or the evaluation of nutritional adequacy are still rare, especially when considering nutrients(Reference Marshall, Burrows and Collins16,Reference Lazarou and Newby35) . The analysis of the psychometric tests applied in our instrument proved to be promising for children born prematurely. The authors believe that this is a reproducible instrument to evaluate the quality of the diet of children between 1 and 2 years of age since the dietary guidelines are the same for children born prematurely or at term after 1 year of age(31).
To the best of our knowledge, this is the first diet quality assessment instrument for children between 1 and 2 years of age that considers the presence of ultraprocessed foods and the NOVA classification(Reference Monteiro, Cannon and Lawrence6).
The sample size can be considered a limitation of this study. This can be explained by the fact that, after hospital discharge, children born prematurely are directed to follow-up in health services in places closer to their homes instead of the hospital they were born. Still, premature newborns are more likely to have clinical impairments that were considered exclusion criteria in our study.
Finally, we note a question that has also been discussed in other studies(Reference Leal, Schneider and França19,Reference da Conceição, de Oliveira and Rizzin20) that adapted this index to be related to the score of the food groups of any HEI, that is, the fact that there is no difference in points even when exceeding the recommended portion for age, ignoring that such practice may contribute to the development of overweight condition in the medium and long term. Therefore, future studies must include maximum consumption limits in the instrument for both food groups and nutrients.
Conclusion
The proposed instrument has auspicious psychometric properties and is considered a promising tool for assessing the quality of the diet in children aged 1–2 years. However, future studies that contemplate the analysis of psychometric properties not contemplated in this study are needed to evaluate the configuration structure, metrics and scaling of this index. Furthermore, studies contemplating other contexts and populations are also necessary. The inclusion of scoring criteria in HEI for excess food consumption also requires better discussion by researchers in the area and incorporation into the index.
Acknowledgements
The authors are grateful to the families who participated in this study and the clinical investigators and their teams at the collaborating hospitals for their role in recruiting patients to this study.
This research received no specific grant from any funding agency, commercial or not-for-profit sectors.
S. A. R. contributed to the research conception, data collection, interpretation of results and critical revision of the article. E. S. M., M. T. T. and L. G. R. contributed to the data analysis and interpretation, drafting and critical revision of the article. G. P. C. R. and D. M. G. S. contributed to data collection, as well as the critical revision of the article.
The authors declare that there are no conflicts of interest.
Supplementary material
For supplementary materials referred to in this article, please visit https://doi.org/10.1017/S0007114520004729


