


The metabolic syndrome (MetS) is a common condition with increasing prevalence in most populations( Reference Kolovou, Anagnostopoulou and Salpea 1 ). Components of the MetS include abdominal obesity, dyslipidaemia, elevated blood pressure and dysglycaemia( Reference Alberti, Eckel and Grundy 2 ). These components are known risk factors for many chronic disease conditions; therefore, the MetS has been associated with CVD( Reference Mottillo, Filion and Genest 3 ), type 2 diabetes( Reference Ford 4 ), certain types of cancer( Reference Esposito, Chiodini and Colao 5 ) and mortality( Reference Ford 4 ).
Dietary patterns in relation to the prevalence of the MetS have been investigated in several studies( Reference Kesse-Guyot, Ahluwalia and Lassale 6 – Reference Yeh, Chang and Pan 14 ). Most studies investigated the Mediterranean diet( Reference Kesse-Guyot, Ahluwalia and Lassale 6 , Reference Gouveri, Tzavara and Drakopanagiotakis 7 ) or exploratory dietary patterns derived by principal component analysis (PCA)( Reference Akter, Nanri and Pham 8 , Reference Panagiotakos, Pitsavos and Skoumas 9 ) or factor analysis( Reference Naja, Nasreddine and Itani 10 – Reference Hong, Song and Lee 12 ). PCA and factor analysis are commonly applied exploratory methods to derive patterns that depend on dietary habits of the study population( Reference Hoffmann, Schulze and Schienkiewitz 15 ). Dietary patterns generated by PCA thereby explain maximum variation in food intake and, therefore, more likely reflect real-world dietary patterns( Reference Hoffmann, Schulze and Schienkiewitz 15 ). Factor analysis is also a data-reduction method that focuses on the underlying dependencies of explanatory variables( Reference Venkaiah, Brahmam and Vijayaraghavan 16 ). However, both PCA and factor analyses have been criticised for their subjectivity at several analytical steps( Reference Martinez, Marshall and Sechrest 17 ) and for being poorly related to disease risk( Reference Newby and Tucker 18 ). Reduced-rank regression (RRR), as a further dietary pattern method, allows the integration of disease-related response variables (e.g. biomarkers, subclinical or clinical endpoints) in the analysis, resulting in dietary patterns explaining maximum variation in selected response variables( Reference Hoffmann, Schulze and Schienkiewitz 15 ). Therefore, in most cases, dietary patterns derived by RRR are associated with the disease of interest and, thus, do not necessarily reflect real-world dietary habits( Reference Hoffmann, Schulze and Schienkiewitz 15 ). To our knowledge, only two studies, one in the USA( Reference Liu, Nettleton and Bertoni 13 ) and one in Taiwan( Reference Yeh, Chang and Pan 14 ), but none in Europe, applied RRR for generating dietary patterns that especially explain maximum variance in the criteria of the MetS.
Given that exploratory dietary patterns vary between populations and are often difficult to interpret, simplified dietary patterns may overcome these problems( Reference Schulze, Hoffmann and Kroke 19 ). With this method, food groups that are highly correlated with the pattern are summed up to calculate a new pattern score.
The aim of the present study was to compare dietary patterns derived by PCA and RRR in a Northern German cohort. Due to differences in the underlying methodology, we expect that PCA-derived patterns reflecting dietary behaviour are different from the rather disease-related RRR patterns and that RRR patterns are more strongly associated with the MetS.
Subjects and methods
Study design and population
The study population comprising 1317 participants, aged 19–77 years, was recruited by the PopGen Biobank as a control cohort for disease-specific study populations( Reference Krawczak, Nikolaus and von Eberstein 20 ). In particular, this cohort is composed of 747 participants determined as a random sample of the general population of Kiel by the local population registry and additional 569 blood donors. Baseline examinations were conducted between 2005 and 2007. Between 2010 and 2012, participants were invited for follow-up visits for assessments including physical examinations, blood sampling and questionnaires on demographic and health-related characteristics, medical history and diet. A total of 952 subjects participated in follow-up examinations. For the present analysis, we used the data from the follow-up examination only. We excluded participants from the analysis with missing data on dietary intake (n 17), characteristics of the MetS (n 20) or potential confounders (n 9), or due to implausible energy intake of >33 494 kJ/d (>8000 kcal/d) (n 1). Therefore, a final number of 905 participants were included in the present cross-sectional analysis.
The present study was conducted according to the guidelines laid down in the Declaration of Helsinki, and all procedures involving human subjects were approved by the ethic committee of the Medical Faculty of the Christian-Albrechts University of Kiel. All participants gave their informed consent before participation.
Dietary assessment
Dietary intake was assessed during the follow-up by a validated, self-administered, semi-quantitative FFQ designed especially for the German population( Reference Nöthlings, Hoffmann and Bergmann 21 ). Participants were asked to report the frequency of consumption of 112 food and beverage items during the past year. Frequencies were categorised into four to eleven options ranging from ‘never’, ‘once a month or less frequently’ to ‘once a day’ or ‘eleven times a day or more frequently’. Participants were also asked to indicate whether they had changed their dietary habits during the last 12 months. Nutrient and energy intakes were determined using the German Food Code and Nutrient Data Base (version II.3).
Food and beverage items were grouped according to the similar nutrient profile and culinary usage, leading to a total of forty-two food groups (see online supplementary Table S1).
Assessment of non-dietary variables
A self-administered questionnaire was used to assess lifestyle and health-related variables such as years of education, smoking status and prevalence of chronic diseases. The latter include type 2 diabetes, CVD (heart attack, stroke or CHD) and cancer ever diagnosed by a physician. Furthermore, type 2 diabetes was defined as a glycated Hb (HbA1c) level ≥ 6·5 % and/or intake of anti-diabetic drugs. Hours of physical activities (walking, cycling, sports, gardening, do-it-yourself activities and household tasks) per week were assessed by a self-administered questionnaire. Hours of physical activities per week were multiplied by the corresponding metabolic equivalent tasks, according to Ainsworth et al. ( Reference Ainsworth, Haskell and Herrmann 22 ), and then summed up for all activities.
Standing height and weight were measured in light clothing without shoes. To correct for clothing, 2 kg were subtracted from the measured weight. BMI was calculated by dividing weight (kg) by the square of height (m2). Waist circumference was measured at the midpoint between the lower costal margin and the spina iliaca superior, and hip circumference was measured at the level of the trochanter major. The waist:hip ratio was calculated by dividing waist circumference by hip circumference. Blood pressure was measured two times using a sphygmomanometer in the sitting position and after the participants had rested for 5–10 min. Arithmetic means of systolic and diastolic blood pressure were calculated.
Participants were invited to provide fasting blood samples. To obtain the information about duration of fasting, participants were asked to report time since the last meal. Serum concentrations of TAG, total cholesterol, LDL- and HDL-cholesterol were measured by an enzymatic colorimetric assay (Hitachi Modular; Roche). HbA1c levels were determined by HPLC with photometric detection (D-10 HPLC analyser; Bio-Rad). Concentrations of glucose were measured using an enzymatic UV test (hexokinase method, Hitachi Modular; Roche).
Definition of the metabolic syndrome
The MetS was defined, according to the most recently published harmonised criteria( Reference Alberti, Eckel and Grundy 2 ), as the presence of at least three out of the five following criteria: (1) central obesity (waist circumference >80 cm for women and >94 cm for men); (2) elevated TAG concentration ( ≥ 1·7 mmol/l or ≥ 150 mg/dl); (3) reduced HDL-cholesterol concentration ( < 1·0 mmol/l or < 40 mg/dl for men; < 1·3 mmol/l or < 50 mg/dl for women); (4) elevated blood pressure (systolic blood pressure ≥ 130 mmHg or diastolic blood pressure ≥ 85 mmHg) or antihypertensive drug treatment; (5) dysglycaemia determined as elevated fasting glucose concentration ( ≥ 5·6 mmol/l or ≥ 100 mg/dl) or anti-diabetic medications. Information about lipid-lowering medication was not available in detail for all participants and therefore not included in the present definition. As fasting blood samples were not available from all participants, a cut-off point of 5·7 % for HbA1c, according to the American Diabetes Association( 23 ), was used to define dysglycaemia for those participants with missing fasting blood samples.
Statistical analyses
To derive dietary patterns, PCA and RRR were performed on forty-two food groups (g/d) by using the FACTOR and PLS procedure in SAS (SAS Institute, Inc.), respectively. For PCA, the orthogonal varimax rotation method was used. The methods and their application in nutritional epidemiology have been described in detail elsewhere( Reference Hoffmann, Schulze and Schienkiewitz 15 ). Waist circumference, TAG, HDL-cholesterol, systolic and diastolic blood pressure, and HbA1c were used as continuous response variables in the RRR analysis. To identify the optimal number of factors to extract, visual examination of the scree plot was used in the PCA, whereas random sample cross-validation and van der Voet's test( Reference van der Voet 24 ) were applied in the RRR analysis.
Pearson's correlation coefficients between food groups and derived dietary patterns were computed. Regression coefficients were calculated to determine the associations between original dietary pattern scores and anthropometric variables and biomarker levels. Non-normally distributed variables were log-transformed. Multiple linear regression analysis was performed to adjust for potential confounders that were not only selected based on the literature( Reference Naja, Nasreddine and Itani 10 , Reference DiBello, McGarvey and Kraft 25 ), but also statistically significantly associated with the dietary pattern score and the MetS. Therefore, age (years), sex, education level ( ≤ 9, 10 or ≥ 11 years), smoking status (never or < 3 months, former, or current smoker), physical activity (metabolic equivalent task-h/week), total energy (kJ/d) and study cohort (random sample of the general population or blood donors) were included in the analysis.
According to Schulze et al. ( Reference Schulze, Hoffmann and Kroke 19 ), simplified dietary patterns derived from the most important food groups in the PCA or rather the RRR analysis were generated to improve comparability and interpretability of both PCA- and RRR-derived patterns. In particular, for the purposes of comparison of PCA and RRR simplified dietary patterns, scores were calculated for the ten food groups with highest correlations with the original PCA and RRR dietary pattern scores. Therefore, food groups (g/d) were standardised (mean = 0, sd= 1) and summed up. In the case of inverse correlations, food groups were subtracted from the calculated score.
Multiple logistic regression analysis was performed to investigate the associations between the quartiles of simplified dietary pattern scores and the prevalence of the MetS, adjusting for potential confounders mentioned previously. In addition, interactions were tested between simplified dietary pattern scores and potential confounders.
A sensitivity analysis was performed to investigate the effect of simplified dietary patterns on the prevalence of the MetS after excluding the participants with prevalent CVD and cancer (n 237). We tested for potential under-reporting using the Goldberg revised method, applying a conservative approach with a physical activity level of 1·55, which assumes that all participants had a low physical activity level( Reference Mendez, Popkin and Buckland 26 , Reference Black 27 ). Of the potential under-reporters, 95 % indicated that they had changed their diet during the last year. We conducted a sensitivity analysis after excluding the participants with a reported dietary change (n 211) and, thus, also took into account the potential under-reporters. Furthermore, we performed the RRR analysis restricted to individuals with fasting blood samples (n 703), and included glucose instead of HbA1c levels as the response variable.
All statistical analyses were performed using SAS version 9.3 (SAS Institute, Inc.). Statistical significance was defined as a P value < 0·05.
Results
Of the 905 participants included in the analysis, 57·0 % were men (Table 1). The prevalence of the MetS was 43·2 %. The prevalence of central obesity was 74·1 %, elevated TAG 20·8 %, reduced HDL-cholesterol 6·5 %, hypertension 79·3 % and dysglycaemia 47·1 % (data not shown). The mean ages of the participants with and without the MetS were 64·8 and 57·5 years, respectively. Participants with and without the MetS statistically significantly differed in terms of BMI, waist circumference, waist:hip ratio, educational level, blood pressure, HDL-cholesterol, TAG and HbA1c levels. The prevalence of chronic diseases such as type 2 diabetes, CVD and cancer was higher in participants with the MetS.
Table 1 Characteristics of the participants of the Northern German cohort by metabolic syndrome (MetS) status (Arithmetic mean values and standard deviations; number of participants and percentages; n 905)

WHR, waist:hip ratio; HbA1c, glycated Hb.
* Differences in the characteristics of the participants with and without the MetS were tested for statistical significance using the χ2 test for categorical variables and the t test for continuous variables (non-normally distributed variables were log-transformed).
† Continuous variables.
‡ Categorical variables are presented as absolute frequencies.
Dietary pattern analysis
Visual examination of the scree plot suggested that the optimal number of factors to extract was two in the PCA, whereas random sample cross-validation and van der Voet's test indicated one extracted factor as adequate in the RRR analysis. For the purposes of comparability of behaviour-related with disease-related dietary patterns, we considered only the first extracted factor, respectively, explaining most variations in predictors (PCA) or responses (RRR). Pearson's correlation coefficients between the selected food groups and both the PCA- and RRR-derived dietary patterns are shown in Fig. 1 (food groups with Pearson's correlation coefficients for the PCA-derived pattern >0·20). A full list of correlation coefficients is given in online supplementary Table S2. The first dietary pattern derived by the PCA was characterised by high intakes of leafy vegetables, fruiting vegetables, root vegetables, cabbage, other vegetables, beef, pork, processed meat, vegetable oil, other fats, sauce and bouillon, and explained 5·1 % of the variation in food group intake. In contrast, the RRR-derived pattern was characterised by high intakes of potatoes, other vegetables, legumes, bread, beef, pork, processed meat, other fats, sauce, bouillon and low intakes of tea and pasta/rice. The RRR-derived pattern explained 7·2 % of the variation in the six response variables (waist circumference, TAG, HDL-cholesterol, systolic and diastolic blood pressure and HbA1c) and 4·8 % in the predictor variables (forty-two food groups). More specifically, highest percentages of variation explained were 16·8 % for waist circumference and 10·3 % for HDL-cholesterol. Furthermore, the amounts of variation explained in the remaining response variables were 7·4 % for HbA1c, 3·9 % for TAG, 3·6 % for systolic blood pressure and 1·5 % for diastolic blood pressure.
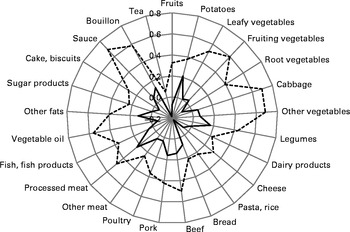
Fig. 1 Spider-web diagram of Pearson's correlation coefficients between two dietary patterns identified by principal component analysis (PCA, ![]() ) and reduced-rank regression (RRR;
) and reduced-rank regression (RRR; ![]() ) and selected food groups (Pearson's correlation coefficients for the PCA-derived pattern >0·20).
) and selected food groups (Pearson's correlation coefficients for the PCA-derived pattern >0·20).
Interestingly, the five most important food groups were not overlapping between the PCA- and RRR-derived patterns. However, among the ten food groups with highest positive correlations with the respective pattern, four were concordant, and among the fifteen most important food groups, ten concordant food groups were retrieved, i.e. potatoes, legumes, cabbage, other vegetables, pork, beef, processed meat, sauce, other fats and bouillon, reflecting a ‘traditional German diet’. Nevertheless, Pearson's correlation coefficient between PCA and RRR dietary pattern scores was rather small (0·11; P= 0·001), pointing out some differences in the weights of the food groups between the two derived dietary patterns. Furthermore, some food groups showed inverse correlations with the RRR-derived pattern (e.g. tea, pasta and rice), but moderate or low positive correlations with the PCA-derived pattern (see online supplementary Table S2).
After adjustment for sex, age, education, smoking status, physical activity, total energy intake and study cohort, the PCA-derived pattern showed statistically significant positive associations with BMI and waist circumference (Table 2). In particular, one unit increase in the PCA pattern score was associated with an increase in BMI of 0·57 kg/m2 and an increase in waist circumference of 1·32 cm after adjustment for potential confounders. As expected, the RRR-derived pattern was statistically significantly associated with all anthropometric measures, blood pressure and biomarkers, except total cholesterol. One unit increase in the RRR pattern score was associated with an increase in BMI of 2·51 kg/m2 and an increase in waist circumference of 7·13 cm after adjustment for potential confounders.
Table 2 Associations between original dietary pattern scores derived by principal component analysis (PCA) or reduced-rank regression (RRR) and participant characteristics or biomarkers† (β-Coefficients and 95 % confidence intervals, n 905)

WHR, waist:hip ratio; HbA1c, glycated Hb.
* P< 0·05.
† Regression coefficients were obtained by multiple linear regression analysis of dietary pattern scores.
‡ Adjusted for sex and age (years).
§ Adjusted for sex, age (years), education ( ≤ 9, 10 or ≥ 11 years), smoking status (never, former or current smoker), physical activity (metabolic equivalent task-h/week), total energy (kJ/d) and study cohort (random sample of the general population or blood donors).
∥ Original values were log-transformed.
The PCA simplified dietary pattern was composed of cabbage, fruiting vegetables, leafy vegetables, other vegetables, legumes, beef, processed meat, sauce, vegetable oil and bouillon. The RRR simplified dietary pattern was characterised by high intakes of potatoes, legumes, pork, beef, processed meat, margarine, other fats and bouillon, and low intakes of pasta/rice and tea. The correlation coefficients between the original and simplified dietary pattern scores were 0·95 (P< 0·001) for the PCA-derived pattern and 0·33 (P< 0·001) for the RRR-derived pattern. Both simplified dietary patterns showed a correlation of 0·59 (P< 0·001).
Associations between simplified dietary patterns and the metabolic syndrome
The associations between simplified dietary pattern scores and the MetS are presented in Table 3. The number of individuals with the MetS increased across the increasing quartiles of PCA and RRR simplified dietary pattern scores. Compared with the participants in the lower quartile, those in the upper quartile of PCA simplified dietary pattern scores had 1·92 times (95 % CI 1·21, 3·03) higher odds of having the MetS after adjustment for potential confounders. In contrast, the odds of having the MetS were 2·18 times (95 % CI 1·25, 3·81) higher for the participants in the highest quartile of RRR simplified dietary pattern scores compared with those in the lowest quartile. The generation of a simplified dietary pattern derived from food groups present in both PCA- and RRR-derived patterns was characterised by high intakes of legumes, beef, processed meat and bouillon. The OR for the MetS was 1·71 (95 % CI 1·04, 2·79) for the participants above the third quartile compared with those in the lower quartile, and thus more similar to the PCA simplified dietary pattern.
Table 3 Metabolic syndrome (MetS) across the quartiles (Q) of simplified dietary pattern scores derived by principal component analysis (PCA), reduced-rank regression (RRR) and a simplified pattern score derived from concordant food groups of both patterns* (Odds ratios and 95 % confidence intervals, n 905)
* PCA simplified pattern: high in legumes, beef, processed meat, bouillon, cabbage, fruiting vegetables, leafy vegetables, other vegetables, sauce and vegetable oil. RRR simplified pattern: high in legumes, beef, processed meat, bouillon, potatoes, pork, margarine, other fats, and low in pasta/rice and tea. Concordant simplified pattern: high in legumes, beef, processed meat and bouillon.
† Adjusted for age (years) and sex.
‡ Adjusted for age (years), sex, education ( ≤ 9, 10 or ≥ 11 years), smoking status (never, former or current smoker), physical activity (metabolic equivalent task-h/week), total energy (kJ/d) and study cohort (random sample of the general population or blood donors).
All tests for an interaction between dietary pattern scores and potential confounders were not statistically significant (data not shown).
A sensitivity analysis restricted to the participants without prevalent CVD or cancer (n 668) revealed attenuated OR for the MetS for the PCA (1·40, 95 % CI 0·82, 2·37) and RRR (1·79, 95 % CI 0·94, 3·44) simplified pattern scores, comparing the upper with the lower quartile. Testing for under-reporting revealed that 16 % of the participants were potential under-reporters; however, of these, 95 % (n 145) reported to have changed their diet during the last year. Restricting the analysis to the participants without a dietary change (n 694), thereby also excluding almost all potential under-reporters, the OR for MetS was 1·68 (95 % CI 0·99, 2·83) for the PCA simplified pattern score and 2·38 (95 % CI 1·25, 4·55) for the RRR pattern score after adjustment for potential confounders. Additionally, the RRR-derived dietary pattern was very similar when the analysis was restricted to the individuals with fasting blood samples and when glucose levels were included as the response variable (data not shown).
Discussion
The purpose of the present study was to compare two exploratory dietary patterns derived by PCA and RRR, and to investigate their association with the MetS in a Northern German cohort. We identified two similar dietary patterns that were characterised by high intakes of potatoes, various vegetables, beef, pork, processed meat, fats, sauce and bouillon. Both dietary patterns represent a ‘traditional German diet’ pattern. The PCA-derived pattern showed statistically significant positive associations with BMI and waist circumference only, whereas the RRR-derived pattern, as expected, was associated with all individual components of the MetS and all anthropometric measures and biomarkers, except total cholesterol. After adjustment for potential confounders, for both simplified dietary patterns, a higher dietary pattern score showed a higher odds of having the MetS, whereas, again, higher OR were obtained for the RRR simplified dietary pattern.
To our knowledge, the present study was the first to compare the associations of dietary patterns derived by PCA and RRR analysis with the prevalence of the MetS. Taking into account that PCA by nature derives dietary patterns reflecting dietary behaviour in a population and, in contrast, RRR is more likely to generate patterns possibly associated with the disease of interest, the dietary pattern methods applied in the same population do not necessarily lead to identical patterns. However, in the present study, both PCA- and RRR-derived dietary patterns seemed to be very similar. In particular, and contrary to our original expectation, the proportion of the variation explained in food intake was only slightly higher for the PCA-derived pattern than for the RRR-derived pattern (5·1 v. 4·8 %). In addition, the degree to which disease-related variation was represented by the RRR dietary pattern score was limited (overall 7·2 %) but coincides with previous studies using biomarker levels as response variables( Reference Liu, Nettleton and Bertoni 13 , Reference Nettleton, Steffen and Schulze 28 ). Moreover, correlation coefficients between food groups and the RRR-derived pattern were relatively low compared with other studies using biomarkers as response variables( Reference Vujkovic, Steegers and Looman 29 , Reference Liese, Weis and Schulz 30 ). The variations explained in food intake were higher in these studies, possibly leading to higher correlations of the food groups with the derived patterns. Nevertheless, the results of multiple linear and logistic regression analyses were stronger for the RRR-derived pattern. The correlation coefficient between the PCA- and RRR-derived patterns was low, indicating that linear combinations of the weighted food groups were different. To improve comparability and interpretability of both PCA- and RRR-derived patterns( Reference Schulze, Hoffmann and Kroke 19 ), we calculated a simplified dietary pattern score as an unweighted sum of ten food groups. As expected, compared with PCA, the OR of having the MetS was higher for the RRR simplified dietary pattern score. A simplified pattern score characterised by the four concordant food groups, namely legumes, beef, processed meat and bouillon, was equally positively associated with the MetS, and only somewhat lower than the PCA simplified dietary pattern that was additionally characterised by a high intake of more favourable food groups such as cabbage, fruiting vegetables, leafy vegetables, other vegetables and vegetable oil. In contrast, the RRR simplified dietary pattern included high intakes of potatoes, pork, margarine and other fats, and low intakes of pasta/rice and tea, and showed about 2-fold higher likelihood of having the MetS in participants with high dietary pattern scores after adjustment for potential confounders.
There is an ongoing debate on the selection of response variables that should be intermediates in the pathway between dietary intake and outcome of interest( Reference Ambrosini, Johns and Jebb 31 ). In the present study, we decided to use single components of the MetS as response variables as the MetS can be considered as a clinical picture of metabolic disturbances rather than a disease. Thus, the MetS itself may be regarded as an intermediate for chronic diseases such as CVD. A previous study( Reference Liu, Nettleton and Bertoni 13 ) has also used RRR analysis with the components of the MetS as response variables, and a higher dietary pattern score was characterised by foods with a high glycaemic index, high-fat meats, cheese, processed foods and low intakes of vegetables, fruits, soya, green and black tea, low-fat dairy desserts, seeds and nuts, and fish. This pattern is somewhat similar to the patterns generated in the present study, except that we also found high intakes of legumes (except soya products) and potatoes. Another study using RRR analysis has found a positive association between a dietary pattern low in lean meat, egg, soyabean, vegetables, dark green vegetables, carrot, fruit, seaweed and mushrooms and the prevalence of the MetS in women only( Reference Yeh, Chang and Pan 14 ). Unexpectedly, in agreement with the present study, the authors have reported that legume intake was positively associated with this pattern. Another study has reported that legume intake was associated with a pattern score positively associated with type 2 diabetes( Reference Heidemann, Hoffmann and Spranger 32 ). The authors have stated that this might be due to the fact that legumes are mostly consumed in combination with meat or processed meat in a traditional German diet. In the present study, we also found other vegetables in the PCA-derived pattern that may indicate that some vegetables may be associated with intakes of meats and fats rather than being associated with the MetS.
Moreover, the present results of the PCA are in agreement with those of the study by Heidemann et al. ( Reference Heidemann, Scheidt-Nave and Richter 33 ). The authors have found a ‘processed foods pattern’ generated by factor analysis and characterised by a high consumption of refined grains, red and processed meat, high-sugar beverages, eggs, potatoes, beer, sweets and cakes, snacks and butter in a German population. However, the association with the MetS was somewhat lower than that found in the present study (OR 1·64, 95 % CI 1·10, 2·43). Naja et al. ( Reference Naja, Nasreddine and Itani 10 ) derived a pattern characterised by high intakes of fast foods and desserts using factor analysis, and reported an OR of 3·13 (95 % CI 1·36, 7·22) for the MetS, comparing the highest quintile with the lowest quintile of the dietary pattern score. The ‘traditional Lebanese’ pattern characterised by high intakes of dairy products, olives, fruits, legumes, grains, eggs, vegetable oil, nuts and dried fruits, and traditional sweets and a ‘High protein’ pattern was not statistically significantly associated with the prevalence of the MetS. Furthermore, in accordance with the results of the present study, two studies have found dietary patterns derived by PCA or factor analysis that were similarly characterised by high intakes of red and white meat and meat products to be positively associated with the prevalence of the MetS( Reference Panagiotakos, Pitsavos and Skoumas 9 , Reference Denova-Gutierrez, Castanon and Talavera 11 ). However, another study has observed no association between an ‘alcohol and meat’ pattern derived by factor analysis and the MetS( Reference Hong, Song and Lee 12 ).
The results of the present study and of the aforementioned studies indicated that dietary patterns characterised by high intakes of red and processed meat, refined grains and fats may be positively associated with the prevalence of the MetS. Furthermore, we found a disease-related pattern that was similar to the behaviour-related pattern identified in a Northern German population. To our knowledge, studies comparing PCA and RRR dietary patterns are rare. Whereas few studies investigating the associations of PCA- and RRR-derived patterns with obesity( Reference Manios, Kourlaba and Grammatikaki 34 ) or all-cause mortality( Reference Hoffmann, Boeing and Boffetta 35 ) have found different patterns, other studies have also found similar patterns related to the markers of subclinical atherosclerosis( Reference Nettleton, Steffen and Schulze 28 ) or the risk of spina bifida in the offspring( Reference Vujkovic, Steegers and Looman 29 ). Whereas studies that have found different patterns used nutrients as response variables, the two studies that have found similar patterns used biomarkers as response variables. Additionally, another study investigating the associations between dietary patterns and myocardial infarction has found similar patterns using nutrients as well as biomarkers of dietary intake as response variables in the RRR analysis( Reference DiBello, Kraft and McGarvey 36 ). Using nutrients in the RRR analysis, mostly about 30 % of the variation in the response variable is explained, whereas using biomarkers as response variables, the variation explained is much lower (mostly >10 %). Thus, if the variation explained in response variables is low, the patterns derived are more likely to simply represent a pattern that reflects the most common consumption pattern of the study population such as the PCA-derived pattern. Perhaps this could explain the similarities that we found in the present study in accordance with other studies( Reference Nettleton, Steffen and Schulze 28 , Reference Vujkovic, Steegers and Looman 29 , Reference DiBello, Kraft and McGarvey 36 ). However, all of these studies have also found a stronger association between the RRR-derived pattern and the outcome of interest.
The prevalence of central obesity and hypertension was very high in the present study, possibly due to the relatively high mean age of the study population. The first wave of the German Health Interview and Examination Survey found a prevalence of overweight of 67 % for men and 53 % for women (aged 18–79 years)( Reference Mensink, Schienkiewitz and Haftenberger 37 ). Furthermore, the prevalence of hypertension was 59·8 % among the participants aged between 60 and 69 years( Reference Neuhauser, Thamm and Ellert 38 ). The prevalence of chronic diseases such as CVD and cancer was also relatively high in our population. Exclusion of these participants also revealed positive associations between the two simplified pattern scores and the prevalence of the MetS. However, the associations were no longer statistically significant, possibly due to the resulting smaller sample size. Nevertheless, restricting the analysis to the participants reporting no dietary change, the association was still found to be statistically significant for the RRR simplified dietary pattern score.
The major strengths of the present study are the considerable non-dietary information that allows for adjustment for potential confounders, and the concomitant application of PCA and RRR analysis to compare a dietary pattern that reflects dietary behaviour in the study population with a pattern explaining the variation in the components of the MetS.
The present study has several limitations. First, due to the cross-sectional analysis, conclusions about temporality and causality cannot be drawn. Second, since dietary intake was assessed using a self-administered FFQ only, under-reporting may have occurred. However, exclusion of potential under-reporters changed the results only slightly. Nevertheless, the FFQ was designed and validated for the German population( Reference Nöthlings, Hoffmann and Bergmann 21 ). A further limitation is the relatively modest sample size. Generalisability of the present results may be limited due to response bias, owing to the fact that the cohort included a subgroup of blood donors.
Conclusion
We derived two similar dietary patterns using PCA and RRR analysis associated with the components of the MetS, which were particularly characterised by high intakes of potatoes, various vegetables, red and processed meat, fats, sauce and bouillon. This consistency in our findings indicates that the disease-related RRR pattern is likely to be present to some extent in the study population. Nevertheless, comparing simplified dietary patterns, individuals with higher RRR dietary pattern scores showed a higher likelihood of having the MetS compared with those with high PCA dietary pattern scores. A pattern of concordant food groups in the PCA and RRR analysis consisting of legumes, beef, processed meat and bouillon still showed a positive association with the prevalence of the MetS. The application of both methods may be advantageous to estimate the similarity between real-world behaviour- and disease-related patterns to obtain information for designing and realising dietary guidelines. Thus, further research and especially prospective studies are needed to confirm the results.
Supplementary material
To view supplementary material for this article, please visit http://dx.doi.org/10.1017/S0007114514002098
Acknowledgements
The authors thank all the participants of the PopGen control cohort study for their invaluable contribution to the study.
The present study was supported by grants from the Federal Ministry of Education and Research (0315540B and 01EY1103). The funder had no role in the design and analysis of the study or in the writing of this article.
The authors’ contributions are as follows: J. B., M. K., I. A., S. N., M. L., G. J. and U. N. obtained the data; J. B. and U. N. designed the study; J. B. performed the statistical analyses; S. S. assisted with the dietary pattern analysis; J. B. and U. N. interpreted the results; J. B. drafted the manuscript. All authors critically reviewed and approved the final version of the manuscript.
None of the authors has any conflicts of interest to declare.


