


Long-chain PUFA (LC-PUFA), including arachidonic acid (ARA), EPA and DHA, mediate lipid metabolism, participate in immune reactions and comprise the biomembranes( Reference Sargent, Bell and Bell 1 , Reference Tocher 2 ). Moreover, the so-called ‘n-3’ LC-PUFA such as EPA and DHA are necessary for building the phospholipids of biomembranes, with n-3 LC-PUFA supplements in diets demonstrated to be effective in the prevention/treatment of obesity, the metabolic syndrome and CVD in human( Reference Lorente-Cebrián, Costa and Navas-Carretero 3 ). Fish are major sources of n-3 LC-PUFA in human diets, which therefore drives the flourishing and development of the aquaculture industry. Traditionally, high levels of fishmeal and fish oils (FO) are included in aquafeeds to deliver high n-3 LC-PUFA contents in farmed fish. Because the illogicality between the increasing demand and deficiency of FO is becoming more and more serious, considerable attention is focused on investigating the sustainable alternative to FO, not to reduce the LC-PUFA content of farmed fish. Vegetable oils (VO) rich in C18 PUFA including α-linolenic acid (ALA, 18 : 3n-3) and linoleic acid (LA, 18 : 2n-6) have been regarded as the ideal alternative to FO in aquafeeds( Reference Tocher 2 ). Many researchers are devoting their attention to improve the substitute ratio with VO in aquafeeds, not to impair the nutritional quality of farmed fish.
It is generally accepted that mammals can convert dietary ALA (18 : 3n-3) and LA (18 : 2n-6) into LC-PUFA through a series of fatty acid desaturation and carbon chain extension reactions, in which key enzymes involve fatty acyl desaturases (Fads: Δ6 Fads and Δ5 Fads) and elongases (elongases of very long-chain fatty acids (Elovl): ELOVL5, ELOVL4 and ELOVL2)( Reference Sargent, Bell and Bell 1 – Reference Bond, Miyazaki and ÓNeill 6 ). However, the LC-PUFA bioconversion ability of fish varies among species and depends upon the complement and function of Fads and Elovl in fish species( Reference Castro, Monroig, Leaver and Wilson 4 , Reference Castro, Tocher and Monroig 7 ). All the cloned teleost fads genes belong to the mammalian fads2-type, which shows Δ6 desaturase activity in most teleosts, monofunctional ∆5 desaturases or bifunctional ∆6/∆5 desaturases in freshwater and salmonid species as well as ∆4 desaturase activity in some teleost fish( Reference Castro, Monroig, Leaver and Wilson 4 – Reference Hastings, Agaba and Tocher 8 ). The gene coding Elovl5 has been found in all the fish that have so far been examined( Reference Tocher 2 , Reference Castro, Tocher and Monroig 7 ). Historically, it has been recognised that freshwater and salmonid species can convert dietary ALA and LA into LC-PUFA, similar to the mammals, while marine fish typically have a low capability or inability to transform C18 precursors into LC-PUFA, due to the loss-of-function mutations of Δ5 Fads2 or Elovl2( Reference Tocher 2 , Reference Castro, Monroig, Leaver and Wilson 4 , Reference Castro, Tocher and Monroig 7 , Reference Hastings, Agaba and Tocher 8 , Reference Morais, Monroig and Zheng 9 ). So investigation of upregulation of the expression of the desaturases and elongase to improve the endogenous LC-PUFA biosynthetic ability of fish is attracting more attention. At a molecular level, the expression of desaturases and elongases is reported to be modulated at the transcriptional level by key transcription factors such as PPAR, sterol regulatory element-binding protein-1 (SREBP-1), liver X receptor (LXR) and hepatocyte nuclear factor 4α (HNF4α) in vertebrates( Reference Qin, Dalen and Gustafsson 10 – Reference Wang, Chen and Jiang 15 ). For example, the expression of the Δ5 and Δ6 desaturases and Elovl5 is stimulated to promote the production of LC-PUFA through the LXRα–SREBP-1 pathway in mammals and fish( Reference Qin, Dalen and Gustafsson 10 , Reference Carmona-Antonanzas, Tocher and Martinez-Rubio 11 ), while PPAR are reported to stimulate human SREBP-1, either by directly binding to the PPAR response elements on the promoter or via cross-regulation with the LXR in mice( Reference Dong, Tan and Cai 12 , Reference Fernandez-Alvarez, Alvarez and Gonzalez 13 ). Recently, we demonstrated that HNF4α might play a crucial role in the upregulation of Δ5/Δ6 fads2 and Δ4 fads2 in the herbivorous marine fish Siganus canaliculatus ( Reference Dong, Wang and Chen 14 , Reference Wang, Chen and Jiang 15 ).
Moreover, the endogenous LC-PUFA biosynthetic capacity of fish may be influenced by environmental salinity( Reference Tocher 2 ). Our previous study found that low salinity could enhance the mRNA expression of key enzyme genes including Δ5/Δ6 fads2, Δ4 fads2 and elovl5 and the related transcription factor genes such as ppars, srebp-1 and hnf4α as well as the ability of production of LC-PUFA in the rabbitfish S. canaliculatus ( Reference Dong, Wang and Chen 14 – Reference You, Jiang and Zhang 19 ). A similar phenomenon was observed in the red sea bream Pagrus major with higher fads2 expression and liver EPA and DHA contents in 15 ‰ (parts per thousand; ppt) water compared to 33 ppt water( Reference Sarker, Yamamoto and Haga 20 ). It is indicated that water salinity might affect the LC-PUFA bioconversion capacity from C18 precursors by regulating the expression of desaturases and elongases in fish. Moreover, the optimal dietary ALA:LA ratio of 1·93 is proposed for S. canaliculatus juveniles( Reference Xie, Liu and Wang 21 ). However, the effect of environmental salinity on endogenous LC-PUFA biosynthesis in fish varies among different species. Contrary to what is observed in S. canaliculatus and P. major, the muscle EPA and DHA contents in euryhalinous Alosa sapidissima increased with an increase in salinity( Reference Liu, Gao and Yu 22 ). Similarly, seawater environment also improves the accumulation of EPA and n-3 PUFA in rainbow trout Oncorhynchus mykiss liver( Reference Haliloǧlu, Bayır and Sirkecioǧlu 23 ) as well as the accumulation of DHA and EPA in muscle and liver of Japanese sea bass (Lateolabrax japonicus)( Reference Xu, Yan and Teng 24 ). The different and varying effects of environmental salinity on LC-PUFA biosynthesis of fish in various species need further studies in euryhaline commercial fish.
Nile tilapia (Oreochromis niloticus), a euryhaline and omnivorous fish with extremely strong fertility and viability( Reference Brummett and Alon 25 ), is one of the fish species with maximum aquaculture productions. It is estimated that the global tilapia yields will reach 7·5 million tons in 2030( Reference Yuan, Yuan and Dai 26 ). Previous studies have demonstrated that Nile tilapia can convert C18 PUFA precursors into LC-PUFA( Reference Tocher, Agaba and Hastings 27 , Reference Agaba, Tocher and Zheng 28 ) and show the best growth performance in freshwater( Reference Gan, Xu and Ma 29 ). The genetically improved farmed tilapia (GIFT) strain was established in Malaysia in 2002 through twelve generations of natural genetic selection of O. niloticus for the improved growth performance. It has become one of the successfully introduced farmed Nile tilapia that flourishes in China. Previous studies have shown that GIFT exhibits a higher LC-PUFA bioconversion ability than the red hybrid tilapia (Oreochromis sp.), another farmed tilapia species, which is preferred by consumers due to its red colouration( Reference Teoh, Turchini and Ng 30 ). However, the LC-PUFA bioconversion ability of GIFT in different salinities has not been studied in detail. In the present study, three formulated feeds with (FO as lipid source) or without (VO blends as lipid source) LC-PUFA were used to feed juvenile GIFT in freshwater (0ppt) and brackish water (12 and 24 ppt) for 8 weeks. The aim was to investigate the capacity of utilising 18C PUFA precursors (ALA and LA) by GIFT in different salinities, and the proper dietary lipid source, by comparing the growth performance, tissue fatty acid composition, and mRNA expression levels of related genes to LC-PUFA synthesis among different treatments.
Methods
Experimental diets
Casein, soyabean meal and gelatin were used as protein sources; rapeseed oil (RO), perilla oil (PO), soyabean oil (SBO) or FO were used as lipid sources. A total of three isonitrogenous (32 %) and isolipidic (8 %) diets were made using different dietary lipid sources, including the control diet (D1) using FO; a high-LA diet (D2) using SBO:RO=1:1 (LA:ALA ratio of 4·04); a high-ALA diet (D3) using PO:RO=1:1 (LA:ALA ratio of 0·54) (Tables 1 and 2). Soyabean meal and gelatin were finely ground through 60 mesh using a laboratory mill. Small total amounts of the powdered ingredients were first mixed together in a laboratory feed mixer and then mixed thoroughly with the other ingredients. Next, the dietary powder was mixed and homogenised with oil and distilled water. The mixture was then transformed into hard pellets by extrusion at 90°C in a laboratory feed-pelletiser equipped with a 4 mm die. The wet pellets were air-dried at room temperature, sealed and stored at –20°C before feeding.
Table 1 Ingredients and proximate composition (g/kg diet) of the experimental diets
* Experimental diets nomenclature: D1, fish oil; D2, soyabean and rapeseed oil; D3, perilla and rapeseed oil.
† Casein: protein content, 80%.
‡ Soyabean meal: protein content, 48%.
§ Peruvian fish oil: α-linolenic acid content, 0.6%; linoleic acid content, 1.3%.
|| Rapeseed oil: α-linolenic acid content, 12%; linoleic acid content, 20%.
¶ Soyabean oil: α-linolenic acid content, 7%; linoleic acid content, 61%.
** Perilla oil: α-linolenic acid content, 67%; linoleic acid content, 14%.
†† The amount of vitamin per kg of premix was as follows: vitamin A, 3·3 mg; vitamin D3, 0·08 mg; vitamin E, 307 mg; vitamin K3, 1000mg; vitamin B1, 1500mg; vitamin B2, 2800mg; vitamin B6, 1000mg; vitamin B12, 8mg; d-calcium pantothenate, 2000mg; nicotinic acid, 7800mg; biotin, 8mg; folic acid, 400mg; inositol, 12800mg; stable vitamin C, 20000mg.
‡‡ The amount of ingredients per kg of premix was as follows: Fe, 10g; Zn, 3.2g; Mn, 3g; Co, 52mg; iodine, 65mg; Se, 15mg.
Table 2 Fatty acid composition of the experimental diets (% total fatty acids) for genetically improved farmed tilapia (Oreochromis niloticus)
ARA, arachidonic acid; DPA, docosapentaenoic acid.
* Not detected.
Fish husbandry and sample collection
Juvenile GIFT (average weight 4 g) were obtained from a local freshwater aquaculture farm (Chaozhou, China) and transferred to three indoor circular tanks (6 m3) with 1000 individuals per tank in Nan Ao Marine Biology Station of Shantou University. After indoor acclimation for 2 weeks, healthy juveniles of similar sizes were selected for salinity acclimation. In two rearing tanks (6 m3), the juveniles were acclimated from freshwater to 12 and 24 ‰ salinity, respectively, increasing the salinity by adding filtered seawater at 4 ‰ salinity every 2 d and then maintained for another 2 weeks by replacing with the same salinity water from the reservoir tanks. In the freshwater tank (6 m3), the juveniles were unceasingly maintained in aerated freshwater. During the husbandry periods and salinity acclimation, the juveniles were fed commercial fish pellets (Guangzhou Hailong Feed Corporation Limited) three times a day (07.30, 11.30 and 16.30 hours) at 3% of body weight.
Before the start of the normal growth experiment, fish with similar sizes were transferred to the 500 litres indoor conical aquaria (90 cm Φ, 60 cm depth) equipped with internal biological filters for a further 2-week acclimation. During this period, the fish were fed a mixture of three experimental diets (D1–D3, each with equal proportions). In the following 8 weeks, the normal feeding trial was performed in the 500 litres aquariums with D1–D3 diets at 0, 12 and 24 ppt, respectively. Each dietary group was performed at the three salinities, and each treatment was run in three replicate aquariums, with a total of twenty-seven aquariums. Each aquarium was allocated with twenty individuals, which were separately weighed after anaesthesia in 0·02 % 2-phenoxyethanol. During the growth experiment, fish were fed the experimental diet three times a day at 3 % of body weight. Each time the fish in all the twenty-seven experimental aquariums were fed in order for three rounds, and the uneaten feeds were collected timely to record the daily fed amounts. The water quality in aquariums was maintained by replacing half volume of the aquarium water every 2 d, while the faecal matter was removed through the bottom auto-discharge device of the conical aquarium. The dissolved O2 was above 6 mg/l, and the temperature was maintained at 25–27°C.
At the end of the growth experiment, all fish were starved for 24 h, anaesthetised by 0.02 % 2-phenoxyethanol and weighed individually. From each aquarium, two whole fish were collected for proximate composition analysis and another three fish were dissected to collect liver and muscle tissues. All the whole-body fish and tissues were flash-frozen in liquid N2 and stored at –80°C until use.
The weight gain rate (WGR), specific growth rate (SGR) and feed conversion ratio (FCR) of the fish, and the feed intake per fish were calculated according to the following formulae:
 $$\hskip1pt{\rm WGR\;(\%)}{\equals}100{\times}\left( {W_{{\rm f}} {\minus}W_{{\rm i}} } \right)\,/\,W_{{\rm i}} $$
 $$\hskip17pt {\rm SGR\, (\%d){\equals}100}{\times}\left( {\ln W_{{\rm f}} {\minus}\ln W_{{\rm i}} } \right)\,/\,d$$
 $${\rm FCR{\equals}}{{W_{{\rm d}} } \mathord{\left/ {\vphantom {{W_{{\rm d}} } {(W_{{\rm f}} {\minus}W_{{\rm i}} )}}} \right. \kern-\nulldelimiterspace} {(W_{{\rm f}} {\minus}W_{{\rm i}} )}}$$
 $${\rm Feed}\,{\rm intake}\,{\rm per}\,{\rm fish{\equals}feed}\,{\rm intake/number}\,{\rm of}\,{\rm individuals}$$
In the above formulae, W f and W i are the final and initial body weight, respectively, d represents the experimental days, while W d the dry amount of diet fed by fish.
Proximate composition analysis
The methods used for proximate composition analysis of experimental diets and whole-body fish were as described previously in our laboratory( Reference Li, Hu and Zheng 16 ). Briefly, moisture was determined by drying in an oven at 80°C to constant weight. Crude protein content was calculated by determining the total N content using the Kjeldahl methods. Crude lipid content was measured by the Soxhlet extraction. Ash content was determined through combustion in a muffle furnace at 550°C for 8 h. Duplicate analyses were conducted for each sample.
Fatty acid analysis
Freeze-dried samples of experimental diets and fish tissues were prepared for lipid extractions with chloroform–methanol (2:1, v/v) containing 0·01% butylated hydroxytoluene. The lipid extracts were esterified into methyl esters by boron trifluoride–methanol complex catalysed transesterification (Sigma-Aldrich). Fatty acid methyl esters were separated using a GC (GC-2010; Shimadzu) equipped with an auto-sampler and a H2 flame ionisation detector. The detailed GC parameters were as described previously( Reference Li, Hu and Zheng 16 ). Fatty acids were identified individually by comparison with known commercial standards (Sigma-Aldrich) and quantified with CLASS-GC10 GC workstation (Shimadzu).
mRNA expression of key genes related to long-chain PUFA biosynthesis
Total RNA was extracted from GIFT liver tissue using the TriPure Isolation Reagent (Roche). The quality and concentration of the RNA extracts were measured by agarose gel electrophoresis and spectrophotometry (Nanodrop 2000; Thermo Scientific). Next, 1 µg of total RNA was reverse transcribed into complementary DNA (cDNA) using the FastQuant® RT kit (Tiangen) with a genomic DNA elimination reaction. The mRNA expression of the genes most related to LC-PUFA biosynthesis in GIFT liver was determined by real-time quantitative PCR (qPCR) using β-actin as a reference gene. Specific primers were designed based on the published sequences of Nile tilapia (O. niloticus)( Reference Chen, Guan and Xie 31 , Reference Oboh, Kabeya and Carmona-Aotoanzs 32 ): the key enzyme genes: Δ5/Δ6 fads2 (AB069727), Δ4 fads2 (XM003440472), elovl5 (AY170326); the related transcription factor genes: pparα (KF871430), srebp-1 (XM005457771), lxr (XM005455714), hnf4α (XM003457051); the housekeeping gene: β-actin (EU887951) (Table 3). The mRNA expression of each gene was normalised relative to the β-actin mRNA and determined by the comparative threshold cycle method( Reference Livak and Schmittgen 33 ). The qPCR was performed on a Lightcycler 480 system (Roche) in a total reaction volume of 20 µl containing 10 µl of SYBR Green Supermix (Roche), 1 µl of each primer (10 µm), 6 µl ddH2O and 2 µl of cDNA (10 ng/µl). The qPCR programme consisted of an initial DNA denaturation step at 94°C for 5 min, followed by forty-five cycles at 95°C for 10 s, annealing 60°C for 20 s, extension 72°C for 20 s, and with a final extension step at 95°C for 5 s, 65°C for 60 s and 40°C for 10 s. Triplicate reactions were performed for each sample.
Table 3 Primers used for determination of the mRNA expression of the key enzyme and transcription factor genes by real-time quantitative PCR in genetically improved farmed tilapia (Oreochromis niloticus)
fads, fatty acyl desaturase; elovl, elongase of very long-chain fatty acids; srebp-1, sterol regulatory element-binding protein-1; pparα, peroxisome proliferator-activated receptor α; lxr, liver X receptor; hnf4α, hepatocyte nuclear factor 4α.
Statistical analysis
All data are presented as means with their standard errors. The differences among treatments were analysed by two-way ANOVA followed by Tukey’s multiple comparison test, where the diet (D1, D2 and D3) and water salinity (0, 12 and 24 ppt) were determined as the first and second independent variables, respectively (OriginPro 75; OriginLab). The significant level was considered at P<0·05.
Results
Growth performance and proximate composition of genetically improved farmed tilapia
In the experimental trials, all treatment groups had survival rates not <95 % (Table 4). The two-way ANOVA showed that the WGR, SGR and FCR in GIFT were not significantly affected by the dietary lipid sources (P>0·05) but were impacted by water salinity (P<0·05) (Table 4). When fed the same diets, GIFT maintained at 12 ppt exhibited the highest WGR and SGR, which were significantly higher than the fish maintained at 0 and 24 ppt (P<0·05). These fish also had the lowest FCR, which was significantly lower than those maintained in 0 ppt water (P<0·05). Under the same salinity, the D2 group had the best growth performance, although there was no significant difference with the other two dietary groups (D1 and D3 groups) (P>0·05). Besides, the proximate composition of fish showed no significance among the different salinity treatments (P>0·05), except the crude protein content that was significantly affected by the dietary lipid sources (P<0·05) (Table 5), with D2 group exhibiting a higher crude protein content than D1 group (P<0·05).
Table 4 Growth performance and feeding efficiency of genetically improved farmed tilapia (Oreochromis niloticus) reared at 0, 12 and 24 ‰ (parts per thousand; ppt) with the experimental diets for 8 weeks (Mean values with their standard errors, n 3)
ppt, Parts per thousand; WGR, weight gain rate; SGR, specific growth rate; FCR, feed conversion ratio.
* WGR=100×(final fish weight–initial fish weight)/initial fish weight.
† SGR=100×(ln (final mean weight)–ln (initial mean weight))/d fed.
‡ FCR=dry amount of feed intake/(final fish weight–initial fish weight).
Table 5 Whole-body proximate composition of genetically improved farmed tilapia (Oreochromis niloticus) at the end of the growth experiment (Mean values with their standard errors, n 3)
ppt, Parts per thousand.
Fatty acid composition of tissues in the genetically improved farmed tilapia
The fatty acid composition in muscle of GIFT is shown in Table 6. Two-way ANOVA showed that almost all the muscle fatty acid contents were significantly affected by the dietary lipid source (P<0·05), and only a few PUFA such as C18 : 2n-6, C20 : 4n-6, C20 : 4n-3 and C22 : 5n-3 were significantly affected by water salinity (P<0·05). When fed the same diets, the GIFT exhibited a higher muscle ARA (20 : 4n-6) content in brackish water (12 and 24 ppt) than in freshwater (P<0·05). Under the same water salinity, the muscle EPA (20 : 5n-3) and DHA (22 : 6n-3) contents of the two VO groups (D2 and D3 groups) were significantly lower than the FO group (D1 group) (P<0·05). The muscle ARA content of the D2 group was significantly higher than the D3 group (P<0·05) but showed no significance with the D1 group (P>0·05).
Table 6 Muscle fatty acid composition of genetically improved farmed tilapia (Oreochromis niloticus) fed with diets D1–D3 at different ambient salinities for 8 weeks (Mean values with their standard errors, n 3)
ppt, Parts per thousand; DPA, docosapentaenoic acid.
The fatty acid composition in the liver of GIFT is shown in Table 7. The results showed that the PUFA (ALA, LA, ARA, EPA and DHA) were significantly affected by the dietary lipid sources (P<0·01), while the ARA and EPA contents were remarkably affected by water salinity (P<0·05). When fed the same diets, GIFT in brackish water (12 and 24ppt) had a higher liver ARA content than in freshwater (P<0·05), which is similar to the muscle ARA content (Table 6). At the same water salinity, the liver DHA content of D1 group was considerably higher than the two VO groups (D2 and D3 groups) (P<0·05), while the liver DHA content of D3 group (the high-ALA fed group) was also higher than the D2 group (the high-LA fed group) (P<0·05); meanwhile, the liver ARA content of D2 group was significantly higher than the D3 group (P<0·05), but showed no significance with the D1 group (P>0·05), which is synonymous with muscle ARA content.
Table 7 Liver fatty acid composition of genetically improved farmed tilapia (Oreochromis niloticus) fed with diets D1–D3 at different ambient salinities for 8 weeks (Mean values with their standard errors, n 3)

ppt, Parts per thousand; DPA, docosapentaenoic acid.
mRNA levels of genes encoding key enzymes involved in long-chain PUFA biosynthesis and their related transcription factors
The mRNA expression levels of the genes encoding key enzymes required in the LC-PUFA biosynthetic pathway, Δ5/Δ6 fads2, Δ4 fads2 and elovl5 are shown in Fig. 1, and the mRNA expression of the genes encoding transcription factors (e.g. pparα, srebp-1, hnf4α and lxr) is shown in Fig. 2. The mRNA expression of Δ5/Δ6 fads2 was significantly affected by the dietary lipid sources, with a higher expression found in the D2 group compared to the D1 group at the same water salinity (P<0·05). Water salinity significantly affected the mRNA level of elovl5, which was higher at 24ppt salinity than at 0ppt salinity (P<0·05). The Δ4 fads2 mRNA expression was not significantly affected by both the dietary lipid sources and water salinity (P>0·05), while there was an interaction between them (P<0·05). The mRNA level of pparα increased with increasing salinity, which was significantly higher in 24ppt water than in freshwater (P<0·05). Furthermore, the mRNA levels of srebp-1, hnf4α and lxr were significantly affected by the dietary lipid sources, and the srebp-1 expression in the D1 group considerably higher than that in the D2 and D3 groups (P<0·05).
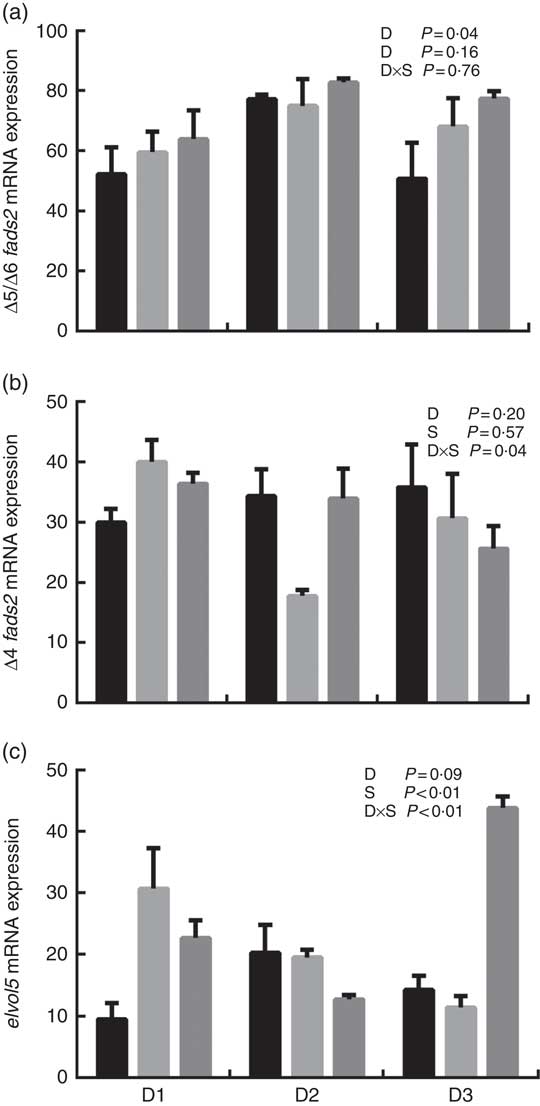
Fig. 1 mRNA expression of Δ5/Δ6 fatty acyl desaturase (fads2) (a), Δ4 fads2 (b) and elongase 5 of very long-chain fatty acids (elovl5) (c) in liver of genetically improved farmed tilapia (Oreochromis niloticus) fed D1, D2 and D3 diets at 0 ‰ (parts per thousand; ppt) (![]() ), 12 ppt (
), 12 ppt (![]() ) and 24 ppt (
) and 24 ppt (![]() ) salinities, respectively. The mRNA levels of target genes were determined by quantitative PCR, using β-actin as a reference gene. Values are means (n 6), with their standard errors represented by vertical bars.
) salinities, respectively. The mRNA levels of target genes were determined by quantitative PCR, using β-actin as a reference gene. Values are means (n 6), with their standard errors represented by vertical bars.
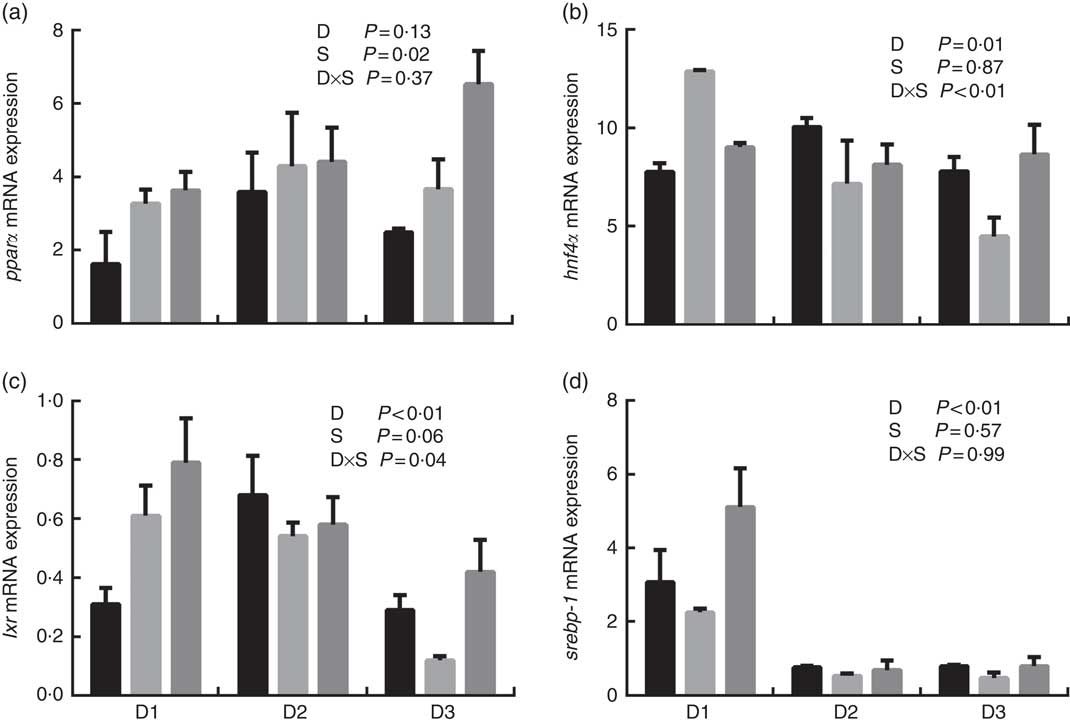
Fig. 2 mRNA expression of peroxisome proliferator-activated receptor α (pparα) (a), hepatocyte nuclear factor 4α (hnf4α) (b), liver X receptor (lxr) (c) and sterol regulatory element-binding protein-1 (srebp-1) (d) in liver of genetically improved farmed tilapia (Oreochromis niloticus) fed D1, D2 and D3 diets at 0 ‰ (parts per thousand; ppt) (![]() ), 12 ppt (
), 12 ppt (![]() ) and 24 ppt (
) and 24 ppt (![]() ) salinities, respectively. The mRNA levels of target genes were determined by quantitative PCR, using β-actin as a reference gene. Values are means (n 6), with their standard errors represented by vertical bars.
) salinities, respectively. The mRNA levels of target genes were determined by quantitative PCR, using β-actin as a reference gene. Values are means (n 6), with their standard errors represented by vertical bars.
Discussion
Fish, like mammals, require a dietary supply of essential fatty acids (EFA) of the n-3 and n-6 series that they are unable to synthesise for normal growth and survival, with LC-PUFA being the EFA of the teleost( Reference Sargent, Bell and Bell 1 , Reference Tocher 2 ). The GIFT and its ancestor Nile tilapia (O. niloticus) are reported to have the ability of transforming dietary ALA and LA into LC-PUFA( Reference Tocher, Agaba and Hastings 27 , Reference Agaba, Tocher and Zheng 28 , Reference Teoh, Turchini and Ng 30 ). In the present study, the WGR, SGR and FCR of the two VO (free LC-PUFA)-fed groups showed no significance with the FO (with LC-PUFA) group, indicating that the dietary FO of the GIFT can be entirely replaced by VO with no negative effects on the growth. Furthermore, the dietary high-LA group improved liver ARA content, while the dietary high-ALA group promoted liver DHA content. It is suggested that the GIFT indeed possesses the LC-PUFA bioconversion ability, and is capable of effectively using dietary ALA and LA to meet the EFA requirements for normal growth and physiology. Moreover, the growth performance of the GIFT was considerably correlated with water salinity in the present study, which was better at 12 ppt than at 0 ppt, suggesting that GIFT may have a higher LC-PUFA bioconversion ability in brackish water than in freshwater. This finding was further confirmed by the liver and muscle fatty acid composition of the GIFT under different water salinities, whereby a higher liver and muscle ARA content was observed in brackish water of 12 and 24 ppt compared with 0 ppt water. Although the mRNA expression of the key enzymatic genes Δ5/Δ6 fads2 and Δ4 fads2 showed no significance among different salinity treatments, the key enzymatic gene elovl5 and the transcription factor pparα showed a higher expression in 24 ppt water than in 0 ppt water in the liver of GIFT. This suggests that elovl5 and pparα might be involved in the regulation of LC-PUFA biosynthesis by water salinity in tilapia, which is similar to the observations in the rabbitfish S. canaliculatus and Atlantic salmon (Salmo salar)( Reference Xie, Wang and You 17 , Reference You, Jiang and Zhang 19 , Reference Zheng, Torstensen and Dick 34 ).
Environmental salinity might correlate with endogenous LC-PUFA biosynthesis of fish in terms of the following: (1) LC-PUFA are the major phospholipid components of cell membranes, which establish the fluidity and permeability of the membranes( Reference Borlongan and Benitez 35 , Reference Mourente, Bell and Tocher 36 ), and when environmental salinity changes, membrane fatty acid composition is also altered to properly maintain the osmotic pressure balanced inside and outside the body of fish( Reference Fonseca-Madrigal, Pineda-Delgado and Martínez-Palacios 37 ). (2) Lipids are an important energy source in animals through fatty acid β-oxidation. The liver and muscle are the most active tissues for fatty acid β-oxidation in fish( Reference Fonseca-Madrigal, Bell and Tocher 38 ). Thus, fatty acid composition in liver and muscle might change during variation of environmental salinity. (3) Salinity might indirectly regulate the synthesis of LC-PUFA by adjusting the hormone levels in fish, such as auxin, cortisol, prolactin and insulin-like growth factor-1( Reference Saltiel and Kahn 39 , Reference Vagner, Robin and Zamboninoinfante 40 ). The previous study reported that O. niloticus, the ancestor of GIFT, showed the best growth performance in freshwater( Reference Gan, Xu and Ma 29 ). However, Qiang et al. ( Reference Qiang, Wang and Kpundeh 41 ) reported that the optimal water salinity was 7·8 ppt for the GIFT. The present study also reveals that GIFT is the best appropriate to live in brackish water (12 ppt) among the three salinity treatments (0, 12 and 24 ppt), indicating a wider tolerance to water salinity compred to its ancestor O. niloticus. It can therefore be speculated that GIFT might maintain osmotic equilibrium through changes in the endogenous LC-PUFA biosynthetic capacity to alter the fatty acid composition and membrane fluidity of cellular membrane during variations in water salinity, when the membrane-associated proteins (receptors, enzymes, etc.) are affected( Reference Fonseca-Madrigal, Pineda-Delgado and Martínez-Palacios 37 , Reference Leray, Chapelle and Duportail 42 ). However, unlike the GIFT, low salinity stimulates endogenous synthesis of LC-PUFA in S. canaliculatus and decreases the growth performance( Reference Li, Hu and Zheng 16 , Reference Xie, Wang and You 17 ). S. canaliculatus spawns in seawater and its larva migrate and live in shallow sea areas, therefore, seawater with high salinity is appropriate for its growth. Thus, low salinity would be a challenge for the rabbitfish S. canaliculatus. Nile tilapia O. niloticus, the ancestor of GIFT, originated from the freshwater environment of the Tanganyika Lake of Africa and is appropriate to live in freshwater( Reference Brummett and Alon 25 , Reference Gan, Xu and Ma 29 ). However, the brackish water (12 ppt) simultaneously promoted the endogenous LC-PUFA bioconversion ability as well as the growth performance of the GIFT, suggesting GIFT is comfortable to live in the brackish water similar to what was observed in the silverside Chirostoma estor ( Reference Fonseca-Madrigal, Pineda-Delgado and Martínez-Palacios 37 ). The association between water salinity and LC-PUFA biosynthesis in fish is variable among species and seems to depend on whether water salinity is the actual challenge for the fish species( Reference Fonseca-Madrigal, Pineda-Delgado and Martínez-Palacios 37 ). The precise mechanistic links between these require further investigation.
The effects of water salinity on fish growth might also be related to energy consumption, which is used to sustain body osmotic equilibrium( Reference Zheng, Torstensen and Dick 34 , Reference Fonseca-Madrigal, Pineda-Delgado and Martínez-Palacios 37 ). When water salinity changes, a large amount of energy is consumed to maintain the osmotic equilibrium inside and outside the fish body. This energy consumption is detrimental to the nutrient accumulation and then suppresses fish growth( Reference Boeuf and Payan 43 ). Thus, when water salinity varied from the optimal salinity for fish, there was a decrease in the crude protein contents of Mugil cephalus and L. japonicus ( Reference Kheriji, El and Masmoudi 44 , Reference Xu, Yan and Teng 45 ), and the crude lipid content of S. canaliculatus and O. niloticus was also observed to decline( Reference Xie, Wang and You 17 , Reference Gan, Xu and Ma 46 ). In the present study, the crude protein and lipid contents of the GIFT were not remarkably affected by water salinities (0–24 ppt). These results could be attributed to the strong adaptive ability of the GIFT to environmental salinity, which is even stronger than its ancestor O. niloticus. A similar phenomenon was observed in O. mykiss, with no significant differences in the fish lipid content under different salinities (15, 20 and 33 ppt)( Reference Haliloǧlu, Bayır and Sirkecioǧlu 47 ). It thus suggests that the GIFT has a better salt tolerance than its ancestor O. niloticus.
In the LC-PUFA biosynthetic pathway of fish, LA and ALA are competitive substrates of Δ6 Fads2 desaturase, the first rate-limiting enzyme in the production of LC-PUFA. Thus, various fish have their distinct preferences for dietary fatty acids, hence the proper dietary LA:ALA ratio will vary among fish species( Reference Glencross 48 ). In the present study, although the different dietary groups showed no significance in growth, the GIFT in high-LA group (LA:ALA=4·04) showed the best growth performance and the highest Δ5/Δ6 fads2 expression under all salinity treatments. This suggests that the GIFT prefers the high-LA diets and is able to fully compensate for the lack of dietary LC-PUFA when fed with the VO diets. These results were consistent with the previous studies( Reference Teoh, Turchini and Ng 30 , Reference Young 49 ). Therefore, in terms of growth, FO can be entirely replaced with VO in the formulated feeds of the GIFT with the proper dietary LA:ALA ratio of 4·04.
Conclusions
By the 8-week feeding trial, the results revealed that FO can be fully replaced with VO in diets of the GIFT without a negative effect on the growth; GIFT had a better growth performance at 12ppt, coupled with a higher liver and muscle ARA content at 12ppt and 24ppt than in freshwater. It is suggested that brackish water (12 ppt and 24 ppt) can promote the growth performance and increase the LC-PUFA bioconversion ability of the GIFT compared with freshwater, probably by enhancing the expression levels of genes related to LC-PUFA biosynthesis, such as elovl5 and pparα. Besides, GIFT prefers the high-LA diets, with the LA/ALA ratio of 4·04.
Acknowledgements
The authors thank Dr Aweya Jude Juventus of Shantou University for revising the manuscript.
This work was financially supported by National Natural Science Foundation of China (nos 31873040 and 31110103913) and China Agriculture Research System (CARS-47).
Y. L. designed the study; F. L. carried out the growth experiment; S. W. assisted with the fatty acid analyses; C. C. performed the gene expression analyses; C. Y. and F. L. analysed the data; C. Y. wrote the paper with the help from Y. L.; all authors contributed to and approved the manuscript.
The authors declare that there are no conflicts of interest.


