


It is well reported that Si plays a role in optimal connective tissue formation, especially for skin and bone health(Reference Sripanyakorn, Jugdaohsingh and Thompson1–Reference Barel, Calomme and Timchenko3). One important driver for this association has been epidemiological studies showing relationships between dietary Si intakes and bone mineral density: originally reported in a US cohort(Reference Jugdaohsingh, Tucker and Qiao4), the positive association between dietary Si intake and bone mineral density has now been repeated in a UK cohort(Reference Macdonald, Hardcastle and Jugdaohsingh5). Nonetheless, this relationship is based upon Si intake(Reference Powell, McNaughton and Jugdaohsingh6) rather than Si availability (absorption) from the diet(Reference Jugdaohsingh, Tucker and Qiao4) and there is evidence that Si absorption from different foods varies (Jugdaohsingh et al. (Reference Jugdaohsingh, Anderson and Tucker7) and Table 1). With sufficient information a correction for different dietary Si availabilities could be considered in epidemiological studies.
Table 1 Silicon content of foods and its availability
(Mean values and ranges and mean values with their standard errors)
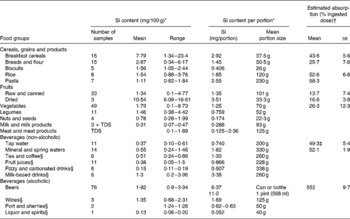
TDS, sample from the UK Food Standards Agency Total Diet Study(22).
* Si content of foods is from Powell et al. (Reference Powell, McNaughton and Jugdaohsingh6).
† Percentage estimated absorption of Si is from Jugdaohsingh et al. (Reference Jugdaohsingh, Anderson and Tucker7), where urinary Si excretion (0–6 h) was used as a surrogate marker for absorbed Si. Data are from three subjects (two males and one female) each ingesting between two and five different foods in the appropriate food group except for pasta and raisins. Only one sort of pasta was ingested by two subjects and one type of raisin by three subjects.
‡ Data are from Reffitt et al. (Reference Reffitt, Jugdaohsingh and Thompson14); eight subjects (six males and two females). Urine collection was 0–8 h in five subjects and 0–4 h in three subjects.
§ Although not investigated, the availability of Si in these beverages is likely to be similar to drinking water and beer (about 50 %).
∥ Data are from Sripanyakorn et al. (Reference Sripanyakorn, Jugdaohsingh and Elliott15); nine subjects (five males and four females). Urine collection was 0–6 h.
Bananas have a high Si content (about 5·5 mg/100 g), but preliminary evidence suggests that Si absorption is negligible (about 2 %) compared, for example, with green beans, which are high in absorbable Si (about 2·5 mg Si/100 g and about 50 % absorbed)(Reference Jugdaohsingh, Anderson and Tucker7). In addition, supplemental Si is used widely and likely to vary in intestinal availability ( < 1 to 50 %) depending on its chemical form(Reference Calomme, Cos, D'Haese, Collery, Brätter, Negretti de Brätter, Khassanova and Etienne8, Reference Van Dyck, Van Cauwenbergh and Robberecht9). Supplemental Si is generally purposeful (self-administered), but may also be inadvertent, such as through the long-term ingestion of silicate-containing antacids(Reference Pennington10, Reference Dobbie, Smith, Evered and O'Connor11). In our experience different countries tend to favour very different forms of Si supplements and these may be expected to have different absorption profiles; for example, organic Si, typically monomethyl silanetriol (MMST), is commonly used in France, whereas colloidal mineral Si appears to be more common in Germany, and choline-stabilised orthosilicic acid (ChOSA) in Belgium(Reference Calomme, Cos, D'Haese, Collery, Brätter, Negretti de Brätter, Khassanova and Etienne8). The chemistries of these differ in that MMST is not only organic but also monomeric, while the other silicates show varying degrees of polymerisation, which may explain the differential absorption that experiments in rats and preliminary experiments in human subjects have suggested(Reference Jugdaohsingh, Anderson and Tucker7, Reference Yokoi and Enomoto12, Reference Jugdaohsingh, Reffitt and Oldham13). Indeed, collation of findings from several papers suggests all of the above, but none of this work has been undertaken in one study – i.e. a side-by-side comparison study. Thus the purpose of the present study was to include the ingestible sources of high Si content in one study and determine their relative/comparative absorption. This may not only better inform dietary Si databases for use in epidemiological studies, so that they can be refined to take account of intestinal availability, but is also relevant to recent Food and Drug Administration and European Union efforts to use micronutrient absorption from supplements as one indication of their quality.
Here we used an in vitro screening assay and then followed with an in vivo absorption protocol based upon previous work that used urinary Si as a proxy for Si absorption(Reference Reffitt, Jugdaohsingh and Thompson14).
Materials and methods
Materials
Water was ultra-high purity (UHP; 18 MΩ/cm) from an Elga water purifier (Elga Ltd, High Wycombe, Bucks, UK). Horsetail capsules were purchased from Good ‘n’ Natural Manufacturing Corporation (Bohemia, NY, USA). High-strength silica complex tablets (referred to as ‘silica complex’ in the following text) were from Holland and Barrett (Nuneaton, Warwicks, UK). ChOSA was obtained from BioMinerals NV (Destelgergen, Belgium). Magnesium trisilicate mixture British Pharmacopoeia (BP) (referred to as magnesium trisilicate BP in the text) was from Lloyds Pharmacy Ltd (Coventry, Warwicks, UK). Colloidal silica was from Saguna GmbH (Bielefeld, Germany). MMST was obtained from LLR-G5 Ltd (Castlebar, Co. Mayo, Republic of Ireland). Alcohol-free beer (Clausthaler Premium Classic) was bottled by Surfax Ltd (Sawbridgeworth, Herts, UK). Bananas and sliced frozen green beans were purchased from local Sainsbury's and Safeway supermarkets in London, UK, respectively. Sodium silicate (14 % NaOH and 27 % SiO2 (7 mol Si/l)) and hydrochloric acid (HCl, 5 mol/l) were purchased from Aldrich Chemical Co. (Gillingham, Dorset, UK). Concentrated (35 %, w/v) HCl was AnalaR grade, from Merck Ltd (Lutterworth, Leics, UK). Nitric acid (65 % (w/v) HNO3) was high purity from Fluka Ltd (Gillingham, UK). NaCl (>99·5 %) was from Sigma Chemical Co. (Poole, Dorset, UK). Ammonium molybdate ((NH4)6Mo7O24·4H2O; AnalaR grade), NaHCO3 (AnalaR) and sulfuric acid (0·5 m-H2SO4, AnalaR, volumetric standard) were from BDH Ltd (Poole, Dorset, UK). Pepsin powder was from Fluka Chemicals (Gillingham, Dorset, UK). Ultrafree-4 centrifugal filter units (5000 nominal molecular-weight cut-off) were from Millipore UK Ltd (Watford, Herts, UK). These were cleaned before use by centrifugation at 3000 rpm with 3 × 4 ml UHP water for 10 min to remove the glycerine preservative on the membrane. Polypropylene transport tubes, pre-washed with UHP water and air-dried (in a class J clean room) before use for blood sample collection were from Sarstedt Ltd (Leicester, Leics, UK). Polypropylene Mauser bottles (2·5 litres) for urine collection were from Aldrich Chemical Co. These were cleaned with 10 % (v/v) HNO3 (AnalaR; BDH Ltd) for 24 h then thoroughly rinsed with UHP water, air dried in a class J clean air room, and pre-weighed before use. These containers were used throughout the study to avoid Si contamination. All intravenous cannulae (1·2 × 45 mm) were from Johnson & Johnson Medical (Pomezia, Italy). Syringes were from Terumo Europe N.V. (Leuven, Belgium). Pasteur pipettes (3·5 ml), used for sample transfer, were from Greiner Bio-One Limited (Stonehouse, Glos, UK).
Preparation of test solutions, foods and silicon supplement
UHP water (0·66 litres) containing orthosilicic acid (21·4 (se 0·5) mg Si) was prepared by diluting 371 μl of concentrated basic sodium silicate into 2·1 litres UHP water to a concentration of 32·5 (se 0·8) mg Si/l and then neutralised with 5 m-HCl to pH 7·0(Reference Sripanyakorn, Jugdaohsingh and Elliott15). The Si concentration was determined by inductively coupled plasma optical emission spectrometry (ICPOES). The solution was prepared at least 24 h before ingestion unless otherwise stated. ChOSA was prepared by adding 1 ml of the product (20 mg Si/ml) to 199 ml UHP water and then immediately ingested. Sliced frozen green beans were cooked in an 800 W microwave oven without water for 7 min before ingestion. Alcohol-free beer, bananas (ripe and peeled), magnesium trisilicate BP, colloidal silica and MMST were ingested without any further preparation or dilution.
Dissolution study
To identify potentially bioavailable sources of Si for further human intervention studies, the dissolution of several ‘over-the-counter’ Si-containing products was first studied. These were horsetail capsules, high-strength silica complex tablets, ChOSA (viscous liquid or suspension), magnesium trisilicate BP (suspension) and colloidal silica (suspension). Half of each tablet or capsule, or 0·25 ml liquid or suspension, was weighed in a 10 ml polypropylene tube, mixed thoroughly with 5 ml simulated gastrointestinal fluid (SGIF), and then pre-heated to 37°C in a water-bath. SGIF (pH 1·25) was prepared according to the British Pharmacopoeia(16). Briefly, 2 g NaCl were dissolved in 80 ml 1 m-HCl and 920 ml UHP water and, just before use, 3·2 g pepsin powder was added. The Si-containing products, mixed with 5 ml pre-warmed (to 37°C) SGIF, were placed in pre-washed dialysis bags (12 500 nominal molecular-weight cut-off), which were then placed in a 50 ml tube containing 30 ml pre-warmed (to 37°C) SGIF (pH 1·25). After 2 h, the SGIF mixture in the surrounding solution was pH adjusted to 7·0 (i.e. intestinal conditions) with 1 m-NaHCO3; the pH within the dialysis bag was not adjusted. The SGIF surrounding the dialysis bag was sampled (0·5 ml) into a 10 ml polypropylene tube at time intervals (0 min, 15 min, 1 h, 2 h, 4 h, 6 h and 24 h) and diluted with 2·5 ml 0·7 % HNO3 with or without prior ultrafiltration before elemental analysis by ICPOES(Reference Sripanyakorn, Jugdaohsingh and Elliott15).
Absorption study
Subjects
Healthy volunteers (aged 19–40 years; sixteen males and sixteen females) with normal serum creatinine levels were recruited by circular email from King's College London. Ethical approval was obtained from King's College London Local Research Ethics Committee. Subjects who had been taking Si supplements and/or medicines containing Si were excluded. Subjects with a history of chronic illness were also excluded, as were pregnant and lactating women. Before the study, the volunteers signed a consent form immediately following oral and written explanation of the study details. Age, sex, height, weight, BMI and serum creatinine were recorded for each subject. Subjects fasted overnight from 22.00 hours and remained fasted until 14.30 hours the following day (end of the study period), except for the ingestion of the test solutions or meals and the UHP water that were supplied at 08.30 hours and 11.30 hours, respectively. Subjects were asked to avoid high-Si-containing foods 24 h before the start of the study; these were beer, breakfast cereals, rice and certain vegetables and fruit, particularly bananas and green beans.
Sample size
Urinary excretion of Si, used as a surrogate marker of bioavailable Si(Reference Jugdaohsingh, Anderson and Tucker7, Reference Reffitt, Jugdaohsingh and Thompson14), was used to estimate the sample size required for the present study. From a previous study, a standard deviation (σ) of 9·4 % was estimated for the percentage excretion of urinary Si(Reference Sripanyakorn, Jugdaohsingh and Elliott15). We recognise from our previous studies that baseline serum Si levels and Si absorption can vary quite substantially between subjects; so, to keep subject numbers manageable, quite large differences in Si absorption and excretion are required between test substances. Thus a potential difference of 20 % for excretion of urinary Si between subjects after ingestion of the test substances was assumed with 90 % power at a significance level of 95 %. Five completed subjects were estimated to be the minimum required for each test.
Study design
Due to the practicalities of organising one large study, four separate studies were conducted to investigate bioavailability of Si from the eight different sources. The exact subject numbers for each study depended on the number of volunteers available at the times of investigation, although a minimum of five, as noted above, was used except in one instance. In study 4, we initially intended to investigate absorption of Si from MMST only, but then decided to also assess absorption from colloidal silica, so that three products could be compared for simulated gastrointestinal digestion in vitro v. absorption in vivo. Three of the fourteen volunteers agreed to undertake this additional test. In each study (except study 4), subjects ingested two test foods or products in a randomised order on two separate weeks to allow for 1-week washout between tests. However, in study 4, eleven of the fourteen subjects undertook just one absorption test.
In study 1, subjects (three males and two females) ingested 660 ml alcohol-free beer containing 22·9 mg Si or the same volume of a solution of orthosilicic acid containing 21·5 mg Si as a positive control(Reference Jugdaohsingh, Anderson and Tucker7, Reference Sripanyakorn, Jugdaohsingh and Elliott15). In study 2, subjects (three males and two females) ingested 250 g peeled bananas (13·6 mg Si) or cooked green beans (6·1 mg Si). In study 3, subjects (four males and four females) ingested 200 ml UHP water supplemented with 20 mg Si from ChOSA (20 mg Si/ml) or 12·4 ml magnesium trisilicate BP containing 200 mg Si followed by 187·6 ml UHP water. In study 4, subjects (six males and eight females) ingested 60 ml MMST containing 6·9 mg Si or, in a small subset of subjects (n 3), ingested 60 ml colloidal silica containing 780 mg Si. The doses ingested for the latter four tests were the maximum doses recommended by the manufacturers, because, despite large differences in dose between the test substances, we anticipated that this would be counter-balanced by their differing degrees of absorption. In addition, we wished to ensure that detectable absorption was seen for all test substances and, as there is no evidence for saturation of the absorption pathway (here or published elsewhere), we chose the highest doses.
For all four studies, on day 1 (week 1), at 08.30 hours fasted subjects emptied their bladder and thereafter collected urine for 3 h (i.e. between 08.30 and 11.30 hours) in a pre-cleaned, pre-weighed container to determine their baseline Si excretion. Subjects ingested 0·6 litres UHP water over this period and returned to their normal eating habits thereafter, but avoided foods and drinks high in Si as mentioned previously, and then fasted again after 22.00 hours.
On day 2 (week 1) at 08.30 hours, the same fasted subjects emptied their bladder and an intravenous cannula was inserted into a forearm vein. Two 5–10 ml blood samples were collected for baseline Si measurements. Subjects then ingested one of the test solutions, products or meals as mentioned above. Further blood samples (5–10 ml) were collected at 30 min intervals for the first 2 h and then at 1 h intervals for the remaining 4 h. Subjects also collected urine in two 3 h collections (i.e. 08.30–11.30 hours and 11.30–14.30 hours) in two separate pre-cleaned, pre-weighed containers. Subjects ingested 0·5–0·7 litres UHP water over each 3 h period (08.30–11.30 hours and 11.30–14.30 hours).
On week 2, the same fasted subjects repeated the procedure described above, but ingested the alternative solution, food or product for their group (i.e. orthosilicic acid on week 2 if subjects had alcohol-free beer on week 1 and vice versa; bananas on week 2 if subjects had cooked green beans on week 1 and vice versa; ChOSA on week 2 if subjects had magnesium trisilicate BP on week 1 and vice versa; colloidal silica on week 2 if subjects had MMST on week 1 and vice versa).
Collection of serum
Blood samples were collected from the cannula in the forearm vein into a clean 10 ml polypropylene tube and left to stand for at least 1 h to clot. The clotted blood samples were then centrifuged at 3000 rpm (IEC6000B; Thermo Scientific, Dunstable, Beds, UK) for 10 min at 4°C. Sera were separated into 10 ml polypropylene transport tubes and stored at − 20°C until elemental analysis. Blood samples were processed in a class C laminar clean-air cabinet to avoid Si contamination from ubiquitous airborne dust.
Collection of urine
Urine collections were weighed and then a 10–100 ml homogeneous sample was sampled into a polypropylene bottle and diluted with an equal volume of 0·7 % (v/v) HNO3 to reduce any precipitation of minerals during storage at 4°C until elemental analysis(Reference Burden, Powell and Thompson17).
Elemental analysis
Analysis for total Si was by ICPOES (JY 24; Horiba Jobin Yvon SAS, Longjumeau, France) with a V-groove nebuliser and Scott-type double-pass spray chamber at 251·611 nm. Analysis was by peak profile with a window size of 0·1 nm with fifty-four increments per profile. Integration times were 0·5 s and 0·3 s per increment for serum and urine, respectively(Reference Sripanyakorn, Jugdaohsingh and Elliott15). Sample flow rate was 1 ml/min.
Before analysis, serum samples were diluted 1+4 with 0·25–0·7 % (v/v) HNO3. Diluted urine samples were incubated in their closed containers at 40°C overnight to re-dissolve any urinary precipitates and then allowed to cool to room temperature before analysis(Reference Burden, Powell and Thompson17). Sample-based standard solutions were used (i.e. pooled diluted serum or pooled diluted urines spiked with Si from a standard inductively coupled plasma solution).
All samples were analysed at least in duplicate. The detection limit for the measurement of Si was 5 μg/l in aqueous 0·7 % (v/v) HNO3. Since serum and urine samples were diluted 1+4 and 1+1, respectively, detection limits for Si in the original undiluted samples were 25 and 10 μg/l, respectively (there was no difference in sensitivity between diluted acid and diluted samples). There are no standard reference materials for Si in biological samples, but recovery was assessed by spiking sera and urine samples with known concentrations of Si and then preparing and analysing them as above. Recoveries were 100·2 (se 9·5) % for serum samples (thirty-three different spiked samples, assessed in duplicate) and 99·5 (se 2·3) % for urine (eighteen different spiked samples, assessed in duplicate). Precision was calculated by analysing prepared standards on four different occasions. Three standards were prepared in serum, containing 110 parts per billion (ppb), 270 ppb and 534 ppb Si, and the precisions were 101 (se 16), 99·8 (se 1) and 101 (se 5) %, respectively. Similarly, three standards were prepared in urine, containing 1·0 parts per million (ppm), 9·95 ppm and 20·4 ppm Si, and the precisions were 97·2 (se 6), 98·3 (se 3·2) and 100·4 (se 0·8) %, respectively.
As serum and urine samples were diluted with 0·25–0·7 % (v/v) nitric acid, contamination of Si in the acid was also determined by preparing and analysing the acid samples (or blank) identically as per serum and urine samples. Although minor, this contaminant Si was subtracted from the samples.
Statistical analysis
All the data are presented as mean values with their standard errors unless otherwise specified. Repeated-measures ANOVA was used to compare the increase above baseline in serum and urinary Si following ingestion of the test foods or products and also for the assessment of the efficiency of dissolution with simulated digestion in the in vitro screening assay. ANOVA was used to compare differences in baseline serum and urinary Si and characteristics of subjects among the groups. Statistical analyses were two sided and a P value ≤ 0·05 was defined as significant. SPSS software (SPSS Inc., Chicago, IL, USA) was used for all analyses.
Results
Dissolution study
Among the products tested under simulated gastrointestinal conditions, ChOSA had the greatest dissolution, followed by magnesium trisilicate BP, colloidal silica, and horsetail, respectively (all P < 0·001 by repeated-measures ANOVA; Fig. 1). These were soluble only under simulated intestinal conditions of the assay (i.e. pH 7, 2–22 h) and not under gastric conditions (pH 1·25) for the short period of exposure (2 h; Fig. 1). Silica complex did not dissolve (Fig. 1). The three most soluble products, namely ChOSA, magnesium trisilicate BP and colloidal silica were then further studied in the in vivo absorption study.
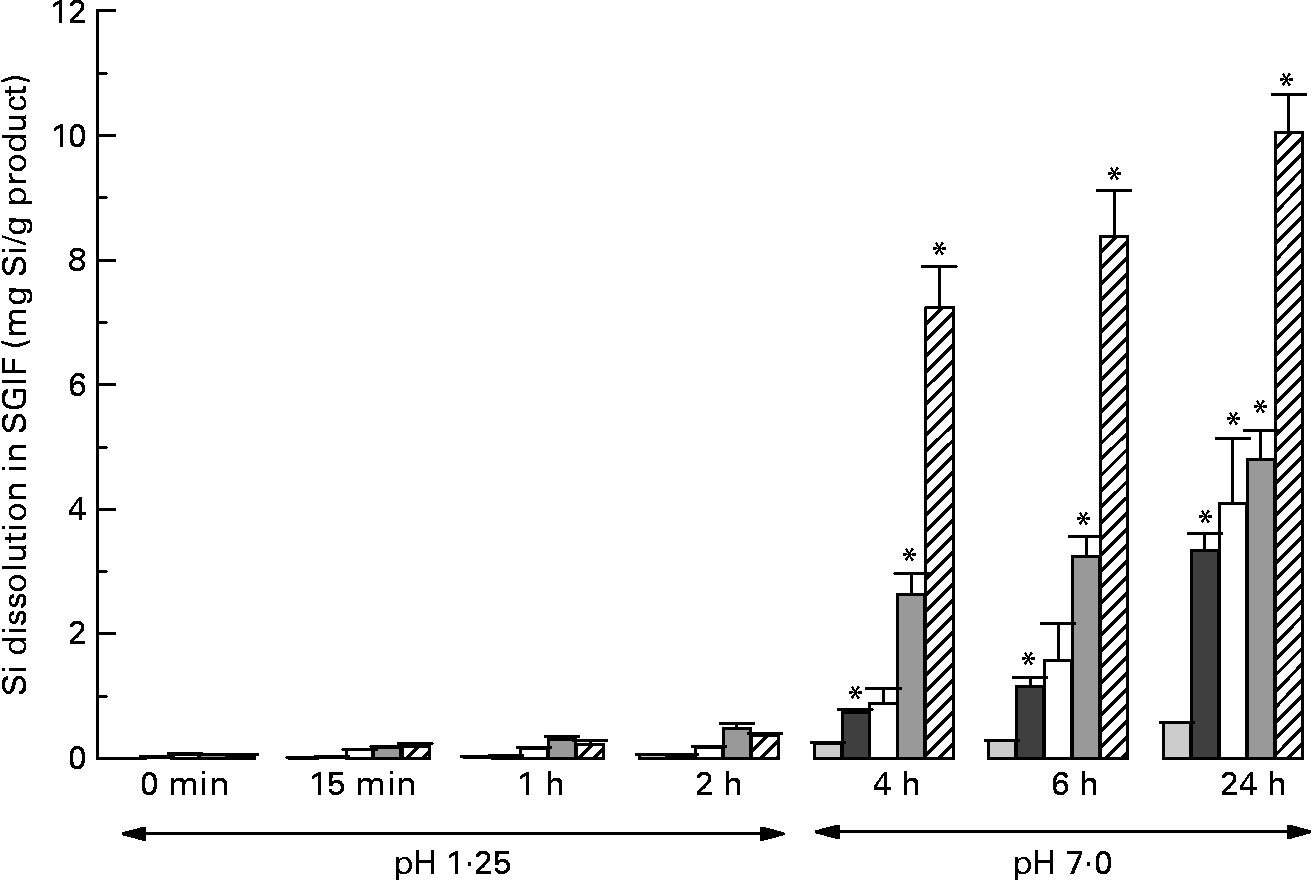
Fig. 1 Dissolution (mg Si/g product) of Si from different Si-containing products and supplements under simulated gastrointestinal (SGI) conditions at timed intervals following neutralisation of SGI fluid (SGIF) from gastric to intestinal pH. (![]() ), Silica complex; (
), Silica complex; (![]() ), horsetail; (□), colloidal silica; (
), horsetail; (□), colloidal silica; (![]() ), magnesium trisilicate British Pharmacopoeia; (
), magnesium trisilicate British Pharmacopoeia; (![]() ), choline-stabilised orthosilicic acid (BioSil; BioMinerals NV, Destelgergen, Belgium). Results are means of three samples, with standard errors represented by vertical bars. *Mean value was significantly different from that at baseline (i.e. 0 min) (P < 0·01; repeated-measures ANOVA).
), choline-stabilised orthosilicic acid (BioSil; BioMinerals NV, Destelgergen, Belgium). Results are means of three samples, with standard errors represented by vertical bars. *Mean value was significantly different from that at baseline (i.e. 0 min) (P < 0·01; repeated-measures ANOVA).
Absorption study
Subject characteristics are given in Table 2. All subjects had normal serum creatinine concentrations, confirming that they had normal renal function.
Table 2 Characteristics of subjects
(Mean values with their standard errors and ranges)

OSA, orthosilicic acid; ChOSA, choline-stabilised orthosilicic acid (BioSil; BioMinerals NV, Destelgergen, Belgium); BP, British Pharmacopoeia; MMST, monomethyl silanetriol (LLR-G5 Ltd, Castlebar, Co. Mayo, Republic of Ireland).
* Bananas were ripe and peeled. Greens beans were cooked.
† As explained in the Materials and methods section, only three of the fourteen subjects in this group undertook the ingestion test with colloidal silica.
‡ Normal creatinine levels: 80–122 μmol/l for males; 65–101 μmol/l for females.
Serum silicon
The mean baseline (fasting) serum Si concentration was 113·9 (se 11·8) μg/l (range 38·5–326·7 μg/l) (Fig. 2) and, as expected, this increased significantly following the ingestion of a solution containing orthosilicic acid (P < 0·0001) and following the ingestion of alcohol-free beer (P < 0·0001) with peak concentrations observed about 1.5 h following ingestion (Fig. 2(a)). Serum levels had almost returned to baseline by the end of the study period (i.e. at 6 h) in both groups. A significant increase in serum Si concentration was also observed following the ingestion of green beans (P = 0·04) but, interestingly, not with bananas (250 g) (P = 0·43) despite their high Si content (Fig. 2(b)). Additionally, serum Si increased significantly following the ingestion of colloidal silica (780 mg Si; P < 0·001), magnesium trisilicate BP (200 mg Si; P < 0·0001), ChOSA (20 mg Si; P < 0·0001) and MMST (6·9 mg Si; P < 0·0001) (Figs. 2(c) and (d)). Peak serum Si concentrations were observed 2 h following the ingestion of ChOSA and colloidal silica and at 4 h for magnesium trisilicate BP, but earlier at about 30 min for MMST and green beans. Notably, after the ingestion of magnesium trisilicate BP and colloidal silica the serum Si concentrations were still markedly elevated above baseline at the end of study period (i.e. at 6 h).

Fig. 2 Serum Si (μg/l) over the 6 h period following the ingestion of: (a) an orthosilicic acid (OSA) solution containing 21·4 mg Si (–○–; n 5) and alcohol-free beer containing 22·9 mg Si (–●–; n 5); (b) cooked green beans containing 6·1 mg Si (–△–; n 5) and ripe, peeled bananas containing 13·6 mg Si (–▲–; n 5); (c) colloidal silica containing 780 mg Si (–□–; n 3) and magnesium trisilicate British Pharmacopoeia (BP) containing 200 mg Si (–■–; n 8); (d) choline-stabilised orthosilicic acid (ChOSA) containing 20 mg Si (–♦–; n 8) and monomethyl silanetriol (MMST) containing 6·9 mg Si (–⋄–; n 14). Results are means, with standard errors represented by vertical bars. To allow for optimal clarity of figures with respect to graphical overlap, each of (c) and (d) show one set of data from study 3 and from study 4; i.e. magnesium trisilicate BP (shown in (c)) was ingested in study 3 with ChOSA (shown in (d)), while colloidal silica (shown in (c)) was ingested in study 4 with MMST (shown in (d)). Si-containing supplements and products were ingested at the maximum dose recommended. The increase in serum Si following the ingestion of alcohol-free beer, OSA, magnesium trisilicate BP, ChOSA and MMST was statistically significant (all P < 0·0001), as it was for colloidal silica (P < 0·001) and green beans (P = 0·04), but not for bananas (P = 0·43).
Urinary silicon
The mean baseline fasting urinary Si excretion was 0·745 (se 0·053) mg per 3 h (range 0·236–1·589 mg per 3 h) (Fig. 3). A significant increase in urinary Si over a 6 h period (collected as 2 × 3 h periods) was observed following the ingestion of orthosilicic acid (P < 0·0001; Fig. 3(a)), alcohol-free beer (P < 0·001; Fig. 3(b)) and green beans (P = 0·04; Fig. 3(c)), but not after the ingestion of bananas (P = 0·13; Fig. 3(d)). Similarly, an increase in urinary Si was also observed following the ingestion of colloidal silica (P = 0·03; Fig. 3(e)), magnesium trisilicate BP (P < 0·001; Fig. 3(f)), ChOSA (P < 0·001; Fig. 3(g)) and MMST (P < 0·001; Fig. 3(h)). Following the ingestion of magnesium trisilicate BP, urinary Si was greatest in the second 3 h collection period, whilst for all foods and food supplements urinary Si excretion was greatest in the first 3 h collection period.

Fig. 3 Urinary Si excretion (mg/3 h) over the 6 period following the ingestion of: (a) an orthosilicic acid (OSA) solution containing 21·4 mg Si (n 5); (b) alcohol-free beer containing 22·9 mg Si (n 5); (c) cooked green beans containing 6·1 mg Si (n 5); (d) ripe, peeled bananas containing 13·6 mg Si (n 5); (e) colloidal silica containing 780 mg Si (n 3); (f) magnesium trisilicate British Pharmacopoeia (BP) containing 200 mg Si (n 8); (g) choline-stabilised orthosilicic acid (ChOSA) containing 20 mg Si (n 8); (h) monomethyl silanetriol (MMST) containing 6·9 mg Si (n 14). Results are means, with standard errors represented by vertical bars (n 5–14, see Table 1). Si-containing supplements and products were ingested at the maximum dose recommended. The increase in urinary Si excretion (0–6 h) was statistically significant following the ingestion of OSA (P < 0·0001), alcohol-free beer (P < 0·001), green beans (P = 0·04), magnesium trisilicate BP (P < 0·001), ChOSA (P < 0·001), MMST (P < 0·001) and colloidal silica (P = 0·03), but not following the ingestion of bananas (P = 0·13).
After correcting for differences in ingested Si dose from the different Si-containing sources, the percentage of the dose excreted in urine over the 6 h period was highest from MMST (64·0 (se 5·3) %; range 30·4–105 %) and alcohol-free beer (60·1 (se 0·8) %; range 57·2–62·0 %), followed by green beans (43·6 (se 14·9) %; range: 22·1–102 %), orthosilicic acid (43·1 (se 3·6) %; range 30·0–50·5 %) and ChOSA (16·5 (se 6·7) %; range 8·57–27·9 %) (Fig. 4). Bananas (3·9 (se 2·0) %; range 0·05–11·7 %), magnesium trisilicate BP (3·7 (se 0·6) %; range 1·46–7·23 %) and colloidal silica (1·2 (se 0·4) %; range 0·96–1·62 %) provided very low increases in urinary Si (Fig. 4). Although the latter group only included three subjects, the consistently low percentage absorption indicates that the results are robust.
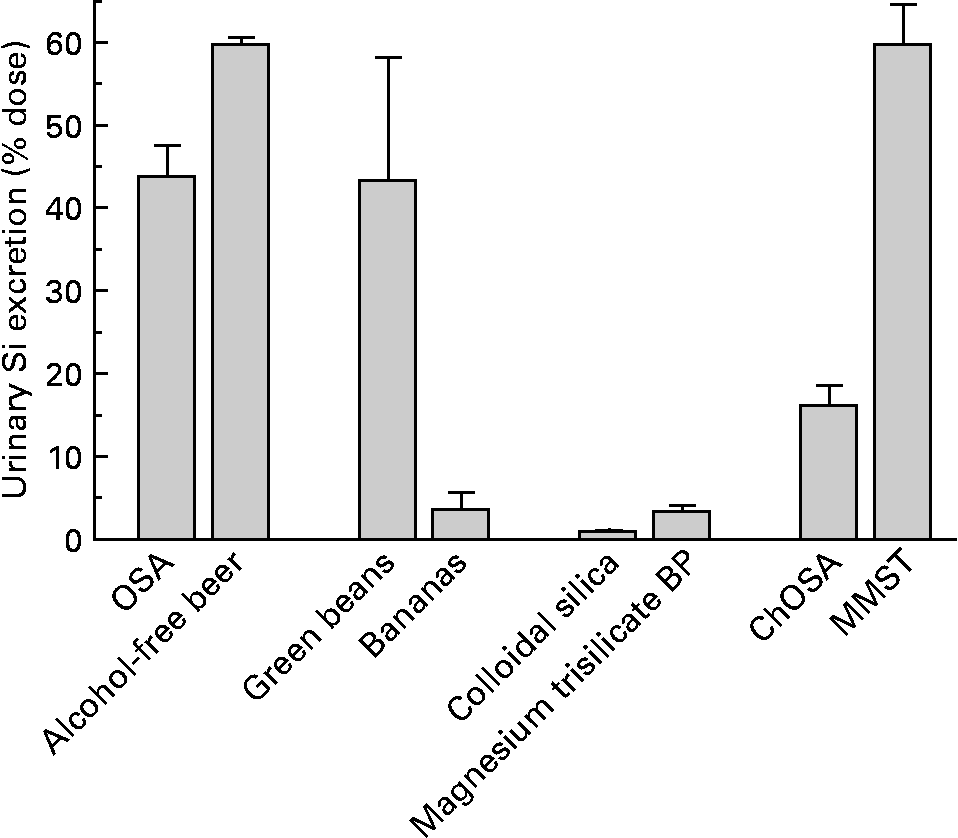
Fig. 4 Percentage increase in excretion of urinary Si over the 6 h period following the ingestion of: an orthosilicic acid (OSA) solution containing 21·4 mg Si (n 5); alcohol-free beer containing 22·9 mg Si (n 5); cooked green beans containing 6·1 mg Si (n 5); ripe, peeled bananas containing 13·6 mg Si (n 5); colloidal silica containing 780 mg Si (n 3); magnesium trisilicate British Pharmacopoeia (BP) containing 200 mg Si (n 8); choline-stabilised orthosilicic acid (ChOSA) containing 20 mg Si (n 8); monomethyl silanetriol (MMST) containing 6·9 mg Si (n 14). Results are means, with standard errors represented by vertical bars. Si-containing supplements and products were ingested at the maximum dose recommended.
Percentage increase in urinary Si following the ingestion of these Si-containing sources over the 6 h study period correlated positively with the increase in serum Si over the same period (i.e. area under the curve 0–6 h) (r 0·82, P < 0·0001; Fig. 5).
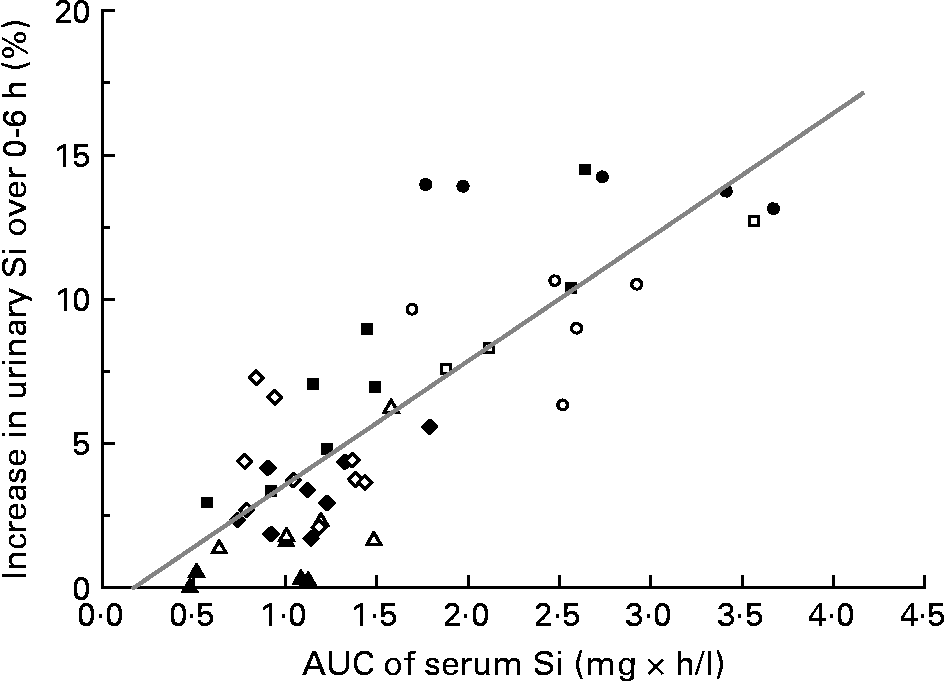
Fig. 5 Correlation (r 0·82, P < 0·0001; n 48) between area under the curve (AUC; 0–6 h) of serum Si (mg × h/l) and the increase in urinary Si excretion following the ingestion of the different Si sources over the 6 h study period: orthosilicic acid (○; n 5); alcohol-free beer (●; n 5); cooked green beans (△; n 5); ripe, peeled bananas (▲; n 5); colloidal silica (□; n 3); magnesium trisilicate British Pharmacopoeia (■; n 8); monomethyl silanetriol (⋄; n 9); choline-stabilised orthosilicic acid (♦; n 8).
Discussion
First, concentrating on the Si sources of known speciation (i.e. fluids and food supplements), our data confirm what has been suggested previously, namely that the degree of polymerisation of Si (i.e. as silicate) is inversely proportional to its intestinal absorption(Reference Sripanyakorn, Jugdaohsingh and Thompson1, Reference Yokoi and Enomoto12–Reference Reffitt, Jugdaohsingh and Thompson14). In other words, monomeric silica (Si(OH)4, orthosilicic acid, soluble silica), which is a small, neutrally charged molecule, is readily absorbed in the gastrointestinal tract, while larger, charged polymers and colloidal species need to be broken down to the soluble monomer in the gastrointestinal lumen before absorption(Reference Jugdaohsingh, Reffitt and Oldham13, Reference Reffitt, Jugdaohsingh and Thompson14). The rate (kinetics) of dissociation or dissolution of the polymers or colloids will depend upon the degree of polymerisation(Reference Yokoi and Enomoto12, Reference Iler18).
The solubility limit of silica is about 2–3 mm at intestinal, peri-neutral pH(Reference Iler18). Drinking water and other beverages, including beer, have total Si concentrations lower than 2 mm and, thus, predominantly contain the soluble monomeric species giving high gastrointestinal absorption(Reference Sripanyakorn, Jugdaohsingh and Elliott15). At higher Si concentrations (>2–3 mm), as is present in most supplements, larger and less absorbable polymers or colloids of silica are present. The exception is MMST, which is presented as a silica supplement in solution, and where a methyl group replaces one hydroxyl group of orthosilicic acid, which raises the solubility limit of Si and maintains it in a small, monomeric and well-absorbed(Reference Allain, Cailleux and Mauras19) form. ChOSA, also presented in solution, albeit highly concentrated, is polymerised, although extensive polymerisation and aggregation of silica particles are prevented by the presence of a high concentration of choline in the supplement. This we confirmed with ultra-filtration of the supplement (which is a viscous fluid) without dilution, finding negligible Si that was ultra-filterable (less than nominal 3000 kDa), but upon dilution to 1+155 with pH 7 buffer, 58 % of the Si was then ultra-filterable (data not shown). Thus, the choline protects the silica from extensive polymerisation and precipitation by maintaining it in aqueous suspension, so that upon further dilution before ingestion it will start to depolymerise to form orthosilicic acid. Clearly this is not as efficient as starting with monomeric silicate, but goes some way to achieving de-polymerisation and bioavailable Si(OH)4 (i.e. 17 % absorbed from ChOSA v. 45–65 % from the other sources). In contrast, ‘colloidal silica’, which is in fact precipitated and completely polymerised silica, showed very low absorption (less than 2 %), presumably because it is so aggregated and the rate of hydrolysis in the gastrointestinal lumen is slow compared with the window of opportunity for absorption in the small bowel. It is well recognised that silica is more soluble under near-neutral conditions (intestinal conditions) compared with mildly acidic conditions (i.e. gastric conditions)(Reference Iler18) and, as shown in Fig. 1, the release of Si from colloidal silica by 4 h of simulated digestion was still low compared with that of ChOSA, for example.
The above findings are therefore important for two reasons. First, they inform on the mechanisms of Si absorption and the requirements for luminal processing and chemical speciation, while second, in further epidemiological studies (for example, Jugdaohsingh et al. (Reference Jugdaohsingh, Tucker and Qiao4) and Macdonald et al. (Reference Macdonald, Hardcastle and Jugdaohsingh5)) and intervention studies(Reference Spector, Calomme and Anderson20) adjustments could be made for the different forms of supplemental Si that have been ingested. It is also interesting to note that a number of misnomers occur with these commercial supplements. For example, what is referred to by the manufacturers as ‘colloidal silica’ is really particulate silica, while choline-stabilised ‘orthosilicic acid’ is choline-stabilised colloidal or nanoparticulate silica.
The results with magnesium trisilicate BP are more difficult to interpret. First, this is an antacid and so buffers the gastric environment. Second, there was a very long absorption profile for Si from magnesium trisilicate BP and, hence, urinary Si excretion, which is used as a proxy for absorption, was not near completion by 6 h. It is likely that the gastric buffering and the slow absorption are related. Although as noted above, silicate requires less acid conditions for its dissolution, the initial disaggregation of solid-phase materials (i.e. magnesium trisilicate) may well require acid digestion and presumably with buffering this is slow. Hence, the opportunity for subsequent silicate dissolution is similarly slow and relatively short-lived. However, based upon our findings in the present study with another form of polymerised and aggregated Si, namely colloidal silica, it is likely that the percentage absorption from antacids is also of small magnitude. Nonetheless, antacids are sometimes taken in extremely high doses for long periods of time and, indeed, the appearance of Si-containing kidney stones is well reported in high-dose, long-term antacid users(Reference Dobbie, Smith, Evered and O'Connor11, Reference Dobbie and Smith21). This may be rare, but illustrates that even if percentage absorption is low, Si uptake can be excessive if the dosing is high enough and prolonged.
Our observations on the absorption of Si from solid foods are also interesting. Si occurs in the plant-based aspect of the diet and is referred to as phytolithic silica. As preliminary evidence has suggested, this phytolithic silica is not a single entity (i.e. a single Si species), but may mirror the complex situation with supplements described above (i.e. a mixture of different species). The absorption of Si from bananas was very poor, as previously reported by us(Reference Jugdaohsingh, Anderson and Tucker7), and so it is likely that this is a well-polymerised form of Si that cannot be efficiently hydrolysed in the gut. In contrast, Si is well absorbed from green beans, again, confirming our previous report(Reference Jugdaohsingh, Anderson and Tucker7), and this therefore must be in a much more labile form that is easily dissolved in the gastrointestinal tract. Thus, in epidemiological studies it will be important to dissect out which Si-containing foods behave like bananas and which like green beans, so that a weighting can be applied for bioavailability. It may well be that bananas are the exception for high-Si-containing foods because in a small study all other high-Si-containing foods behaved like green beans in providing on average about 40 % absorbable Si(Reference Jugdaohsingh, Anderson and Tucker7). Nonetheless, further work could confirm this.
The kinetics of Si absorption were also studied. In the main, kinetics were in keeping with total absorption such that those foods requiring hydrolysis in the gut before absorption were slow to reach peak serum Si levels (i.e. magnesium trisilicate BP, colloidal silica and ChOSA) compared with monomeric forms of Si. Interestingly, Si from MMST was very rapidly absorbed and presumably is related to the organic moiety, which may allow rapid penetration of the intestinal mucosa by the molecule. The observation that Si from green beans is rapidly absorbed is also of interest; the chemical speciation of Si in this food should be undertaken.
The final aspect of the work shown here is that in vitro dissolution probably provides a good guide to the relative absorption for Si in vivo. It does not provide absolute absorption, as it cannot completely model or mimic in vivo conditions. Further work should confirm this, but if this were the case, then provision of a database for dietary Si levels and how they relate to Si absorption could well be achieved by modelling in vitro data with limited supporting in vivo data.
Acknowledgements
S. S. was sponsored by a studentship from the Government of Thailand and R. J. by a Fellowship from The Frances and Augustus Newman Foundation. The Wellcome Trust funded the ICPOES facility and the charitable foundation of The Institute and Guild of Brewing provides running costs for some of the Si research programme (R. J., J. J. P. and R. P. H. T.).
The authors' contributions were as follows: S. S., R. J. and J. J. P. were responsible for the concept and design of the study; S. S., R. J., W. D. and S. H. C. A. were involved with experimental and analytical aspects of the manuscript; S. S. was the study coordinator; S. S., R. J., W. D. and J. J. P. performed data interpretation, presentation and writing of the first draft of the manuscript; R. P. H. T. provided significant academic advice and consultation throughout.
J. J. P. has consulted on several Si supplements. All other authors have no conflict of interest.


