


Lifestyles integrate a set of habits and behaviours that modulate daily living( Reference Cockerham 1 ). They are the strongest determinants of health. The term healthy lifestyle refers to a set of behavioural patterns that are beneficial for health( Reference Abel 2 ).
Lifestyles are associated with the presence of classic cardiovascular risk (CVR) factors – that is, hypertension, diabetes, dyslipidaemia and obesity( Reference Pastor, Balaguer and García-Merita 3 ). Tobacco consumption, an unhealthy diet and sedentary behaviour are the main causes of morbidity and mortality in industrialised countries( Reference Gendron 4 ). Changing these by adopting a healthy lifestyle offers significant health benefits. According to the WHO, 75 % of CVD and 40 % of all cancer cases can be prevented if unhealthy lifestyles are modified( 5 ).
Tobacco consumption is one of the main risk factors for CVD and cancer. It is responsible for at least 30 % of cancer deaths and 80 % of deaths from lung cancer( Reference Hatlen, Langhammer and Carlsen 6 ). In fact, unhealthy lifestyles cause 10 % of CVD and are the second leading cause of CVD after high blood pressure (BP)( 7 ).
Moderate alcohol consumption may favourably impact metabolic health( Reference Churilla, Johnson and Curls 8 ). These findings are in parallel with the relationship between alcohol consumption and CVD prevalence( Reference Yousaf, Rodeheffer and Paterick 9 ). Excessive consumption is harmful and causes dependence, liver disease and cancer. It is one of the top five risk factors for death and disability globally( Reference Torruellas, French and Medici 10 ).
The biological and psychological benefits of physical activity (PA) have extensive scientific evidence( Reference Varo Cenarruzabeitia, Martinez Hernandez and Martinez-Gonzalez 11 ). A low cardiorespiratory fitness (CRF) is associated with an increased risk of cardiovascular morbidity and mortality. Better fitness is associated with reduced mortality risk( Reference Myers, Prakash and Froelicher 12 ). There is also an association between sitting time and mortality( Reference Patel, Bernstein and Deka 13 ).
Diet influences the development of obesity and associated diseases such as hypertension, hypercholesterolaemia, type 2 diabetes and CVD. It predisposes the individual to certain types of tumours( Reference Roche, Phillips and Gibney 14 – Reference Greene and Fernandez 16 ). Bamia et al.( Reference Bamia, Lagiou and Buckland 17 ) found that the Mediterranean diet may have a modest beneficial effect on colorectal cancer risk. Smokers and heavy drinkers are more likely to strongly prefer the fat and salt sensation v. non-smokers and abstainers or infrequent alcohol consumers( Reference Lampure, Deglaire and Schlich 18 ). Individuals with high fat and salt intakes consume more calories and have more sodium levels and drink more alcoholic beverages. They do not consume as much total and simple carbohydrates, fruit and vegetables compared with persons who do not like fats and sweets( Reference Mejean, Deglaire and Kesse-Guyot 19 ).
Although previous studies have shown that patients often have sufficient knowledge about the risks connected to their lifestyles( Reference Condon and McCarthy 20 – Reference Brobeck, Odencrants and Bergh 22 ), little is known about the clustering patterns of lifestyle behaviours in adult populations( Reference Robinson, Jameson and Syddall 23 – Reference Marques, Pizarro and Figueiredo 25 ). Martin-Diener et al.( Reference Martin-Diener, Meyer and Braun 26 ) examined the combined effect of four behavioural risk factors (physical inactivity, smoking, poor diet and alcohol use) on mortality in Swiss epidemiological data sets. They found a significant increase in the likelihood of all-cause mortality, cardiovascular mortality or cancer mortality in people with all four risk factors v. those with none. Lack of PA is among the biggest contributors to death of these risk factors.
The identification of lifestyle clusters can be helpful for medical advice and health education, because lifestyle compliance can impact health and behaviour. The aim of this study was to explore the existence of multiple lifestyle clusters including PA, smoking status, alcohol consumption and dietary habits in an adult population. This study also investigated whether the groups could be characterised by age, sex and clinical variables.
Methods
Design
A cross-sectional and multi-centre study was carried out with six participating groups distributed throughout Spain. These were previously published in the Lifestyles and Endothelial Dysfunction (EVIDENT) study (NCT01083082)( Reference Garcia-Ortiz, Recio-Rodriguez and Martin-Cantera 27 ).
Study participants
The EVIDENT study included 1553 patients aged between 20 and 80 years. They were selected by randomly sampling the population from six Spanish healthcare centres. Study participants were excluded based on known coronary or cerebrovascular atherosclerotic disease, heart failure, moderate or severe chronic obstructive pulmonary disease, walking-limiting musculoskeletal disease, advanced respiratory, renal or hepatic disease, severe mental diseases, cancer in the past 5 years, terminal illness and pregnancy. We excluded subjects who did not have lifestyle data. In eighty-four individuals, the FFQ was missing, 154 had missing accelerometer data, eleven had missing alcohol consumption data and one subject had no smoking data. In total, there were 226 subjects who lacked data on one or more categories, and thus we included the remaining 1327 subjects.
The sample size calculation indicated that the 1327 patients offered the ability to detect a difference of 3 points between two of the three clusters as defined in the Framingham CVR score( Reference D’Agostino, Vasan and Pencina 28 ). This calculation assumed a common sd of 13·4 points with a significance level of 95 % and a power of 80 %. The study has been approved by the Clinical Research Ethics Committee of Salamanca, which was the coordinating centre, as well as by the ethics committees of the collaborating centres. All the participants provided their written informed consent according to the general recommendations of the Declaration of Helsinki( 29 ).
Measurements and lifestyles
We evaluated PA, smoking, alcohol consumption and eating habits as lifestyle criteria.
Nutrition
Food intake and total calories for each participant’s diet were calculated from the data obtained from a previously validated, semi-quantitative, 137-item FFQ collected during the interview( Reference Fernandez-Ballart, Pinol and Zazpe 30 ). The participants indicated the frequencies of consuming various food items using an incremental scale across nine levels: never or almost never, one to three times per month, once per week, two to four times per week, five to six times per week, once per d, two to three times per d, four to six times per d and more than six times per d. The reported frequency of food consumption was converted to the number of daily intake and was multiplied by the weight (g) of the indicated portion size. We detailed the average daily consumption of olive oil, pastries, fish, red meat, nuts fruits, vegetables, grains, eggs, whole-fat dairy and low-fat dairy products.
Tobacco
Smoking history was assessed by asking questions about the participant’s smoking status (smoker/non-smoker) and the number of cigarettes per d for the smokers. We considered smokers to be subjects who currently smoke or who have stopped smoking less than a year ago.
Alcohol
Alcohol consumption was assessed through a structured questionnaire ‘FFQ’ and was expressed in grams per week. In a 137-item food list including alcoholic and non-alcoholic beverages (typical foods in Spain), participants indicated their usual consumption and chose from ten frequency categories ranging from never or <1 time/month to ≥6 times/d.
Physical activity
PA was measured with ActiGraph GT3X accelerometers (ActiGraph; Shalimar)( Reference Melanson and Freedson 31 – Reference Matthews, Keadle and Sampson 33 ). ActiGraph uses a piezoelectric acceleration sensor to filter and convert the signals produced from the sensor at a preset frequency in hertz. The samples are summed over a user-specified time sampling interval called an ‘epoch’. Output from the ActiGraph is in the form of activity ‘counts’, where one count is equivalent to 16 mg/s; 1 g=9·825 m/s2, the acceleration of gravity. Activity ‘counts’ are recorded in the internal memory of accelerometers by converting acceleration units over a given epoch( Reference Chen and Bassett 34 ).
Subjects wore the accelerometer fastened with an elastic strap to the right side of the waist for seven consecutive days with habitual PA except during bathing and other wet activities. All subjects were verbally instructed on how to use the accelerometer. The accelerometer was set to record PA data every minute. The intensity of the PA was determined according to cut-off points proposed by Freedson et al.( Reference Freedson, Melanson and Sirard 35 ), sedentary activity (<100 counts/min), light (100–1952 counts/min), moderate (1952–5724 counts/min), vigorous (>5724 counts/min) and very vigorous (>9498 counts/min). Moderate–vigorous activity was defined as activity accumulated from all bouts lasting at least 1 min.
We also measured clinical variables related to CVR factors. Anthropometric variables, variables related to BP, laboratory variables, as well as inflammatory factors such as fibrinogen and peripheral augmentation index (PAIx), were also measured.
Anthropometric variables
Patients wearing light clothing and no shoes were weighed on two occasions using a homologated electronic scale (Seca 770; Medical Scale and Measurement Systems) following calibration (precision±0·1 kg). Height was measured with a portable system (Seca 222; Medical Scale and Measurement Systems) by recording the average of two readings. The BMI was calculated by dividing the weight (kg) by the height squared (m2). A value of >30 kg/m2 indicated obesity. The waist circumference was measured as follows: the upper margins of the iliac crests were located, and the tape was wrapped around the body above this point parallel to the floor without compressing the skin. A measurement of <102 cm in males and 88 cm in females was characterised as normal( Reference Mancia, De Backer and Dominiczak 36 ). The body fat percentage was measured using a body fat monitor (OMRON, model BF306; Omron Healthcare).
Office or clinical blood pressure
Office BP measurement involved three measurements of systolic BP (SBP) and diastolic BP (DBP) using the average of the last two with a validated sphygmomanometer (OMRON model M10-IT; Omron Health Care) following the recommendations of the European Society of Hypertension( Reference O’Brien, Asmar and Beilin 37 ).
Ambulatory blood pressure monitoring
Ambulatory BP monitoring was performed on a day of standard activity with a radial tonometer. We used a radial pulse wave acquisition device (BPro; HealthSTATS International) that was validated according to the protocol of the European Society of Hypertension, the Association for the Advancement of Medical Instrumentation and the British Hypertension Society( Reference Nair, Tan and Gan 38 , Reference Komori, Eguchi and Hoshide 39 ). Valid registries were required to fulfil a series of pre-established criteria including ≥80 % successful SBP and DBP recordings during the daytime and nighttime, 24-h duration and ≥1 BP measurement/h. The monitor was scheduled to obtain BP measurements every 15 min during the daytime and nighttime. The patients were classified according to circadian patterns estimated by the sleep:wake ratio of SBP:dipper <0·9, non-dipper 0·9–1 and riser >1. The nocturnal SBP dipping was defined as the difference between the mean waking BP and the mean sleeping BP expressed as a percentage (SBP dipping %=100×(mean SBPday−mean SBPnight)/mean SBPday).
Peripheral augmentation index
The PAIx was measured with Pulse Wave Application Software (BPro (A-Pulse); HealthSTATS International) using tonometry to capture the radial pulse; the central BP was estimated with a calculation. This device has been validated in hypertensive Asians and healthy Caucasians( Reference Williams, Lacy and Yan 40 , Reference Garcia-Ortiz, Recio-Rodriguez and Canales-Reina 41 ). Specific aspects of the validity and reliability of the measurement in arterial stiffness and augmentation indices have been reported elsewhere( Reference Garcia-Ortiz, Recio-Rodriguez and Canales-Reina 41 ).
In brief, the intra-observer reliability was evaluated in twenty subjects using the intra-class correlation coefficient at the start of the study. The value of r was 0·952 (95 % CI 0·871, 0·982) for PAIx. According to the Bland–Altman analysis, the mean difference for intra-observer agreement (95 % limits of agreement) was 2·50 (–14·43 and 19·46) for PAIx. PAIx is a measurement taken directly from the late systolic shoulder of the peripheral arterial waveform. It is defined as the ratio of the difference between the second peak and the diastolic pressure to the difference between the first peak and diastolic pressure( Reference Munir, Guilcher and Kamalesh 42 ). PAIx is age dependent and can be a useful index of vascular ageing( Reference Kohara, Tabara and Oshiumi 43 ). PAIx was calculated as follows: (second peak systolic BP (SBP2)−DBP)/(first peak SBP−DBP)×100 (%).
Laboratory determinations
Venous blood sampling was carried out between 08.00 and 09.00 hours after the individuals fasted and abstained from smoking, alcohol and caffeinated beverages for the previous 12 h. Fasting plasma glucose, serum total cholesterol levels, HDL-cholesterol concentrations and TAG concentrations were measured using standard automated enzymatic methods. LDL-cholesterol was estimated using the Friedewald equation when the direct parameter was not available. Blood samples were collected in each primary-care health centre and analysed at the reference hospitals. These laboratories were certified by the external quality assurance programmes of the Spanish Society of Clinical Chemistry and Molecular Pathology.
Cardiovascular risk
Cardiovascular morbidity and mortality risk was estimated using the published risk equation based on the Framingham study( Reference D’Agostino, Vasan and Pencina 28 ). Risk factors for morbidity and mortality used by the Framingham Risk Score included age, total cholesterol, HDL-cholesterol and SBP as quantitative variables. Sex, drug treatment for hypertension, smoking status and diabetes mellitus were dichotomous variables.
Statistical analysis
The continuous variables were expressed as mean values and standard deviations for normally distributed continuous data, and were expressed as the median values and interquartile ranges for asymmetrically distributed continuous data. Categorical data are given as a distribution frequency. Statistical normality was tested using the Kolmogorov–Smirnov test.
In this analysis, we considered a matrix of 1·327 rows (samples) and sixteen columns (variables) to search for clusters (associations of samples). From the sixteen lifestyle variables, eleven are related to diet and are referred to the consumption of olive oil, pastries, fish, red meat, nuts, fruits, vegetables, starches (cereals, legumes and pasta), eggs, whole milk and skim milk. PA was assessed by the total activity (counts/min) and time spent on sedentary and very vigorous activity. The remaining two variables are referred to the consumption of alcohol (g/week) and smoking (number of cigarettes/d).
An HJ-biplot analysis( Reference Galindo 44 ) was carried out to study the associations between all the variables that make up the different lifestyles (PA, smoking, alcohol and eating habits). Using as a basis the information yielded by the multi-dimensional geometric representation HJ-biplot (biplot coordinates) from the different possible clusters, it is possible to choose those that are conceptually interpretable. The clusters were obtained with a k-means method and Euclidean distance. This allows us to know which variables are responsible for the classification of the different representations obtained by the HJ-biplot.
ANOVA with Tukey’s post hoc comparisons tested for differences across the clusters. Differences in sex distribution were assessed by a χ 2 test.
A multivariable linear regression analysis was carried out to study the associations between clinical variables with lifestyle clusters using the unhealthy cluster as a reference (dummy variables). A model for each clinical variable was significant when groups were compared in the initial analysis.
The data were analysed using the MultiBiplot software developed by Vicente–Villardón( Reference Vicente Villardón 45 ) and SPSS version 20·0 (SPSS). A value of P<0·05 was considered statistically significant.
Results
The mean age of the 1327 patients was 55 years, with 806 women (60·7 %). Table 1 shows the baseline characteristics of the study participants.
Table 1 Baseline demographic and clinical characteristics of the patients (Mean values and standard deviations for normally distributed continuous data, median values and interquartile ranges (IQR)) for asymmetrically distributed continuous data and number and proportions for categorical data; n 1327)

blood pressure; DBP, diastolic blood pressure.
* To convert glucose in mg/dl to mmol/l, multiply by 0·0555. To convert cholesterol, HDL-cholesterol and LDL-cholesterol in mg/dl to mmol/l, multiply by 0·0259. To convert TAG in mg/dl to mmol/l, multiply by 0·0113. To convert fibrinogen in mg/dl to μmol/l, multiply by 0·0294.
Fig. 1 shows the factorial graph of the HJ-biplot with the selected variables related to lifestyles represented by vectors. The individuals are indicated by points. The covariance structure of the indices shows a high positive correlation between counts per min and vigorous activity. In contrast, the time (min) spent in sedentary activities forms a 180° angle with these variables, and therefore exhibits a high inverse correlation. With regard to diet, a strong and direct relationship is observed with the consumption of fruits and vegetables and an inverse correlation is observed with alcohol consumption and the number of cigarettes smoked. These variables otherwise show a strong correlation. The consumption of whole-fat dairy products is positively associated with alcohol consumption and the number of cigarettes, and it is inversely associated with low-fat dairy products, fruits and vegetables.
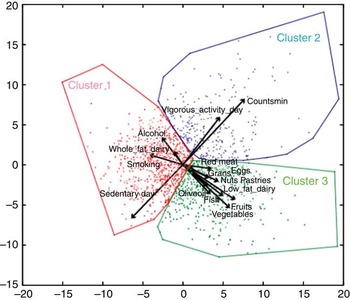
Fig. 1. Factorial representation of HJ by cluster.
The clusters were calculated using the biplot coordinates including method k-means and Euclidean distances. These differentiated the three groups. Table 2 shows a general description of the clusters according to the selected variables.
Table 2 Characteristics of subjects according to lifestyles by clusters(Mean values and standard deviations; median values and interquartile ranges)

* P values are for comparison of sub-groups by ANOVA test with Tukey’s post hoc comparisons and by Kruskal–Wallis test with post hoc comparisons.
† Significant difference between cluster 1 and cluster 2 (P<0<05).
‡ Significant difference between cluster 1 and cluster 3 (P<0<05).
§ Significant difference between cluster 2 and cluster 3 (P<0<05).
Cluster 1 (unhealthy) consists of 677 subjects and includes the majority of individuals (51·0 %) and a slightly larger majority of men (58·7 %). In this cluster, there was more sedentary behaviour (1100·8 (sd 69·8) min/d, P<0·001) and higher consumption of whole-fat dairy products (103·4 (sd 158·2) g/d, P<0·001) and tobacco (3·7 (sd 7·7) cigarettes/d, P<0·001). Cluster 2 (healthy/PA) consists of 265 subjects (24·0 % of the men in the sample). This group had the highest overall PA at 389·2 (sd 87·1) counts/min (P<0·01) and vigorous activity (6·9 (sd 11·0) min/d, P<0·001). Cluster 3 (healthy/diet) represents 29 % of the participants, including a larger fraction of the women (36·6 %) than men (17·3 %). This cluster reflects a high consumption of olive oil (30·8 (sd 17·0) g/d, P<0·001), fish (160·3 (sd 81·4) g/d, P<0·001) as well as fruits, nuts and vegetables. Cluster 3 had the lowest consumption of alcohol (20·2 (sd 37·7) g/week, P<0·001).
The relationships between these clusters and clinical variables are shown in Table 3. Members of cluster 1 have higher values for waist circumference, TAG levels, SBP and CVR. Cluster 2 is characterised by the highest levels of HDL-cholesterol, a larger nocturnal decline in BP and lower overall CVR. Cluster 3 has the lowest values for waist circumference and SBP.
Table 3 Characteristics of subjects according to clinical variables by clusters(Mean values and standard deviations; median values and interquartile ranges)

SBP, systolic blood pressure; DBP, diastolic blood pressure; PAIx, peripheral augmentation index; CVR, cardiovascular risk by Framingham Score.
P values are for comparison of sub-groups by ANOVA test with Tukey’s post hoc comparisons and by Kruskal–Wallis test with post hoc comparisons.
*P<0·05 between cluster 1 and cluster 2, **P<0·05 between cluster 1 and cluster 3, ***P<0·05 between cluster 2 and cluster 3.
Using the unhealthy cluster as the reference and after adjusting for age and sex, the multiple regression analysis showed that belonging to the healthy/PA cluster was associated with a lower waist circumference, body fat percentage, SBP and CVR as well as higher HDL-cholesterol levels and SBP drops. The healthy/diet clusters have similar results except for body fat percentage, HDL-cholesterol levels and SBP changes (Table 4).
Table 4 Multiple linear regression analysis: relationship between clusters and clinical variablesFootnote * (β Coefficients and 95 % confidence intervals)

SBP, systolic blood pressure; CVR, cardiovascular risk by Framingham Score.
* Dependent variables: waist circumference, body fat percentage, HDL-cholesterol, TAG, office SBP, SBP dipping, CVR. Independent variables: clusters (1=unhealthy; 2=healthy/physical activity; 3=healthy/diet). Adjusted by age and sex.
Discussion
The results classify subjects included in the EVIDENT study according to their modifiable lifestyles. It is the first study that uses the HJ-biplot to look for different lifestyle patterns in terms of PA assessed by accelerometry, eating habits with an FFQ questionnaire, smoking status (cigarettes/d) and alcohol consumption (g/week). This technique allows a comprehensive analysis of all variables and reveals three clusters that are different to each other in a random sample from healthcare centres across a wide age range (20–80 years), including healthy subjects and subjects with different levels of CVR. These clusters have been subsequently characterised by age, sex and clinical variables.
We found that cluster 1 (unhealthy) included more than half of the men in the sample. These subjects spent substantial time in sedentary activities, smoking and consuming alcohol. The second cluster (healthy/PA) also included a high percentage of men who had high PA and greater time dedicated to vigorous activities. Cluster 3 (healthy/diet) comprised mostly of women who had a high intake of fruits, nuts and vegetables as well as had low alcohol consumption.
Until now, in the EVIDENT study, modifiable lifestyles were analysed separately( Reference Recio-Rodriguez, Gomez-Marcos and Patino Alonso 46 – Reference Patino-Alonso, Recio-Rodriguez and Belio 48 ); however, with this work, we studied how they relate to one another and their association with clinical variables. Although there is increasing interest in examining the combined effects of lifestyle factors such as smoking, dietary habits, PA and alcohol consumption on disease risk and mortality( Reference Kvaavik, Batty and Ursin 49 , Reference Ford, Bergmann and Boeing 50 ), few studies have investigated the combined impact of these factors( Reference Lee, Sui and Hooker 51 , Reference Lin, Li and Liu 52 ) by analysing the relationship between modifiable lifestyles and clinical variables.
We observed sex differences in the modifiable lifestyles with women showing healthier eating habits. These findings are supported by other studies performed in the elderly( Reference Chou 53 , Reference Liao, Li and Lin 54 ) and the adult population( Reference Kang, Sung and Kim 55 ).
Robinson et al.( Reference Robinson, Jameson and Syddall 23 ) analysed the relationship between a number of lifestyle risk factors (low PA, poor diet, obesity, smoking, etc.) and physical function in 59- to 73-year-old, community-dwelling men and women. They found that these modifiable lifestyle risk factors are linked to marked differences in risk of poor physical function in older adults as well as a modest difference in activity scores between men and women. The women were slightly less active (35·3 v. 30·3 %). These results are similar to our findings where we found a cluster formed mostly by males who developed increased PA. However, unlike this study, they did not consider alcohol consumption in the lifestyles. Indeed, Ottevaere et al.( Reference Ottevaere, Huybrechts and Benser 24 ) studied 2084 adolescents and identified five clusters that are consistent with this study in that males highly represented the cluster with high levels of moderate to vigorous PA (MVPA) and low-quality diets. In terms of lifestyle, they only considered PA and diet in contrast to our work that measured alcohol consumption and smoking.
Marques et al.( Reference Marques, Pizarro and Figueiredo 25 ) enrolled 636 Portuguese students and analysed how health-related variables (BMI, MVPA, CRF and HDL-cholesterol) are clustered and associated with children’s sedentary time. Similar to their results, we found that the cluster called unhealthy also shows the lowest levels of vigorous activity and the highest values of anthropometric parameters. This may be because the age of the subjects is different in the two studies.
The association of the different groups with clinical variables is an important finding. When healthier food is eaten, more exercise is performed and less alcohol and cigarettes are consumed. These subjects also have more reasonable blood pressure, cholesterol and LDL-cholesterol levels, which reduce CVR. These results are consistent with the findings of Martin-Diener et al.( Reference Martin-Diener, Meyer and Braun 26 ), in which the accumulation of four behavioural non-communicable disease risk factors – tobacco smoking, high alcohol consumption, low levels of leisure time PA and poor diet – as indicated by no reported fruit consumption on the previous day – increased all-cause mortality by approximately 2·5-fold. Along this line, Carlsson et al.( Reference Carlsson, Wandell and Gigante 56 ) used a cohort study of 60-year-old people with seven lifestyle factors including alcohol consumption, fish intake, fruit and vegetable consumption, PA, processed meat intake and tobacco smoking. They investigated whether healthy lifestyle factors can predict incident CVD and all-cause mortality. They concluded that it was possible to identify men and women with substantially lower relative risks of incident CVD and death. Recently, Kyrozis et al.( Reference Kyrozis, Ghika and Stathopoulos 57 ), in a study regarding the identification of lifestyle variables associated with the development of Parkinson’s disease, found an inverse association with smoking.
A study by Bel-Serrat et al.( Reference Bel-Serrat, Mouratidou and Santaliestra-Pasias 58 ) in a sample of 4619 children from eight European countries analysed clustered lifestyle behaviours (dietary, PA and sedentary indicators) to examine their association with CVD risk factors. They found a positive association between CVD risk score and the cluster identified as sedentary. These results are consistent with our study where cluster 1 (unhealthy) is the group of subjects with more sedentary activity who are associated with higher CVR values. There were significant differences between this group and the other two (P<0·005).
This study has certain limitations. It is a descriptive observational study that only reports associations and cannot establish causal relationships between the defined clusters and clinical variables. However, it describes patterns of association of lifestyles and their relationship with biological parameters and CVR.
In conclusion, three groups were identified according to lifestyles: ‘cluster unhealthy’ with the least healthy lifestyles and most unfavourable clinical parameters; ‘cluster healthy/PA’ characterised by increased PA, good HDL-cholesterol levels and an increased systolic dipping; and ‘cluster healthy/diet’ characterised by good eating habits and lower LDL-cholesterol levels and clinical blood pressure values.
Acknowledgements
The project has been funded by the Instituto de Salud Carlos III (Institute of Health Carlos III, ISCiii) of the Ministry of Economy and Competitiveness (Spain) through the Network for Prevention and Health Promotion in Primary Care (redIAPP, RD12/0005), by a grant for research projects on health from ISCiii (PS09/00233, PS09/01057, PS09/01972, PS09/01376, PS09/0164, PS09/01458), co-financed with European Union ERDF and the Autonomous Government of Castilla and León (SAN/1778/2009) and intensification of research programme. The funders had no role in the design, analysis or writing of this article.
We are grateful to all professionals participating in the EVIDENT study.
M. C. P.-A., designed the study, participated in fund raising, interpreted the results, prepared the manuscript draft and corrected the final version of the manuscript. J. I. R.-R. and J. F. M. B. participated in the study design, data collection and manuscript review. M.G.-G., V. M. V., C. F. A. and M. S. A. participated in the study design, interpretation of results and manuscript review. M. A. G.-M. and L. G.-O. participated in the protocol design, fund raising, analysis of results and final review of the manuscript. Finally, all authors reviewed and approved the final version of the manuscript.
The authors declare that they have no conflicts of interests.
Supplementary Material
For supplementary materials for this article, please visit http://dx.doi.org/10.1017/S0007114515002500
Appendix: Members of the EVIDENT group are as follows
Coordinating centre
L. Garcia Ortiz, M. A. Gómez Marcos, J. I. Recio Rodriguez and M. C. Patino-Alonso of the Primary Care Research Unit of La Alamedilla Health Center, Salamanca, Spain.
Participating centres
La Alamedilla Health Center (Health Service of Castilla y León): M. C. Castaño Sánchez, C. Rodríguez Martín, Y. Castaño Sánchez, C. Agudo Conde, E. Rodríguez Sánchez, L. J. González Elena, C. Herrero Rodríguez, B. Sánchez Salgado, A. de Cabo Laso and J. A. Maderuelo Fernández. Passeig de Sant Joan Health Center (Catalan Health Service): C. Martín Cantera, J. Canales Reina, E. Rodrigo de Pablo, M. L. Lasaosa Medina, M. J. Calvo Aponte, A. Rodríguez Franco, E. Briones Carrio, C. Martin Borras, A. Puig Ribera and R. Colominas Garrido. Poble Sec Health Center (Catalán Health Service): J. Anton Alvarez, MªT. Vidal Sarmiento, Á. Viaplana Serra, S. Bermúdez Chillida and A. Tanasa. Ca N’Oriac Health Center (Catalan Health Service): M. Romaguera Bosch. Sant Roc Health Center (Catalán Health Service): M. M. Domingo, A. Girona, N. Curos and F. J. Mezquiriz, L. Torrent. Cuenca III Health Center (Health Service of Castilla-La Mancha): A. Cabrejas Sánchez, M. T. Pérez Rodríguez, M. L. García García, J. L. Bartolomé and F. Salcedo Aguilar. Casa de Barco Health Center (Health Service of Castilla y León): C. Fernández Alonso, A. Gómez Arranz, E. Ibáñez Jalón, A. de la Cal de la Fuente, N. Gutiérrez, L. Muñoz, M. Menéndez, I. Repiso, R. Sanz Cantalapiedra, L. M. Quintero González, S. de Francisco Velasco, MÁ. Diez García, E. Sierra Quintana and M. Cáceres. Torre Ramona Health Center (Health Service of Aragon): N. González Viejo, J. F. Magdalena Belio, L. Otegui Ilarduya, FJa. Rubio Galán, A. Melguizo Bejar, C. I. Sauras Yera, MªJ. Gil Train, M. Iribarne Ferrer and MÁ. Lafuente Ripolles. Primary Care Research Unit of Bizkaia, Basque Health Service-Osakidetza: G. Grandes, A. Sanchez, N. Guenaga, V. Arce, M. S. Arietaleanizbealoa, E. Iturregui San Nicolás, R. A. Martín Santidrián and A. Zuazagoitia.


