


n-3 Fatty acids have been found to be beneficial for bone health in both humans and experimental animals. A body of scientific evidence indicates that certain families of PUFA modulate bone cell functions and alter the metabolic activities of both osteoblasts and osteoclasts to affect bone formation and bone resorption. Endogenous tissue concentrations of these PUFA can be modified by exogenous administration of PUFA families through the diet. Thus, exogenous provision of n-3 PUFA changes the fatty acid composition of cell membrane phospholipids to influence cellular biosynthesis of PGE2, which in turn mediates osteoblast and osteoclast functions in bone compartments of rats(Reference Watkins, Li and Allen1, Reference Watkins, Li and Lippman2).
In human studies, it has been shown that consuming γ-linolenic acid and EPA, both of which are precursors of prostanoid derivatives antagonistic to those of arachidonic acid (AA), improved bone quality in elderly female subjects(Reference Kruger, Coetzer and de Winter3). Consumption of n-3 PUFA was also associated with reduced incidence and severity of inflammatory bone/joint diseases in human subjects(Reference Shichikawa, Takenaka and Maeda4) due to their anti-inflammatory properties(Reference Lands5). A recent large epidemiological investigation confirmed that a higher dietary ratio of n-6:n-3 PUFA was inversely correlated to hip bone mineral density (BMD), suggesting that the relative amounts of dietary PUFA and, more importantly, maintaining an appropriate balance between n-6 and n-3 PUFA play a vital role in preserving skeletal integrity and reducing the risk of osteoporosis in humans(Reference Weiss, Barrett-Connor and von Muhlen6).
Numerous studies in animal models demonstrated a positive effect of n-3 PUFA on bone growth. Early studies showed that lowering the dietary ratio of n-6:n-3 PUFA in the skeletal system resulted in elevated bone marrow cellularity(Reference Atkinson, Barker and Meckling-Gill7) and increased alveolar bone strength by measuring tooth movement after applying orthodontic force to the maxillary incisors(Reference Kokkinos, Shaye and Alam8). n-3 PUFA have also been shown to promote bone formation in growing piglets undergoing rapid bone modelling(Reference Weiler and Fitzpatrick-Wong9). Besides their effectiveness in promoting bone formation, n-3 PUFA can also exert a positive role in inhibiting bone resorption(Reference Iwami-Morimoto, Yamaguchi and Tanne10–Reference Kelly, Cusack and Jewell12).
Past feeding studies with rats in our laboratory demonstrate that dietary n-6 and n-3 PUFA modify bone tissue fatty acid composition, affect the capacity of bone to produce PGE2 in ex vivo bone tissue culture, and alter bone mechanical properties and integrity as measured by mechanical strength testing and histomorphometric analysis of bone formation parameters(Reference Watkins, Li and Allen1, Reference Li, Seifert and Ney13, Reference Watkins, Li and Seifert14). Watkins et al. demonstrated that the AA:EPA ratio in bone was positively correlated with ex vivo PGE2 production and that by limiting the capacity for its production by decreasing the dietary ratio of n-6:n-3 PUFA fed to the growing rat, bone formation can be increased(Reference Watkins, Li and Allen1). In further support of this notion, our data also indicate that higher intakes of n-6 PUFA led to increased bone PGE2 production and, as a result, the elevated ratio of AA:EPA in bone was inversely correlated with bone formation rate(Reference Watkins, Li and Allen1). In general, our laboratory and others have demonstrated that long-chain n-3 PUFA (EPA and DHA) are effective in promoting bone formation in growing animals. These results indicate that excessive consumption of n-6 PUFA at the expense of n-3 PUFA has a detrimental effect on bone metabolism by increasing bone resorptive activity (via osteoclasts) through increased endogenous production of PGE2.
In addition to their influence on prostanoid production, dietary n-3 PUFA enhance the activity of serum bone-specific alkaline phosphatase in rats, providing yet additional support for their positive action on bone formation through increased osteoblast function(Reference Watkins, Li and Allen1). We reported that n-3 deficiency compromised bone quality but dietary repletion of n-3 PUFA (α-linolenic acid (ALA) or DHA) in n-3-deficient rats restored the ratio of n-6:n-3 PUFA in bone compartments and reversed compromised bone modelling(Reference Reinwald, Li and Moriguchi15). In that study we also found a significant compensatory response in bone modelling and improved architecture of long bone (femur and tibia) in the n-3 PUFA-replete rats.
In the present study, rats were fed diets having different dietary lipids very early (postnatal day 2) in their lives and remained on the same diets until they reached adulthood. During the feeding period, rats were provided diets supplemented with ALA, or either preformed docosapentaenoic acid (22 : 5 n-6; DPAn-6), DHA, or a mixture of DHA and DPAn-6 as treatments to test the biological efficacy of these on bone modelling. Based on the similarities in carbon chain length and highly unsaturated nature of DPAn-6 and DHA, the lack of knowledge of DPAn-6 effects on bone and the importance of DHA in bone growth and modelling, we proposed to investigate the effects of early nutrition with these long-chain PUFA on bone in young rats. Therefore, we hypothesised that replacing DHA with DPAn-6 would compromise the bone mineral content (BMC) of rats based on the role of DHA in bone modelling and early growth and development. Hence, the objective of the present study was to determine how the different 22-carbon dietary n-6 and n-3 PUFA affect bone metabolism and whether preformed DPAn-6 could functionally replace DHA to maintain normal bone modelling in the growing rat.
Methods
Rats, study design and diets
Pregnant female Long-Evans rats carrying 3 d gestational-age embryos were obtained from Charles River (Portage, MI, USA) and fed a diet (maternal diet) containing adequate concentrations of n-3 fatty acids (3·1 % ALA) (catalogue no. 400625; Dyets Inc., Bethlehem, PA, USA) (Fig. 1(a))(Reference Lim, Hoshiba and Salem16). The rats were maintained in the animal care facility (National Institute on Alcohol Abuse and Alcoholism, National Institutes of Health) with controlled temperature (23 ± 1°C) and illumination (for 12 h between 06.00 and 18.00 hours) and water was provided ad libitum. At postnatal day 2, five male pups were selected from each litter (total of ten litters), which were born within a 12 h time window and randomly assigned to one of five groups. The first group was the control group and pups were allowed to suckle from dams fed the maternal n-3-adequate diet (dam-reared (DR) group). The other four groups were fed one of four experimental milks by an artificial rearing procedure starting at postnatal day 2: an n-3 fatty acid-deficient milk (linoleic acid (LA)), or a similar milk supplemented with 1 % DPAn-6 of total lipids in the diet (DPA), 1 % DHA of total lipids in the diet (DHA), or 1 % DHA–DPAn-6 (2:1) of total lipids in the diet (DHA/DPA) (Table 1)(Reference Lim, Hoshiba and Salem16). The pups were shifted to the pelleted diets after weaning at postnatal day 21 (Table 1). After weaning, rat pups were fed diets that contained similar fatty acid compositions to their respective artificial milks(Reference Lim, Hoshiba and Salem16). The five pelleted experimental diets were modified, based on the American Institute of Nutrition (AIN)-93G formulation(Reference Reeves, Nielsen and Fahey17) with varying amounts of test fatty acids (ALA, LA, DHA and DPAn-6) (Table 1)(Reference Lim, Hoshiba and Salem16). All five diets contained 10 % total dietary fat and had a similar content of LA. The rats were maintained on these diets until they were euthanised at age 15 weeks by decapitation(Reference Lim, Hoshiba and Salem16). The rats (frozen carcass without head) were shipped to B. A. W.'s laboratory in dry ice and stored at − 80°C until analysed. All experimental procedures were approved by the Animal Care and Use Committee of the National Institute on Alcohol Abuse and Alcoholism, National Institutes of Health(Reference Lim, Hoshiba and Salem16).
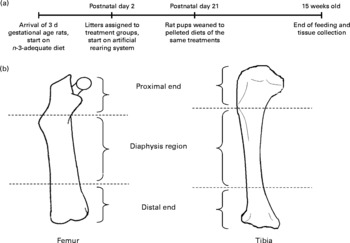
Fig. 1 (a) Time line for the feeding regimen. (b) Anatomical sites of bone dual-energy X-ray absorptiometry analyses.
Table 1 Lipid source and fatty acid composition (weight percentage of total fatty acids) of the pelleted diets and artificial rat milks

DPAn-6, docosapentaenoic acid n-6.
* Dietary treatments after weaning (American Institute of Nutrition (AIN)-93G formulation with 10 % of total diet as lipids): DR, dam reared (3·1 % α-linolenic acid of total lipids); LA, diet supplemented with 15 % (of the total lipids) linoleic acid; DHA, LA diet with the addition of 1 % (of the total lipids) DHA; DPA, LA diet with the addition of 1 % (of the total lipids) docosapentaenoic acid; DHA/DPA, LA diet with the addition of 0·5 % (of the total lipids) docosapentaenoic acid and 1 % (of the total lipids) DHA. Diets are only different in lipid composition across treatment groups.
† Other ingredients of the diet can be found in the earlier publication(Reference Lim, Hoshiba and Salem16) for this animal study.
Lipid extraction, fractionation and fatty acid analysis
Lipids in tissue compartments (periosteum and marrow) of rat left femur and tibia were extracted with chloroform–methanol (2:1, v/v). Thawed bones were carefully freed of musculature before collection of the periosteum by scraping on the bone surface with a surgical blade. Bone marrow was flushed out and harvested with methanol(Reference Watkins, Li and Seifert14). Total lipids extracted were further separated into polar and neutral lipid fractions by solid-phase extraction(Reference Juaneda and Rocquelin18) using silica (600 mg) cartridges (Alltech Maxi-clean; Alltech Associates Inc., Deerfield, IL, USA). Lipid fractions from rat bone compartments were then treated with NaOH in methanol and fatty acid methyl esters prepared with boron trifluoride in methanol (10 %, w/v; Supelco Bellefonte, PA, USA). Fatty acid methyl esters were analysed by GC (Agilent 6890 Plus, autosampler 7683, Chemstation Rev. A.08.03; Agilent Technologies, Inc., Wilmington, DE, USA) using flame ionisation detection. Separation was achieved with a DB-23 fused silica capillary column (30 m, 0·53 mm internal diameter, 0·5 μm film thickness; Agilent Technologies, Inc.) and He used as the carrier gas(Reference Watkins, Li and Allen1, Reference Watkins, Li and Seifert14). Fatty acid methyl esters were identified by comparison of their retention times with authentic standards (GLC-68D, GLC-87 and GLC-96; Nu-Chek-Prep, Inc., Elysian, MN, USA). Fatty acid values were expressed as weight percentages.
Dual-energy X-ray absorptiometry analysis
Two-dimensional BMD and BMC of excised rat bones (right femur, right tibia, and segment of lumbar spine containing L4 vertebra) were assessed using peripheral dual-energy X-ray absorptiometry (DXA) (pDEXA Densitometer Sabre; Norland Medical Systems, Inc., White Plains, NY, USA)(Reference Watkins, Li and Seifert14) (Fig. 1(b)). Briefly, bones were uniformly positioned and immersed in a saline water-bath at a depth of 1·5 cm to enhance scanning resolution(Reference Ammann, Rizzoli and Slosman19). The lumbar segment was scanned and BMD and BMC of L4 were measured. The whole femoral and tibial bones were scanned by DXA and the whole bone, as well as the cortical rich mid-shaft of the diaphysis and trabecular-rich subregions within the proximal and distal 25 % ends of the bones, were calculated based on the DXA scan data according to the protocol used by Dempster et al. (Reference Dempster, Birchman and Xu20).
Statistical analyses
Data for tissue fatty acid composition and DXA results were expressed as the means and pooled standard deviations and significance was determined by one-way ANOVA using SAS (release 8.02; SAS Institute, Inc., Cary, NC, USA). For significantly different findings, the data were evaluated by the Student–Newman–Keuls test. Correlations between bone BMC and selected fatty acids were analysed by the Pearson correlation procedure contained in SAS.
Results
Rat body weight and growth
Body weights of pups on the artificial feeding system were significantly lower compared with those reared by the dam at weaning(Reference Lim, Hoshiba and Salem16). However, at the end of the experimental period, the body weights were not different among the treatment groups.
Femoral marrow and periosteal tissue fatty acid composition
In the neutral lipid fraction of rat femoral marrow tissue, addition of ALA and DHA in three of the treatment diets resulted in significantly increased amounts of 18 : 3n-3 (in DR group only), 22 : 6n-3 and total n-3 PUFA (Table 2). There was no significant difference in 22 : 6n-3 concentrations between the DHA group and the DHA/DPA group. Because of the addition of a large amount of hydrogenated coconut oil in the diet(Reference Lim, Hoshiba and Salem16), the DR group showed the highest amount of 14 : 0 and 16 : 0, and total SFA, while 18 : 1n-9, 20 : 1n-9 and total MUFA were the lowest in this group. The 18 : 2n-6 amount in the femur was highest in the DR group. The DR group also showed the highest amounts of total PUFA and total n-6 PUFA in this tissue. The amounts of 22 : 4n-6 and 22 : 5n-6 were higher in the LA and DPA groups compared with the other three groups that were supplemented with specific amounts of n-3 fatty acids. In femoral neutral lipids, the amount of 20 : 4n-6 was not different among the treatment groups and 20 : 5n-3 was not detected, indicating that this fatty acid did not accumulate in the neutral lipids under the experimental conditions (Table 2).
Table 2 Fatty acid composition (weight percentage) of rat femur marrow neutral lipids
(Mean values and pooled standard deviations for n 5 per group)

ND, not detected; TR, trace amount; NA, not available.
a,b,c Mean values within a row with unlike superscript letters were significantly different (P < 0·05; one-way ANOVA and Student–Newman–Keuls test).
* Dietary treatments after weaning (American Institute of Nutrition (AIN)-93G formulation with 10 % of total diet as lipids): DR, dam reared (3·1 % α-linolenic acid of total lipids); LA, diet supplemented with 15 % (of the total lipids) linoleic acid; DHA, LA diet with the addition of 1 % (of the total lipids) DHA; DPA, LA diet with the addition of 1 % (of the total lipids) docosapentaenoic acid; DHA/DPA, LA diet with the addition of 0·5 % (of the total lipids) docosapentaenoic acid and 1 % (of the total lipids) DHA. Diets are only different in lipid composition across treatment groups.
† Long-chain n-6:n-3 = (20 : 4n-6+22 : 4n-6+22 : 5n-6)/(20 : 5n-3+22 : 5n-3+22 : 6n-3).
In the polar lipid fractions of femoral marrow, 22 : 6n-3 and total n-3 fatty acids were found highest in the DR group and in the groups supplemented with DHA (DHA and DHA/DPA groups) (Table 3). There was no significant difference in 22 : 6n-3 concentrations between the DHA group and the DHA/DPA group. The amount of 22 : 5n-3 was increased in the DR group with the supplementation of ALA. Moreover, 20 : 5n-3 was detected only in the DR group (0·05 % of total fatty acids), which was supplemented with ALA that served as the precursor for its synthesis. The amount of 18 : 2n-6 was higher in the DR group; while 20 : 4n-6 was not different among the treatment groups. Supplementing the diets with LA and DPAn-6 significantly led to an increased amount of 22 : 4n-6 and 22 : 5n-6 content, with a stronger effect of LA on the increase of 22 : 4n-6. Similar to the neutral lipids fraction, 18 : 1n-9, 20 : 1n-9 and total MUFA were significantly lower in the DR group. No changes in total SFA, total PUFA and n-6 PUFA were detected in marrow polar lipids of the femur.
Table 3 Fatty acid composition (weight percentage) of rat femur marrow polar lipids
(Mean values and pooled standard deviations for n 5 per group)

TR, trace amount; ND, not detected.
a,b,c Mean values within a row with unlike superscript letters were significantly different (P < 0·05; one-way ANOVA and Student–Newman–Keuls test).
* Dietary treatments after weaning (American Institute of Nutrition (AIN)-93G formulation with 10 % of total diet as lipids): DR, dam reared (3·1 % α-linolenic acid of total lipids); LA, diet supplemented with 15 % (of the total lipids) linoleic acid; DHA, LA diet with the addition of 1 % (of the total lipids) DHA; DPA, LA diet with the addition of 1 % (of the total lipids) docosapentaenoic acid; DHA/DPA, LA diet with the addition of 0·5 % (of the total lipids) docosapentaenoic acid and 1 % (of the total lipids) DHA. Diets are only different in lipid composition across treatment groups.
† Long-chain n-6:n-3 = (20 : 4n-6+22 : 4n-6+22 : 5n-6)/(20 : 5n-3+22 : 5n-3+22 : 6n-3).
In the neutral lipid fractions of femoral periosteum, 22 : 6n-3 was highest in rats fed diets containing n-3 fatty acids (DR, DHA and DHA/DPA groups), while this fatty acid was not detected in the LA and DPA groups (Table 4). There was no significant difference in 22 : 6n-3 concentrations between the DHA group and the DHA/DPA group. For total n-3 fatty acids, the DR group had the highest concentration (1·33 %), followed by the DHA group (0·39 %), and then the DHA/DPA group (0·25 %). The amounts of 14 : 0, 18 : 0, 18 : 2n-6, 18 : 3n-3, total SFA, total PUFA and total n-6 PUFA were highest in the DR group compared with all the other treatment groups, while 18 : 1n-9 and total MUFA were lowest in the DR group. The amount of 22 : 5n-6 was highest in the DPA group, followed by LA, then the DHA/DPA and DHA groups. Only a trace amount of 22 : 5n-6 was detected in the DR group. We did not detect 20 : 5n-3 in any group; while 22 : 5n-3 was found only in the DR group (0·02 %). There were no significant differences for 20 : 4n-6 and 22 : 4n-6 among the treatment groups for neutral lipids in the femoral periosteum.
Table 4 Fatty acid composition (weight percentage) of rat femur periosteum neutral lipids
(Mean values and pooled standard deviations for n 5 per group)

TR, trace; ND, not detected; NA, not available.
a,b,c,d Mean values within a row with unlike superscript letters were significantly different (P < 0·05; one-way ANOVA and Student–Newman–Keuls test).
* Dietary treatments after weaning (American Institute of Nutrition (AIN)-93G formulation with 10 % of total diet as lipids): DR, dam reared (3·1 % α-linolenic acid of total lipids); LA, diet supplemented with 15 % (of the total lipids) linoleic acid; DHA, LA diet with the addition of 1 % (of the total lipids) DHA; DPA, LA diet with the addition of 1 % (of the total lipids) docosapentaenoic acid; DHA/DPA, LA diet with the addition of 0·5 % (of the total lipids) docosapentaenoic acid and 1 % (of the total lipids) DHA. Diets are only different in lipid composition across treatment groups.
† Long-chain n-6:n-3 = (20 : 4n-6+22 : 4n-6+22 : 5n-6)/(20 : 5n-3+22 : 5n-3+22 : 6n-3).
In the polar lipid fractions of femoral periosteum, 22 : 6n-3 was higher in rats supplemented with n-3 fatty acids (DR, DHA and DHA/DPA groups), while total n-3 fatty acids were highest in the DR group (12·30 %), followed by the DHA group (10·54 %) and the DHA/DPA group (9·42 %) (Table 5). There was no significant difference in 22 : 6n-3 concentrations between the DHA group and the DHA/DPA group. The addition of DHA in the diet of rats dramatically increased the periosteum polar lipid content of DHA by 9·1-fold compared with those without dietary supplement of this long-chain n-3 PUFA (average DHA level of 9·83 % in the DHA and DHA/DPA groups compared with average DHA level of 1·08 % in the LA and DPA groups; Table 5). Dietary supplementation with 18 : 3n-3 at 3·1 % of total lipid content enriched the femoral periosteum with DHA to a similar extent compared with the DHA-fed groups (DHA and DHA/DPA, at 1 % of total dietary lipids). The amounts of 18 : 2n-6, 18 : 3n-3 and total PUFA were highest in the DR group, and 20 : 5n-3 was only detected in the DR group. In polar lipids of the periosteum, 22 : 5n-3 was found in all treatments with the DR group having the highest value (1·41 %) followed by the DHA group (0·21 %). The amount of 22 : 5n-6 in the periosteum was higher in the LA and DPA groups compared with the n-3-supplemented ones (at about a 4:1 ratio), and the addition of DPAn-6 to the diet further increased its content in periosteum compared with those rats given only the LA diet. The 22 : 6n-3 content of the polar lipids of femur bone marrow was greatly increased by the dietary n-3 treatments (about 7-fold) compared with the periosteum polar lipids; however, the absolute magnitude of this change was much less in the marrow (from 0·32 to 2·3 %) than in the periosteum (from 1·1 to 10 %) of rats. A similar pattern was observed in the changes of total n-3 fatty acids of bone since the majority of it was from 22 : 6n-3 in the polar lipid fraction. The amount of 20 : 4n-6 was higher for the LA treatment compared with all other groups. Not surprisingly, 22 : 4n-6 was found to be higher in the polar lipids of femoral periosteum for the LA and DPA groups of rats compared with the other three treatments. Total n-6 PUFA was higher in the LA and DPA groups, followed by the DR, and then the DHA, and DHA/DPA groups. The amounts of total MUFA and 18 : 1n-9 were lowest in the DR group.
Table 5 Fatty acid composition (weight percentage) of rat femur periosteum polar lipids
(Mean values and pooled standard deviations for n 5 per group)

TR, trace amount; ND, not detected.
a,b,c Mean values within a row with unlike superscript letters were significantly different (P < 0·05; one-way ANOVA and Student–Newman–Keuls test).
* Dietary treatments after weaning (American Institute of Nutrition (AIN)-93G formulation with 10 % of total diet as lipids): DR, dam reared (3·1 % α-linolenic acid of total lipids); LA, diet supplemented with 15 % (of the total lipids) linoleic acid; DHA, LA diet with the addition of 1 % (of the total lipids) DHA; DPA, LA diet with the addition of 1 % (of the total lipids) docosapentaenoic acid; DHA/DPA, LA diet with the addition of 0·5 % (of the total lipids) docosapentaenoic acid and 1 % (of the total lipids) DHA. Diets are only different in lipid composition across treatment groups.
† Long-chain n-6:n-3 = (20 : 4n-6+22 : 4n-6+22 : 5n-6)/(20 : 5n-3+22 : 5n-3+22 : 6n-3).
Data for tibial marrow and periosteal tissue fatty acid compositions are presented in Supplemental text and Supplemental Tables 1–4, available online. The fatty acid compositions of neutral and polar lipids in tibial marrow and periosteal tissues were generally comparable with those of their femoral counterparts.
Dual-energy X-ray absorptiometry measurements
Excised rat femur bones were examined by DXA at three locations: distal, proximal and diaphysis (mid-shaft) as shown in Fig. 1(b). BMC of the two ends of the bone were found to be higher in the DR and DHA/DPA groups compared with that in the DPA group. The DPA group had the lowest values for BMC at the proximal end of the femur (Table 6).
Table 6 Dual-energy X-ray absorptiometry treatment means for excised rat femur
(Mean values and pooled standard deviations)

BMD, bone mineral density; BMC, bone mineral content.
a,b,c Mean values within a row with unlike superscript letters were significantly different (P < 0·05; one-way ANOVA and Student–Newman–Keuls test).
* Dietary treatments after weaning (American Institute of Nutrition (AIN)-93G formulation with 10 % of total diet as lipids): DR, dam reared (3·1 % α-linolenic acid of total lipids); LA, diet supplemented with 15 % (of the total lipids) linoleic acid; DHA, LA diet with the addition of 1 % (of the total lipids) DHA; DPA, LA diet with the addition of 1 % (of the total lipids) docosapentaenoic acid; DHA/DPA, LA diet with the addition of 0·5 % (of the total lipids) docosapentaenoic acid and 1 % (of the total lipids) DHA. Diets are only different in lipid composition across treatment groups.
Excised rat tibia bones were similarly examined by DXA at three locations: distal, proximal, and diaphysis (mid-shaft). No significant differences were found among the treatment groups in BMD and BMC (Table 7). Excised rat L4 vertebrae were also examined by DXA. No significant differences were found among the treatment groups in BMD and BMC in this bone (Table 8).
Table 7 Dual-energy X-ray absorptiometry treatment means for excised rat tibia
(Mean values and pooled standard deviations)

BMD, bone mineral density; BMC, bone mineral content.
* Dietary treatments after weaning (American Institute of Nutrition (AIN)-93G formulation with 10 % of total diet as lipids) were indicated as: DR, dam reared (3·1 % α-linolenic acid of total lipids); LA, diet supplemented with 15 % (of the total lipids) linoleic acid; DHA, LA diet with the addition of 1 % (of the total lipids) DHA; DPA, LA diet with the addition of 1 % (of the total lipids) docosapentaenoic acid; DHA/DPA, LA diet with the addition of 0·5 % (of the total lipids) docosapentaenoic acid and 1 % (of the total lipids) DHA. Diets are only different in lipid composition across treatment groups.
† For all measurements, n 8 for DR and n 6 for DPA groups. In LA and DHA/DPA groups, n 6 for distal tibia; in DHA group, n 6 for proximal tibia. In LA and DHA groups for measurements in diaphysis, in LA group for proximal tibia, and in DHA group for distal tibia, n 7. In DHA/DPA group for proximal and diaphysis measurements, n 8. Values were subjected to a one-way ANOVA and Student–Newman–Keuls test at a probability of 0·05.
Table 8 Dual-energy X-ray absorptiometry treatment means for excised rat L4 vertebrae
(Mean values and pooled standard deviations)

BMD, bone mineral density; BMC, bone mineral content.
a,b Mean values within a row with unlike superscript letters were significantly different (P < 0·05; one-way ANOVA and Student–Newman–Keuls test).
* Dietary treatments after weaning (American Institute of Nutrition (AIN)-93G formulation with 10 % of total diet as lipids) were indicated as: DR, dam reared (3·1 % α-linolenic acid of total lipids); LA, diet supplemented with 15 % (of the total lipids) linoleic acid; DHA, LA diet with the addition of 1 % (of the total lipids) DHA; DPA, LA diet with the addition of 1 % (of the total lipids) docosapentaenoic acid; DHA/DPA, LA diet with the addition of 0·5 % (of the total lipids) docosapentaenoic acid and 1 % (of the total lipids) DHA. Diets are only different in lipid composition across treatment groups.
Correlations between selected fatty acids and bone mineral content and bone mineral density
Proximal femoral BMC data and the corresponding tissue fatty acid data were analysed by Pearson correlation. The results indicate that femur BMC was significantly correlated with 22 : 6n-3 in the polar lipids of femoral marrow and with both neutral and polar lipids of femoral periosteum of rats (Table 9). Femur BMC was also significantly correlated with total n-3 PUFA from both neutral and polar lipids of marrow and periosteum. On the contrary, femur BMC was negatively correlated with 22 : 5n-6 in all the lipid fractions analysed for femur (Table 9). However, no correlation was found between femur BMC and 20 : 4n-6 in lipids analysed from the marrow and periosteum. In proximal tibia, no correlation was found between the BMC and the amount of 22 : 6n-3 or total n-3 PUFA in the lipid fractions examined; however, tibial BMD was found to correlate with 22 : 6n-3 in the periosteum neutral lipids (R 0·47; P = 0·02) and polar lipids (R 0·43; P = 0·02). Total n-3 PUFA was found to be significantly correlated with BMC (R 0·41; P = 0·04) in tibia. Neither BMD nor BMC of tibia was correlated with the 20 : 4n-6 content of the analysed lipid fractions. However, when considering the ratio of n-6:n-3 PUFA from different femoral bone compartments, an inverse correlation was found between femur BMC and the ratio of n-6:n-3 PUFA of marrow neutral lipids (R − 0·46; P = 0·02) and periosteum polar lipids (R − 0·46; P = 0·02) (Table 9). A similar relationship was obtained when correlating the ratio of long-chain n-6:n-3 to BMC in the femur.
Table 9 Pearson correlations between femur bone bone mineral content (BMC) (proximal region) and selected fatty acids of rats*

LC, long-chain.
* Data from BMC and fatty acid composition measurements were analysed by the Pearson correlation method.
Discussion
In agreement with our published investigations in rat nutritional studies on dietary essential fatty acids, fatty acid analysis of bone tissue compartments reflected the dietary fatty acid composition of the treatments in the present study. The higher level of DHA found in femoral periosteum relative to bone marrow in these rats was also observed in our previous studies in male growing rats(Reference Watkins, Li and Allen1, Reference Watkins, Li and Lippman21) and n-3-deficient rats(Reference Li, Greiner and Salem22). The periosteum is an important tissue for these analyses since it contains active osteoblasts involved in bone formation and an abundant nerve supply. We previously reported that long bone, such as femur, is sensitive to changes in dietary n-3 PUFA and that DHA is more effective than ALA in restoring DHA levels in rat femur and tibia bone tissues(Reference Li, Greiner and Salem22). This is consistent with the present study, where DHA enriched the bone tissue compartments; however, the response with ALA was about equal to that of DHA in rat pups reared on the diets described herein. The explanation for the similar response with ALA and DHA supplementation on lipids in the femur tissue compartments is that the dietary level of ALA was about 3·1 % of total lipids while the dietary DHA content was about 1 % of total dietary lipids. Hence, in this model, three times as much of ALA is needed to achieve the same bone concentration of DHA compared with feeding DHA.
We did not observe any significant increase in the amount of EPA in marrow and periosteum of long bone in rats fed DHA-containing diets (DHA and DHA/DPA groups) and EPA was only found in small quantities in rats given ALA in the diet. It is known that DHA can be retro-converted to EPA(Reference Gronn, Christensen and Hagve23) in the organs that have been evaluated. The results of the present study indicate that this process is either not efficient in enriching EPA in long bone tissue compartments or that bone tissues (and cells) do not retro-convert DHA to EPA. Another explanation for this observation is that DHA could be more important than EPA for bone tissues when there is a limited supply of n-3 PUFA for cell functions. It seems that in bone tissue compartments, accumulation of DHA was preferred over that for EPA, especially in the periosteum(Reference Li, Greiner and Salem22). Therefore, DHA may be more important in supporting long bone cellular and tissue functions for normal development and growth. The periosteum of long bones may require a higher amount of DHA to support the function of its extensive nerve network(Reference Mach, Rogers and Sabino24) and to facilitate osteoblastogenesis and bone formation during the modelling process in the young(Reference Watkins, Li and Lippman2).
In the lipid analysis of the bone compartments, we determined that the fatty acid composition of both neutral and polar lipid fractions was important because of the unique functions of both lipid classes in cells and tissues. Neutral lipids are generally an energy source, while the polar lipids serve in structural and biological capacities. The polar lipids are a source of prostanoid precursors for osteoblasts and osteoclasts, endocannabinoids involved in cell signalling, and a reservoir of biologically active AA, EPA and DHA. In light of the functions of neutral and polar lipids and our previous work on fatty acids in bone compartments(Reference Watkins, Li and Allen1, Reference Watkins, Li and Seifert14, Reference Reinwald, Li and Moriguchi15) and osteoblasts(Reference Watkins, Lippman and Le Bouteiller25) a thorough analysis of femur and tibia was necessary in our investigation on long-chain PUFA.
A significant finding in the present research was the strong correlation between BMC and n-3 PUFA in femur of these growing rats. Together with our previous findings, where a significant positive response was found between BMC and n-3 PUFA in femur bones of ovariectomised rats(Reference Watkins, Li and Seifert14), a compelling case can be made that n-3 essential fatty acids are vital for bone modelling in the young and their resultant increase in BMC and BMD act to deter declines in bone mass associated with oestrogen deficiency and ageing(Reference Watkins, Li and Seifert14). To further support this, our laboratory reported that dietary n-3 fatty acid repletion in n-3-deficient rats significantly lowered the ratio of n-6:n-3 PUFA in bone compartments and reversed compromised bone modelling in n-3-deficient rats(Reference Reinwald, Li and Moriguchi15). In addition, we also observed a significant improvement in bone mechanical properties (energy to peak load, load at failure, peak load, bending moment, and ultimate stress) associated with bone quality, which would suggest greater protection against fracture when n-3 PUFA were provided in the diet(Reference Reinwald, Li and Moriguchi15). Moreover, consistent with the present investigation are findings for the beneficial effect of n-3 PUFA on bone health in human subjects. For example, Rousseau et al. (Reference Rousseau, Kleppinger and Kenny26) observed that in older adults aged 60 years and older (118 men and 129 women, with a mean intake of n-3 PUFA of 1·27 g/d), higher self-reported n-3 PUFA intakes were positively related to femoral neck BMD. In a 6-year follow-up study of a cohort of seventy-eight healthy young men (mean age 16·7 years at baseline) to evaluate factors that determine BMD, measurements of BMD (measured at baseline and at age 22 years) of total body, hip and spine, and fatty acid concentrations (measured in the phospholipid fraction in serum at age 22 years) showed that n-3 PUFA, especially DHA, were positively associated with BMD, and represented the peak BMD, in young men during this longitudinal study(Reference Hogstrom, Nordstrom and Nordstrom27).
It is well known that the eicosanoids (chiefly the E series of prostaglandins synthesised from AA and EPA) mediate physiological actions on bone metabolism. Dietary enrichment of rat bones with n-3 PUFA generally decreases their capacity to produce PGE2ex vivo (Reference Watkins, Li and Allen1, Reference Li and Watkins28). However, this theory as to how n-3 PUFA affects bone metabolism may not be the only mechanism that exists between these fatty acids and bone. DHA is clearly not an eicosanoid precursor, but it has been connected with most of the beneficial effects of n-3 PUFA on bone health and health in general. It is also likely that n-3 PUFA support osteoblast activity and influence gene expression conducive for bone formation(Reference Watkins, Li and Lippman2).
A previous study showed that n-3 deficiency resulted in higher concentrations of 22 : 4n-6 and 22 : 5n-6 in rat cortical bone and marrow(Reference Li, Greiner and Salem22). One reason for this observation may be that when dietary n-3 PUFA is not adequate, long-chain n-6 PUFA are formed to compensate for some of the functions of DHA in bone tissue compartments. Previously, Watkins et al. (Reference Watkins, Li and Allen1) also showed that when rats were fed higher levels of n-6 PUFA (a dietary ratio of n-6:n-3 PUFA of 24), the concentration of 22 : 5n-6 was greatly increased in polar lipids of bone compartments compared with rats given diets with a lower ratio of n-6:n-3 PUFA ranging from 1 to 10. In the present study, substituting DHA with DPAn-6 in the diet compromised bone mineral status compared with the DR rats. In a different study, DPAn-6 provision to rats in place of DHA resulted in a loss in spatial task performance(Reference Lim, Hoshiba and Salem16). Our finding of reduced bone mineral status of rats is a confirmation that a long-chain PUFA of the n-6 family (DPAn-6) will not substitute for DHA in developmental processes associated with early growth in young rats.
Correlation analysis in the present study clearly showed that a trend of greater BMC accompanied higher amounts of diet-derived n-3 fatty acids, namely DHA (22 : 6n-3) and total n-3 PUFA, in the femoral compartments. Why the same relationship was not seen in tibia is not clear, though this may suggest that femur is more sensitive to n-3 PUFA status for bone modelling than tibia. For example, in human subjects, BMD of the femoral head was positively associated with n-3 dietary intake(Reference Weiss, Barrett-Connor and von Muhlen6), supporting our present findings in growing rats. Also, it seems that bone tissue 22 : 6n-3 concentration was not much affected by the presence of 22 : 5n-6 when 22 : 6n-3 is supplied at the level fed to rats in the present study (1 % of total lipids). A recent publication reported similar findings in various tissues of rats (plasma, erythrocyte, brain, liver, adipose, kidney, muscle and testes) for fatty acid analysis from these same animals(Reference Stark, Lim and Salem29). However, when there was a lack of dietary 22 : 6n-3, 22 : 5n-6 (DPAn-6) was greatly increased in tissue lipids, especially in the polar fraction. The increased 22 : 5n-6 could either come directly from the diet or be converted from dietary 18 : 2n-6. Stark et al. (Reference Stark, Lim and Salem30) speculated that dietary 22 : 5n-6 competes with 22 : 6n-3 for incorporation into muscle lipids. From our findings in the bone, it appears that 22 : 5n-6 is more likely to fill the void left by the lack of 22 : 6n-3 supply, rather than directly competing with 22 : 6n-3. Further research is needed to determine the extent to which n-3 PUFA influence metabolic activity of individual bones (long, flat and sesamoid) and specific skeletal sites for mineral accretion.
In conclusion, dietary substitution of DPAn-6 for preformed DHA does not functionally maintain normal bone mineral status and the findings of the present study support the role of n-3 PUFA, particularly DHA, in sustaining bone health. Hence, we accept our hypothesis that DPAn-6 does not substitute for DHA in bone modelling during growth. Future investigations should carefully evaluate how dietary n-3 PUFA have an impact on other bones of the skeletal system and specific skeletal sites, as well as their effects on progenitor cells and functions of osteoblasts and osteoclasts.
Acknowledgements
The present study was supported by the Intramural Research Program of the National Institutes of Health, National Institute on Alcohol Abuse and Alcoholism.
All authors contributed collectively to the final manuscript. B. A. W. and N. S. Jr. were principal investigators; Y. L. and S.-Y. L. performed laboratory analyses and were responsible for data collection; Y. L. and B. A. W. compiled drafts of the manuscript; M. F. S. provided assistance with the bone measurements and interpretation.
None of the authors has any financial or personal conflict of interest to disclose.
Supplemental text and tables on tibia and periosteal fatty acid values are available online only at http://journals.cambridge.org/action/displayJournal?jid=bjn


