


The metabolic syndrome (MetS) is characterised by a cluster of metabolic abnormalities including abdominal obesity, hyperglycaemia, hypertension and dyslipidaemia(Reference Bonora, Kiechl and Willeit1). Also, some diets and nutrients have been shown to play a protective role against the development of the MetS(Reference Sahyoun, Jacques and Zhang2,Reference Kim, Kim and Lee3) .
Flavonoids are the most common group of polyphenolics in the human diet. They are relatively abundant in fruits, vegetables, grains, herbs and beverages. According to their chemical structure, flavonoids are classified into several groups including flavonols, flavones, flavan-3-ols, flavanones, anthocyanidins and isoflavonoids(Reference Erdman, Balentine and Arab4). They have a wide range of biochemical and pharmacological effects, such as anti-inflammatory, antioxidant and anti-proliferative actions(Reference Kandaswami and Middleton5,Reference Chen, Li and Saleri6) .
Underlying these effects, associations of dietary intake of total flavonoids and its subclasses with the MetS have been reported in cross-sectional studies with inconsistent results(Reference Grosso, Stepaniak and Micek7–Reference Oh, Kim and Vijayakumar13). The flavonoids in these studies were different, and different flavonoids compounds may have different effects on human health because of the differences in their chemical structure, bioavailability, distribution and metabolism(Reference Rice-Evans, Miller and Paganga14). Also, there has been no study to report whether flavonoids from different food sources have different roles on the MetS. Also, the associations of flavonoids with the MetS or its components have still not been reported in prospective cohort study, making hierarchy of evidence regarding this issue incomplete.
Further, previous observation studies frequently examined the associations between flavonoids and the MetS or its components with ignoring nutritional interactions between flavonoids and other nutrients, such as Mg. In vitro studies have reported that flavonoids were able to react with the Mg cation, and the free radical scavenging activity of flavonoids was increased after complexing with the Mg cation(Reference Ghosh, Chakraborty and Mallick15). However, it is still largely unknown whether dietary Mg could influence the associations between flavonoids or its subclasses and future risk of the MetS.
Therefore, the purpose of the present study was to clarify the prospective association of flavonoids from different food sources or the specific flavonoids with the MetS and its components, and to explore the interaction between flavonoids and dietary Mg in the associations with the MetS in a cohort of adult residents in China.
Subjects and methods
Population selection
The subjects were from the Harbin Cohort Study on Diet, Nutrition and Chronic Non-communicable Diseases(Reference Na, Wu and Feng16). The Harbin Cohort Study on Diet, Nutrition and Chronic Non-communicable Diseases covered seven urban administrate regions of Harbin. Each region was divided into three strata according to their financial situation, and a total of forty-two communities were randomly selected from each stratum in each administrate region by performing a stratified multistage random cluster sampling design. Residents who had lived in their communities for more than 2 years and without cancer or type 1 diabetes were recruited in the cohort. A total of 9734 subjects aged between 20 and 74 years completed the in-person baseline survey in 2010. From 2015 to 2016, a total of 8913 subjects completed the first in-person follow-up survey with a response rate of 91·6 %. We excluded subjects at the baseline who had the MetS (n 1989), who reported extreme values for the total energy intake (<2092 kJ/d or >18 828 kJ/d, n 368), who had undergone dietary intervention for diabetes or other diseases (n 123) and who had more than ten items unfilled in the questionnaire (n 16). Finally, a total of 6417 subjects were eligible for analysis, with an average follow-up of 5·3 years (Fig. 1). The study protocol of Harbin Cohort Study on Diet, Nutrition and Chronic Non-communicable Diseases was approved by the Ethics Committee of Harbin Medical University, and written informed consent was provided by all participants. The methods in the present study were in accordance with the approved guidelines. The trial is registered as ChiCTR-ECH-12002721 at http://www.chictr.org.cn/showproj.aspx?proj=6833.
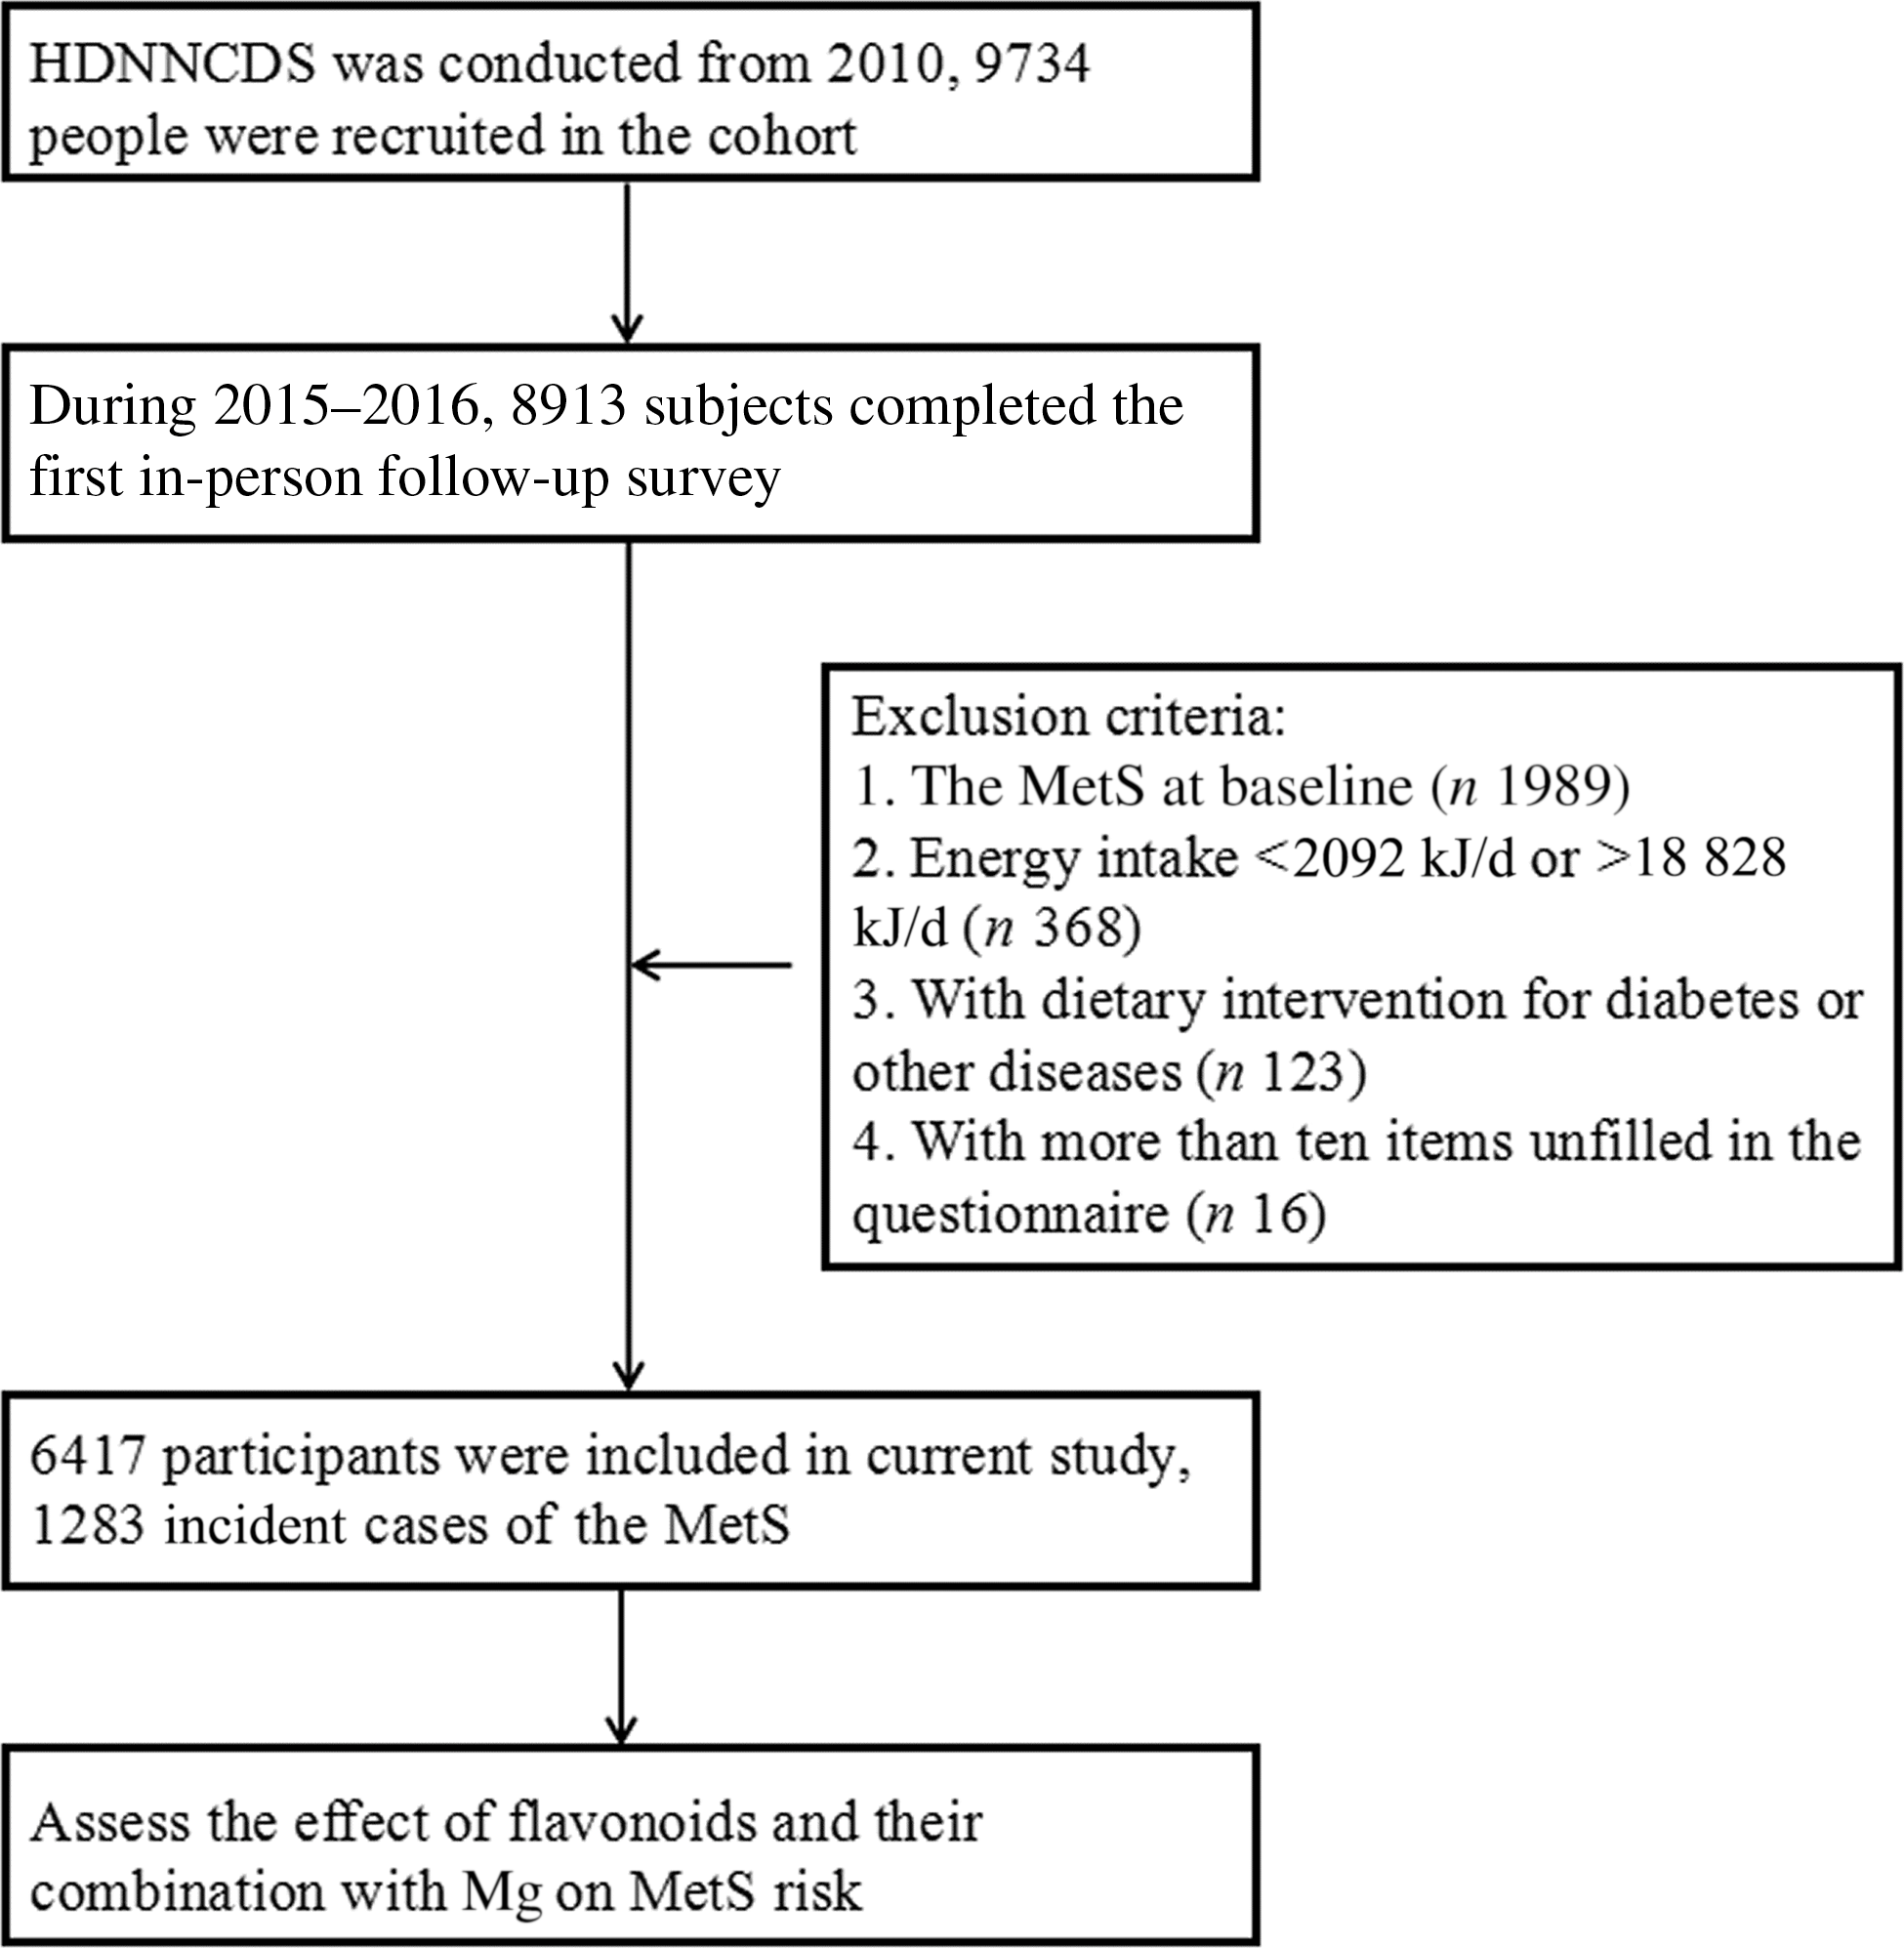
Fig. 1. Flow chart of the present study. HDNNCDS, Harbin Cohort Study on Diet, Nutrition and Chronic Non-communicable Diseases; MetS, metabolic syndrome.
Data collection by the questionnaire
Detailed in-person interviews were administered by trained personnel using a structured questionnaire to collect information on demographic characteristics, dietary intake, lifestyle and physical condition at both baseline and follow-up surveys. The section on dietary intake was evaluated by the validated FFQ(Reference Na, Wu and Feng16). A total of 103 food items were included in the questionnaire, which covered most of the commonly consumed foods in urban Harbin. For each food item, the participants were asked how frequently they consumed it over the preceding year, followed by a question on the amount consumed in liang (a unit of weight equal to 50 g) or ml (for liquid food item) per unit of time. The consumption frequency was transformed to obtain the mean consumption per day. Nutrient intake for each food item consumed was calculated by multiplying the nutrients content listed in the Chinese Food Composition Table(Reference He, Zhai and Yang17). The section on lifestyle and physical condition mainly included information about labour intensity, smoking, alcohol consumption, and taking medicines and health products in the past 12 months.
Dietary flavonoid assessment
Flavonoid intake was calculated based on the flavonoid database set up in our laboratory. In the flavonoids database, the reverse phase HPLC method was used to determine flavonoids levels among the food items commonly consumed in Harbin city, China. A total of forty-one food items in the questionnaire, including three potatoes and their products, seven legumes and their products, nineteen fresh vegetables, and fourteen fresh fruits, were included in the analysis of flavonoids content. Five flavonoids including quercetin, kaempferol, isorhamnetin, apigenin and luteolin were detected(Reference Cao, Chen and Zhang18). Analytical performances of the method were compared in terms of linearity, limits of detection and precision. Celery leaf containing various flavonoid aglycones analysed was used as a control sample to determine individual flavonoid recovery. Mean recovery of flavonoid standards added to extraction solution (n 3) amounted to 97·90 % (quercetin), 97·77 % (kaempferol), 93·57 % (isorhamnetin), 93·40 % (luteolin) and 94·97 % (apigenin). The method showed a good reproducibility with CV of 2·50 % (quercetin), 3·74 % (kaempferol), 4·24 % (isorhamnetin), 2·61 % (luteolin) and 2·25 % (apigenin). The detection limits of kaempferol, quercetin, isorhamnetin, apigenin and luteolin were 2·5, 1·5, 3·0, 2·0 and 1·5 mg/kg FW, respectively. Then, the detected flavonoids content of each food item, multiplied by the reported consumption amount as assessed by the FFQ, was considered as the dietary flavonoid intake in the present study.
Anthropometric measurement and biochemical assessment
Anthropometric measurements, including height, weight and waist circumference, were taken by well-trained examiners, with participants wearing light, thin clothing and no shoes. Body weight and height were measured to the nearest 0·1 kg and 0·1 cm, respectively. BMI was calculated as weight (kg) divided by the square of the height in metres (m2). Systolic blood pressure and diastolic blood pressure were measured three times with a standard mercury sphygmomanometer on the right arm of each subject after a 10-min rest in a sitting position, and the mean values were used for analysis. Fasting and postprandial (2 h after drinking 75 g glucose-containing water) blood samples were taken from all participants at the baseline. Fasting plasma glucose and 2-h postprandial plasma glucose, blood lipids including total cholesterol, TAG, LDL-cholesterol and HDL-cholesterol were measured using an automatic biochemistry analyzer (Hitachi).
Study outcome definition
The MetS was diagnosed according to the International Diabetes Federation 2005 guidelines(Reference Alberti, Zimmet and Shaw19) as having central obesity (waist circumference ≥90 cm for men and ≥80 cm for women) plus any two of the following conditions: (1) hypertriacylglycerolaemia: TAG ≥ 1·7 mmol/l or specific treatment for this lipid abnormality; (2) low HDL-cholesterol: HDL < 1·03 mmol/l in males or <1·29 mmol/l in females, or specific treatment for this lipid abnormality; (3) high blood pressure: systolic blood pressure ≥ 130 mmHg or diastolic blood pressure ≥ 85 mmHg, or treatment of previously diagnosed hypertension and (4) hyperglycaemia: fasting plasma glucose ≥ 5·6 mmol/l or previously diagnosed type 2 diabetes.
Statistical analysis
Baseline flavonoid intake was divided into quartile categories based on the total intake. One-way ANOVA and the χ 2 tests were performed using SPSS v21.0 (Beijing Stats Data Co. Ltd) for the comparison of general characteristics and dietary information. Multivariate logistic regression analyses and forest plot were performed using Stata version 14.0 (Stata Corp) to assess the adjusted relative risks (RR) with a 95 % CI of follow-up MetS and its components depending on the baseline flavonoid intake across the quartiles. Potential confounders include age, sex, drinking, smoking, physical activity, BMI, and fat, protein, carbohydrate, fibre and total energy. A joint analysis was used to analyse interactions between total flavonoids, quercetin, luteolin and Mg on the MetS. Restricted cubic spline, a function which is often used to explore adjusted dose–response associations between a continuous exposure and an outcome, was performed using R 2.15.1 (http://www.r-project.org/) to evaluate the shape of the flavonoids–MetS relation and to assess the dose–response relation. A two-sided P ≤ 0·05 was considered statistically significant.
Results
Baseline anthropometric and blood biochemical characteristics
General characteristics of the participants by quartiles of flavonoid intake at the baseline are shown in Table 1. In the lower quartile, the participants had lower age, larger BMI and waist circumference, higher fasting plasma glucose and TAG, and lower HDL, when compared with the individuals in the higher quartile (P < 0·05). There were more male participants, and a larger percentage of smokers and drinkers in the lower quartile. Moreover, participants with higher flavonoid intake were more likely to engage in light physical labour (P < 0·05). And postprandial plasma glucose and total cholesterol were not statistically significant between two groups.
Table 1. Baseline characteristics of the study populations, according to quartile (Q) categories of energy-adjusted total flavonoid intake
(Mean values and standard deviations; frequencies and percentages)
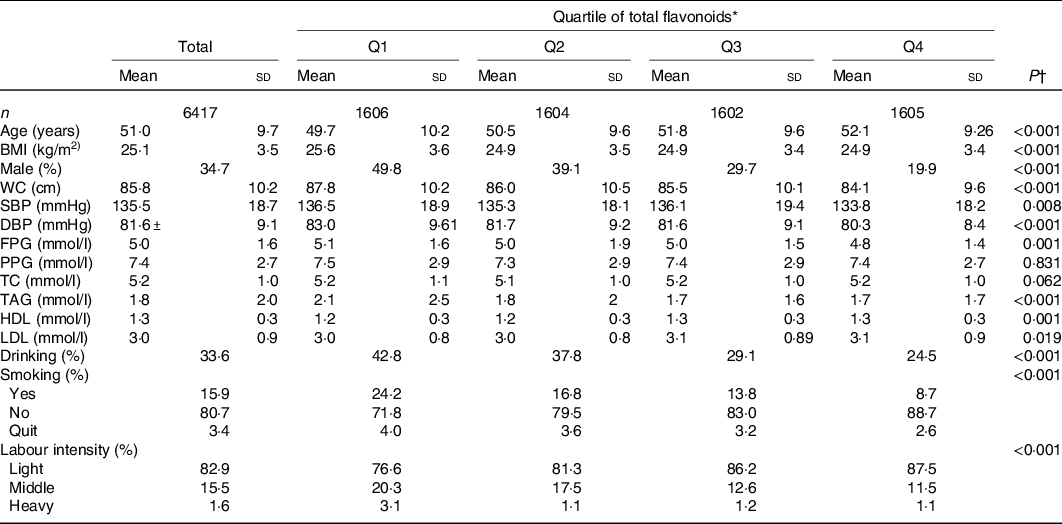
WC, waist circumference; SBP, systolic blood pressure; DBP, diastolic blood pressure; FPG, fasting plasma glucose; PPG, postprandial plasma glucose; TC, total cholesterol.
* The total flavonoid intake in the model was standardised by energy (crude dietary flavonoids per 4184 kJ (1000 kcal) total energy).
† One-way ANOVA was used for continuous variables; χ 2 tests were used for categorical variables. A two-sided P ≤ 0·05 was considered statistically significant.
Dietary nutrient and flavonoid intakes
The dietary nutrient and flavonoid intakes of the participants by quartiles of flavonoids at the baseline are shown in Table 2. The average intake of flavonoids was 34·9 mg/d. The intake of flavonoids in the highest quartile was over three times the quantity of that in the lowest quartile (P < 0·05). In terms of the specific flavonoids, kaempferol and luteolin were the most abundant forms among the flavonoids that were detected. In the present study, most of the dietary flavonoids were from vegetables and fruits. In addition, the dietary intake of energy, carbohydrate, fat, protein, fibre and Mg was significantly different across the quartiles of flavonoids (P < 0·05).
Table 2. Dietary flavonoid and nutrient intakes of the subjects in quartiles (Q) of energy-adjusted total flavonoid intake
(Mean values and standard deviations)
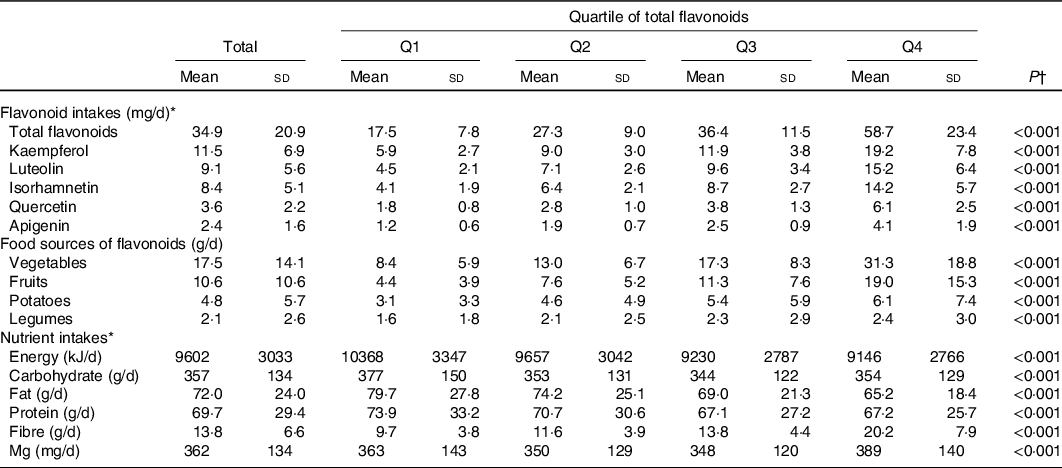
* The flavonoid and nutrient intakes in the model were standardised by energy (crude dietary flavonoid or nutrient intakes per 4184 kJ (1000 kcal) total energy).
† One-way ANOVA was used for continuous variables. A two-sided P ≤ 0·05 was considered statistically significant.
Associations of total and the specific flavonoids with the incidence of the metabolic syndrome and its components
In Fig. 2, participants with a higher intake of total flavonoids tended to have a lower risk of the MetS. The RR for the highest quartile was 0·58 (95 % CI 0·37, 0·93; P = 0·024) after being adjusted for age, sex, drinking, smoking, physical activity, BMI, fat, protein, carbohydrate, fibre and total energy. In terms of the specific flavonoids, the RR of the MetS for the highest quartile was 0·55 (95 % CI 0·34, 0·88; P = 0·012) for quercetin, 0·56 (95 % CI 0·34, 0·93; P = 0·024) for kaempferol, 0·58 (95 % CI 0·35, 0·96; P = 0·035) for isorhamnetin and 0·49 (95 % CI 0·32. 0·76; P = 0·002) for luteolin after being adjusted for potential confounders. Additionally, a higher intake of total flavonoids was inversely associated with the risk of central obesity. When the highest and the lowest quartiles were compared, the RR of central obesity was 0·56 (95 % CI 0·37, 0·93; P = 0·024) for total flavonoids, 0·54 (95 % CI 0·32, 0·89; P = 0·017) for quercetin, 0·45 (95 % CI 0·26, 0·79; P = 0·005) for kaempferol, 0·56 (95 % CI 0·33, 0·97; P = 0·039) for isorhamnetin and 0·55 (95 % CI 0·34, 0·87; P = 0·011) for luteolin after being adjusted for potential confounders. Moreover, luteolin intake was marginally inversely associated with the risk of high blood pressure, with a RR of 0·66 (95 % CI 0·42, 1·02; P = 0·058) for the highest quartile. There was a marginally inverse association of apigenin with the risk of low HDL cholesterol, with a RR of 0·51 (95 % CI 0·25, 1·03; P = 0·060) for the highest quartile. The association of total and the specific flavonoids with the incidence of the MetS and its components adjusted model by model in detail is presented in online Supplementary Table S1. After stratifying by sex, we found that the associations between the highest quartile of total and the specific flavonoids and the incidence of the MetS and central obesity in male and female were consistent (online Supplementary Table S2).
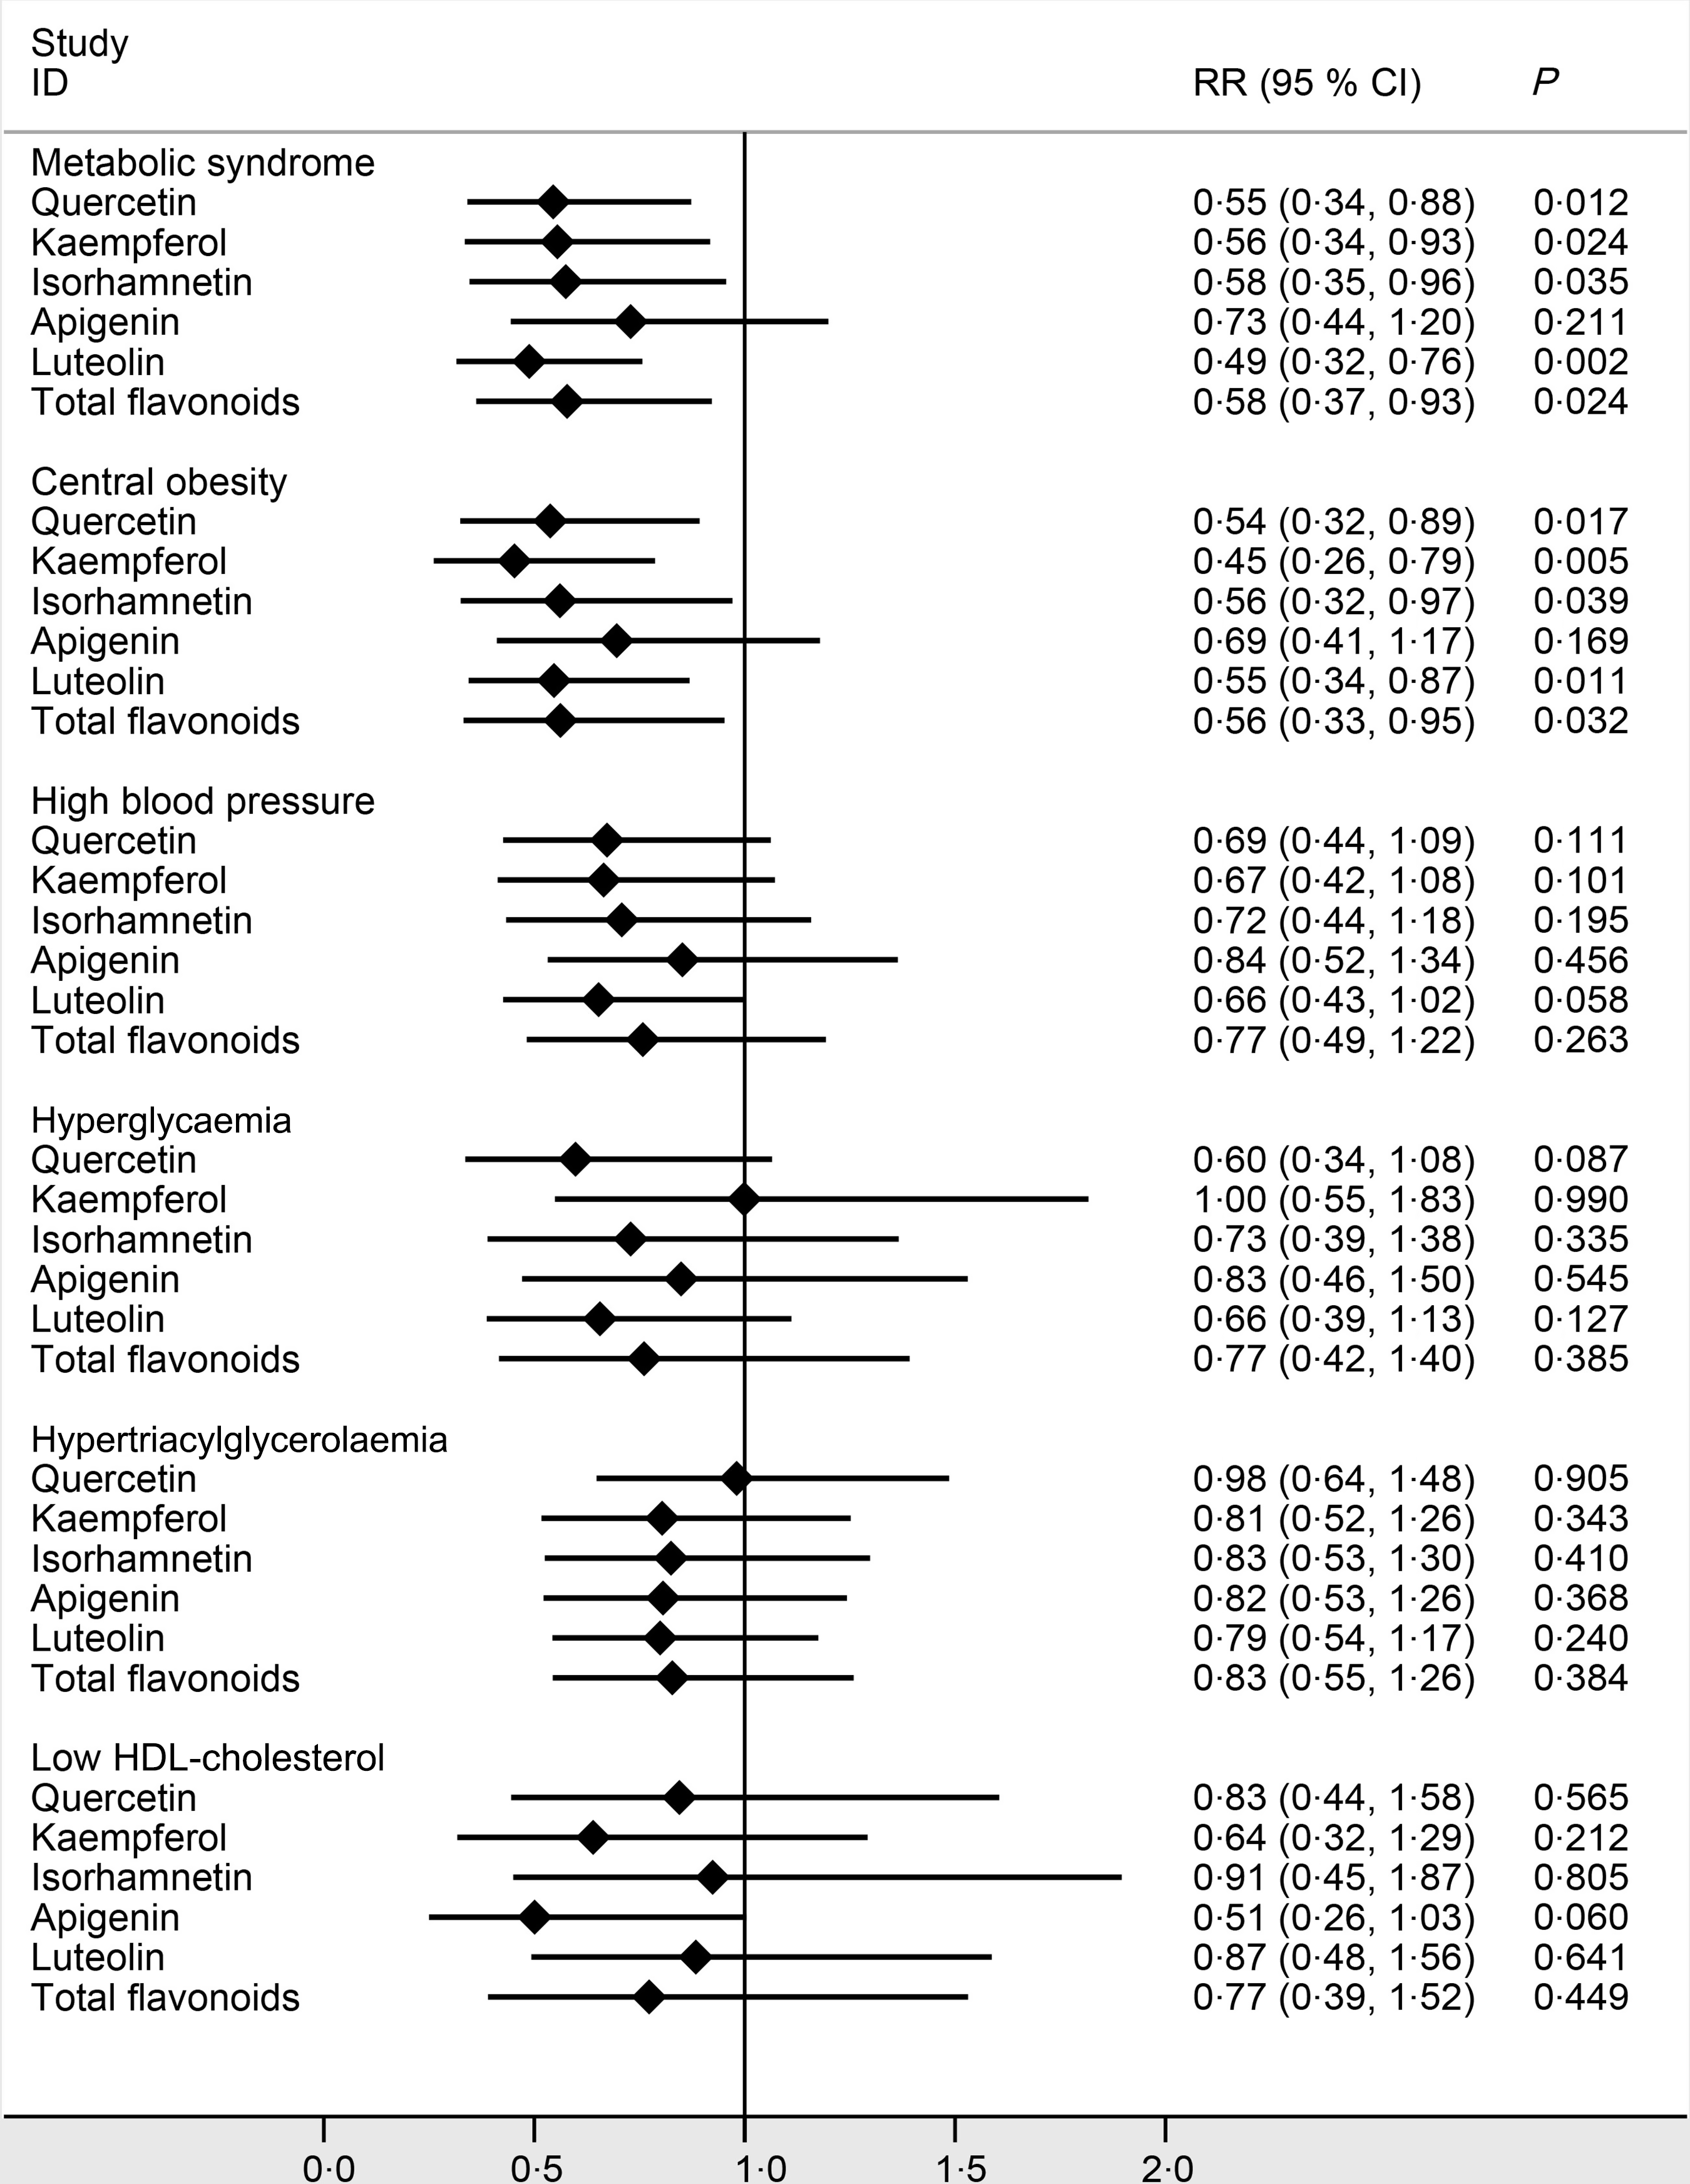
Fig. 2. Adjusted risk ratios (RR) and 95 % CI of the metabolic syndrome that compared the fourth with the first quartile of the total and specific flavonoid intakes. Age, sex, drinking, smoking, physical activity, BMI, fat, protein, carbohydrate, fibre and total energy were adjusted in the model.
Associations of flavonoids from different food sources with the metabolic syndrome and its components
In Fig. 3, among the food sources rich in flavonoids, a higher intake of flavonoids from fresh fruits, potatoes and legumes was significantly associated with decreased risks of the MetS and obesity. The RR of the MetS between the extreme quartiles was 0·58 (95 % CI 0·42, 0·80; P = 0·001) for fruits, 0·72 (95 % CI 0·53, 0·98; P = 0·033) for potatoes and 0·71 (95 % CI 0·53, 0·96; P = 0·027) for legumes, respectively. The RR of central obesity between the extreme quartiles was 0·69 (95 % CI 0·48, 0·98; P = 0·039) for fruits, 0·72 (95 % CI 0·53, 0·99; P = 0·042) for potatoes and 0·62 (95 % CI 0·45, 0·85; P = 0·003) for legumes, respectively, after being adjusted for potential confounders. The association of flavonoids from different sources with the incidence of the MetS and its components adjusted model by model in detail is presented in online Supplementary Table S3. After stratifying by sex, we found that the associations between the highest quartile of flavonoids from different sources and the incidence of the MetS and central obesity in male and female were consistent (online Supplementary Table S4).

Fig. 3. Adjusted risk ratios (RR) and 95 % CI of the metabolic syndrome that compared the fourth with the first quartile of the total intake of five flavonoids from different food sources. Age, sex, drinking, smoking, physical activity, BMI, fat, protein, carbohydrate, fibre and total energy were adjusted in the model.
Joint analyses of flavonoids and magnesium intake on the metabolic syndrome risk
In Fig. 4, Mg intake was divided into high and low levels according to the average energy-adjusted Mg intake. Compared with the lower Mg group, the RR of the MetS for the higher Mg group was 0·81 (95 % CI 0·66, 0·98; P = 0·034) after being adjusted for potential confounders. Joint analyses showed that there were interactions between total flavonoids, quercetin, luteolin and Mg on the MetS; the reverse association of total flavonoids, quercetin and luteolin with the MetS risk was remarkably stronger under the high level of Mg intake (all P for interaction < 0·01). The RR of the MetS under the high-Mg and high-flavonoid pattern were 0·60 (95 % CI 0·45, 0·81) for the total flavonoids, 0·61 (95 % CI 0·45, 0·82) for quercetin and 0·52 (95 % CI 0·38, 0·71) for luteolin, when compared with that under the low-Mg and low-flavonoid pattern (reference, 1), representing a difference in RR of 40, 39 and 48 %, respectively. There were no interactions between the other three flavonoids and Mg on the MetS in Fig. 5.

Fig. 4. Joint analyses of magnesium and the total or specific flavonoid intakes with the risk of the metabolic syndrome (MetS) (P for interaction < 0·01). Data are risk ratios (RR) and 95 % CI of different levels of flavonoid–magnesium intake adjusted for age, sex, drinking, smoking, physical activity and BMI. (a) Tertile category of total flavonoid intake. (b) Tertile category of quercetin intake. (c) Tertile category of luteolin intake. Tertile-specific point estimates were given for low, medium and high flavonoid intakes, in dual categories of low (![]() ), and high (
), and high (![]() ) magnesium intake. The numbers (fractions) associated with each point are the cases and N.
) magnesium intake. The numbers (fractions) associated with each point are the cases and N.
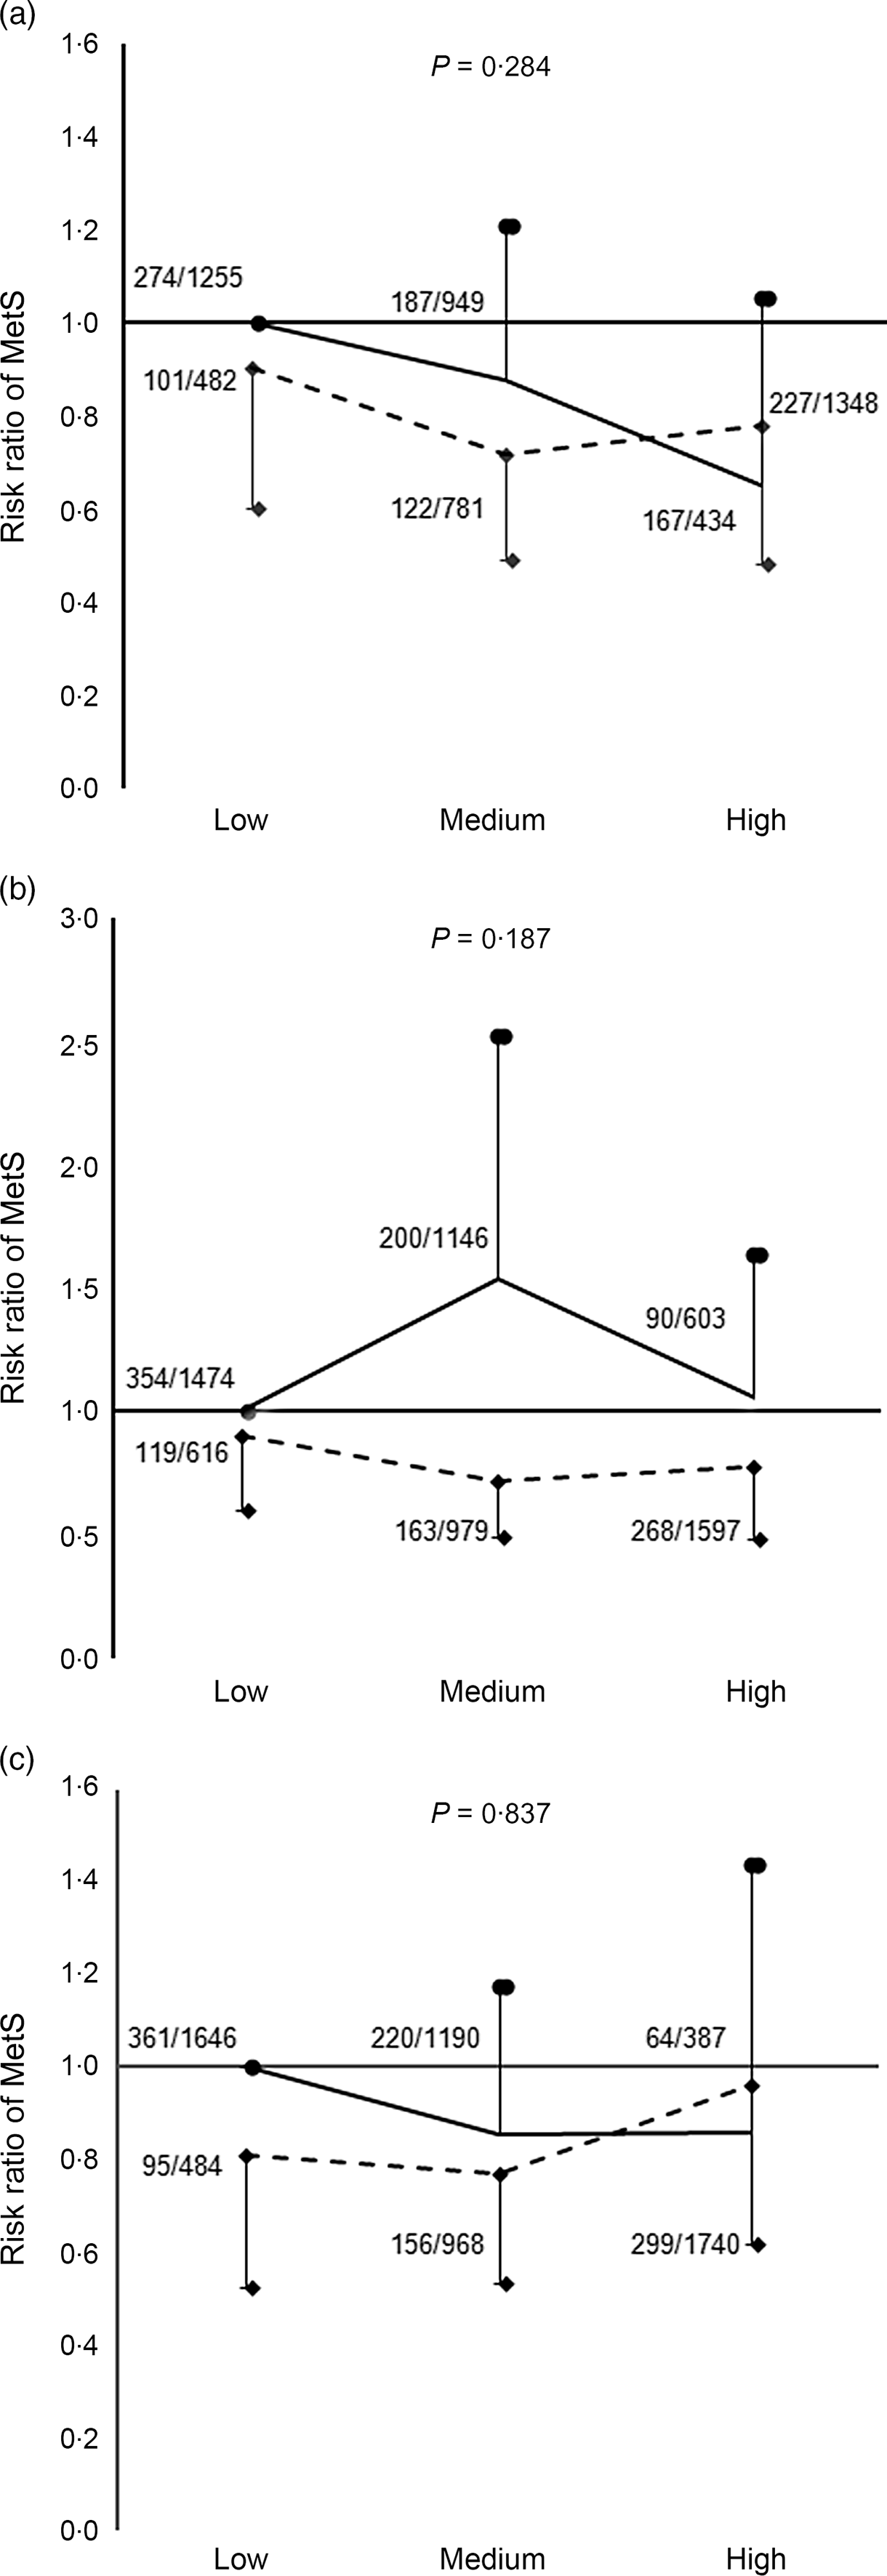
Fig. 5. Joint associations of magnesium and the specific flavonoid intakes with the risk of the metabolic syndrome (MetS) (P for interaction >0·05). Data are risk ratios (RR) and 95 % CI of different levels of flavonoid–magnesium intake adjusted for age, sex, drinking, smoking, physical activity and BMI. (a) Tertile category of kaempferol intake. (b) Tertile category of isorhamnetin intake. (c) Tertile category of apigenin intake. Tertile-specific point estimates were given for low, medium and high flavonoid intakes, in dual categories of low (![]() ), and high (
), and high (![]() ) magnesium intake. The numbers (fractions) associated with each point are the cases and N.
) magnesium intake. The numbers (fractions) associated with each point are the cases and N.
Suggestion of flavonoid intake for the prevention of the metabolic syndrome
In Fig. 6, in dose–response analysis using restricted cubic spline, we took the median intake of total flavonoids (34·9 mg/d) as a reference point, with three knots (5th, 50th and 95th) to approximate the relationship between the intake of total flavonoids and the risk of the MetS. It was an assessment of the functional form of the effect using flexible models. The curve demonstrated that a higher intake of flavonoids was associated with decreased risk of the MetS after been adjusted for the potential confounders. The decline trend of the MetS risk seemed less obvious with the increase of flavonoid intake, but we did not observe a plateau in the curve in our study. Results of restricted cubic spline for other specific flavonoids are presented in Fig. 7.
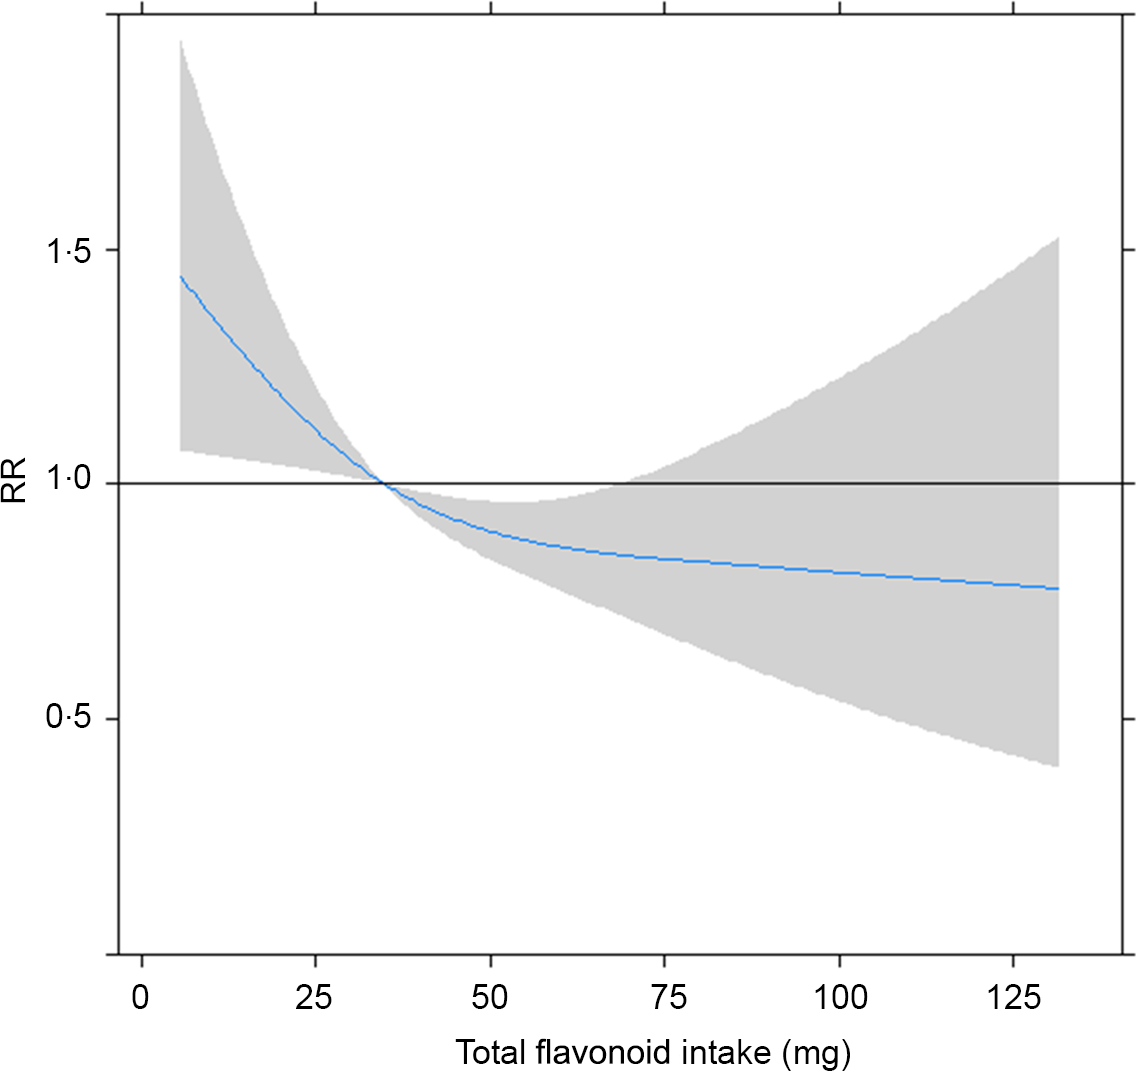
Fig. 6. Approximated non-linear trend between total flavonoids and risk of the metabolic syndrome by using restricted cubic spline. Data are risk ratios (RR) and 95 % CI of flavonoid intakes adjusted for age, sex, drinking, smoking, physical activity and BMI.
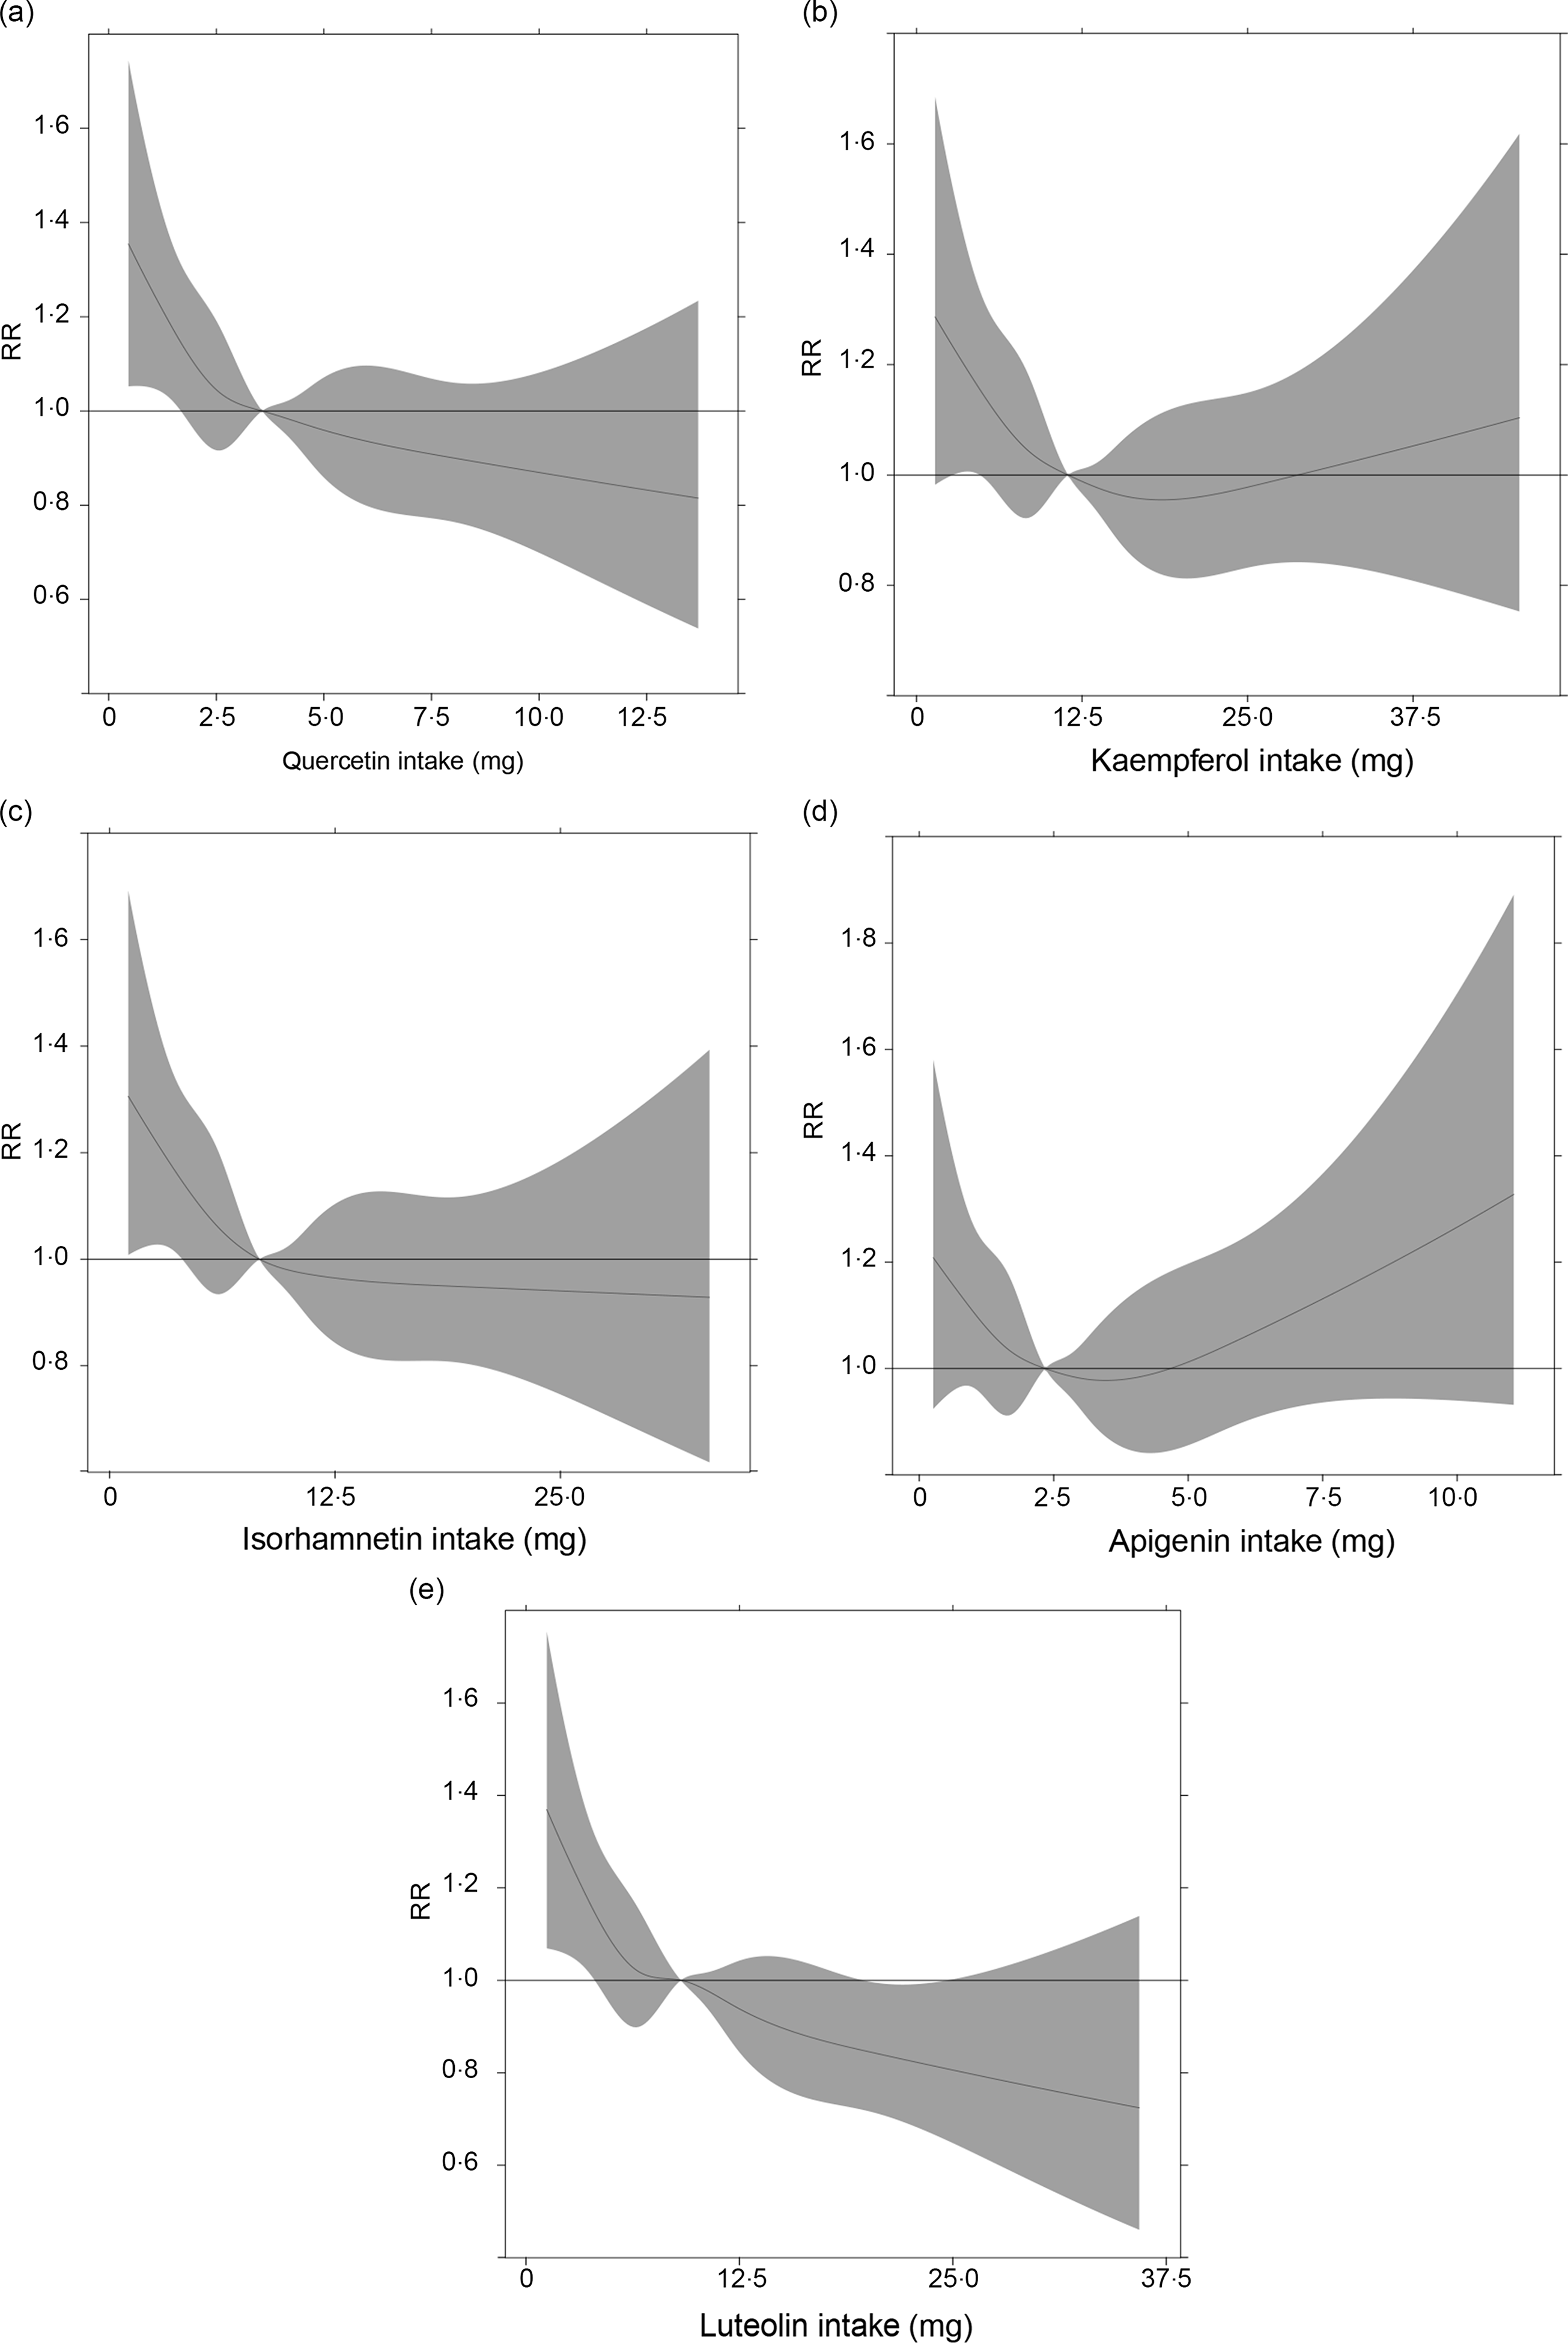
Fig. 7. Approximated non-linear trend between the specific intakes of five flavonoids and the risk of the metabolic syndrome by using restricted cubic spline. Data are risk ratios (RR) and 95 % CI of flavonoid intakes adjusted for age, sex, drinking, smoking, physical activity and BMI. (a) Quercetin; (b) kaempferol; (c) isorhamnetin; (d) apigenin; (e) luteolin.
Discussion
The present study firstly examined the association between dietary flavonoid intake and future risk of the MetS and its components in prospective data. Total flavonoids, quercetin, kaempferol, isorhamnetin and luteolin were inversely associated with future risk of the MetS and central obesity, and this reverse association was only observed in flavonoids from fruits, potatoes and legumes. Further, higher dietary intake of Mg augmented the inverse association of total flavonoids, quercetin and luteolin with the MetS.
In the present study, five flavonoids were included. Among those, quercetin, kaempferol, isorhamnetin and luteolin were associated with the decreased risk of the MetS and central obesity. Quercetin, kaempferol and isorhamnetin belong to flavonol, and they have been reported to ameliorate symptoms of the MetS through multiple mechanisms, including anti-inflammatory effects in obesity, inhibiting the adipogenesis of adipocytes via the suppression of the Wnt/β-catenin signal and directly binding to and inducing the transactivation of liver X receptors(Reference Rivera, Morón and Sánchez20–Reference Lee, Kim and Oh22). Luteolin belongs to flavone, and the mechanism of its effect on the MetS and central obesity was possibly associated with anti-inflammation or cell apoptosis in epididymis adipose tissues(Reference Jennings, Welch and Spector23,Reference Xu, Zhang and Dong24) . We also found that luteolin intake was associated with a decreased risk of high blood pressure, which was in agreement with previous studies. Luteolin has been reported to regulate blood pressure by increasing nitric oxide production and decreasing endothelin production, resulting in the relaxation of vascular smooth muscle(Reference Lv, Zhang and Gao25). Although the associations between flavonoids and other components were not statistically significant, the results were generally supportive of inverse associations (e.g. luteolin and high blood pressure, quercetin and hyperglycaemia, apigenin and low HDL-cholesterol). Based on the above results, most flavonoids in the present study had a significant impact on central obesity, only luteolin was associated with blood pressure and we speculated that flavonoids had a stronger effect on central obesity than high blood pressure.
Flavonoids have a wide range of food sources, and flavonoids from different food source may have different biological functions. For example, a study found that flavonoids from tea had a higher antioxidant capacity than those from fruit and vegetables(Reference Prior and Cao26). To confirm the hypothesis and provide more practicable dietary suggestions, we investigated the effect of flavonoids from different food sources on the MetS and its components. Our results suggested that flavonoids from fruits, potatoes and legumes may have beneficial effects on the MetS and central obesity. Fresh fruits were rich in flavonols and other flavonoids subclasses like anthocyanin and naringin, a flavanone(Reference Toh, Tan and Lim27), while legumes and potatoes contained flavones. Furthermore, legumes were also rich in other subclasses like isoflavone(Reference Kim, Vance and Chun28). The mechanism for protective effects of flavonoids from these food sources may be that they can decrease mRNA expression of enzymes or transcription factors which are involved in lipid metabolism such as hepatic sterol-regulatory element binding protein-1c (SREBP-1c), α-glucosidase or PPAR-α, or inhibit the production of inflammatory mediators, such as TNF-α, to ameliorate the inflammatory changes in obese adipose tissue(Reference Seymour, Lewis and Urcuyo-Llanes29–Reference Kurrat, Blei and Kluxen34). Notably, we did not find any association of flavonoids from vegetables with the MetS or its components. Vegetables are a major source of flavonoids, but no studies have reported the association of flavonoids from vegetables with the MetS or its components. The findings from a large cohort of US women indicated that high intake of flavonoids did not protect against the development of type 2 diabetes(Reference Song, Manson and Buring35). In that study, the flavonoids included quercetin, kaempferol, myricetin, apigenin and luteolin; most of the flavonoids were the same as those in the present study. So one reason for the null result of vegetable flavonoids was possibly due to the specific flavonoid items included in the present study, as the association of these five flavonoids with the MetS was reported inconsistent. In addition, the association of vegetables with the MetS or its components was also inconsistent, as that a population-based prospective cohort study in Japan did not find a negative association of vegetable intake with the MetS or its components(Reference Takachi, Inoue and Ishihara36), indicating an inconsistent results about the effect of vegetables on the MetS or its components. Therefore, the effect of flavonoids from vegetables on the MetS or its components should be further studied.
In addition, it has been found that Mg can interact with flavones in the treatment of progressive malignant myopia(Reference Algan37). We speculated that most of the flavonoids may interact with Mg due to their chemical structure(Reference Ghosh, Chakraborty and Mallick15). In the present study, we observed that the reverse association of total flavonoids, quercetin and luteolin with the MetS became stronger in the context of a high-Mg intake. These data suggested that the interaction among flavonoids and other food components should be considered when assessing the effect or providing dietary suggestion regarding flavonoid intake.
So far, the intake of dietary total flavonoids has been different among the studies. In the present study, the daily mean intake of flavonoids was 34·91 mg/d, while it was 16·2 mg/d in Japan(Reference Kimira, Arai and Shimoi11), 189·7 mg/d in the USA(Reference Chun, Chung and Song38) and 313·26 mg/d in Spain(Reference Zamora-Ros, Andres-Lacueva and Lamuela-Raventós39), respectively. The highly variable average intake of flavonoids among the studies was partly due to the specific flavonoids and different food sources that were included in the studies. In these studies, they did not observe any adverse effect of flavonoids even at doses of more than 300 mg/d. In the present study, the dose–response curve of flavonoids–MetS association demonstrated that a higher intake of flavonoids was associated with a decreased risk of the MetS. Although we did not observe a plateau in the curve, there was a certain weakening after 50 mg/d of flavonoids or so. This dose was close to the average flavonoids (58·7 mg/d) of the fourth quartile. In the regression results, the individuals in the fourth quartile were likely to have the lowest risk of the MetS. Therefore, we suggest that the intake of flavonoids as much as possible from food under normal dietary habit may be safe and helpful for the reduction in the MetS risk.
The strength of the present study was a large sample size and prospective design. In addition, calculation of flavonoid intake was based on the measured values in the food items consumed in Harbin, which greatly improved the estimation accuracy of flavonoid intake. Moreover, we systemically analysed the associations of flavonoids from the specific flavonoids and different food sources, and the joint associations of flavonoids and Mg intake with the MetS, providing more practical suggestions. The present study also had limitations. First, percentage of participants used to drink tea (<10 %), red wine (<5 %) and coffee (<5 %) in the cohort was too low, we did not include the flavonoids in those. This may underestimate the flavonoid intake. Second, only five flavonoids were included in the analysis based on the detected data in the earlier stage, which have been most widely investigated in anti-carcinogenesis studies. The effects of other flavonoids on the MetS were not considered. Third, variability in food flavonoids content over repeated assessment may also influence the results. In the flavonoids detection, this variability has been examined and controlled in an acceptable range(Reference Cao, Chen and Zhang18).
Conclusion
In summary, higher intake of flavonoids was associated with a decreased risk of the MetS, which was more significant in the presence of higher Mg intake. In addition, higher intake of flavonoids was also associated with a decreased risk of central obesity. Flavonoids from fruits, potatoes and legumes mainly contributed to this association. The joint effect of flavonoids with other food components and flavonoids food sources should be considered when making dietary suggestions.
Acknowledgements
We thank Harbin Center for Disease Control and Prevention. The most important acknowledgement is to the subjects and the members of the Harbin Cohort Study on Diet, Nutrition and Chronic Non-communicable Diseases (HDNNCDS).
This research is supported by the National Key R&D Program of China (2018YFC1311601) and National Natural Science Foundation of China (81872614).
L. N. and C. S. designed research; S. J., J. L., Y. J., T. H. and X. Z. conducted research; S. J., J. L. and T. H. analysed data; S. J. and L. N. wrote the paper, L. N. and C. S. had primary responsibility for final content. All authors provided inputs and approved the final manuscript.
There are no conflicts of interest.
Supplementary material
For supplementary materials referred to in this article, please visit https://doi.org/10.1017/S0007114520004754


