The metabolic syndrome (MetS), variously known also as syndrome X(Reference Saklayen1), is a cluster of independent factors such as insulin resistance, abdominal obesity, dyslipidaemia and hypertension(Reference Stefanska, Bergmann and Sypniewska2).
Due to the spread of the Western lifestyle around the world, this non-communicable disease has become a major health hazard and one that causes losses of trillions of dollars in health services and national economies(Reference Saklayen1). As of 2015, 604 million adults and 108 million children worldwide were obese(Reference Fernandes and Collaborators3). In the USA, over 30·2 million people aged ≥ 18 years had type 2 diabetes in 2017 and during the period 1988–2010, average BMI and waist circumference (WC) increased per year in both men and women(4).
Interestingly, several studies have shown the higher prevalence of the MetS in postmenopausal women, which may be due to ageing effects and menopausal effects(Reference Kim, Park and Ryu5,Reference Cho, Lee and Park6) . The prevalence of the MetS increases rapidly in women than in men(Reference Kim, Park and Ryu5); the average age for natural menopause is 51·3 years among Caucasians(Reference Zuo, Shi and Hu7) but occurs earlier in Koreans at 49 years(Reference Park, Lim and Park8). Furthermore, the prevalence of the MetS in Korea is about 13·8 % in premenopausal women and 54·6 % in postmenopausal women(Reference Kim, Park and Ryu5).
Many features of the MetS associated with the transition from premenopause to postmenopause may be a direct result of ovarian dysfunction or an indirect result of the metabolism of central fat redistribution due to oestrogen deficiency(Reference Carr9). However, several authors have concluded that the increased risk of the MetS in postmenopausal women is simply the consequence of chronological ageing(Reference Mesch, Boero and Siseles10,Reference Joo, Son and Jung11) . The difference in the prevalence of the MetS between premenopause and postmenopause may be explained in part by changes in the Fe status(Reference Stefanska, Bergmann and Sypniewska2). Fe acts as a strong prooxidative factor and promotes the formation of hydroxyl radicals, and this strong oxidative stress can damage cellular membranes, proteins and nucleic acids and actively cause inflammation(Reference Bresgen and Eckl12). It is also acknowledged that the elevated Fe storage in the body can lead to hyperinsulinaemia and insulin resistance by interfering with hepatic extraction and metabolism of insulin. During menopause, sex hormones levels change and reduced loss in menstrual blood increased Fe levels(Reference Stefanska, Bergmann and Sypniewska2,Reference Jian, Pelle and Huang13) , which may suggest the relationship between menopause, Fe status and the MetS(Reference Yoon, Go and Kim14,Reference Kim, Chon and Jung15) . Recently, studies have been conducted on the association between Fe status and the MetS; however, data are still inconsistent(Reference Cho16,Reference Cho, Shin and Yi17) . Thus, the purpose of this study is to determine the association between the MetS and Fe status including Hb and ferritin levels during menopause in Korean women.
Methods
Study subjects
This study used the database based on the fifth Korean National Health and Nutrition Examination Survey (KNHANES V 2012). KNHANES is a nationwide health and nutrition survey consisting of three components: a health interview survey, a health examination survey and a nutrition survey and has been conducted annually by the Korea Centres for Disease Control and Prevention since 1998(Reference Kweon, Kim and Jang18). A detailed description of the plan, standardised protocol and licence of the survey was available on the KNHANES website (http://knhanes.cdc.go.kr/). This study was approved by the KNHANES inquiry commission and the Institutional Review Board of Sunchon National University.
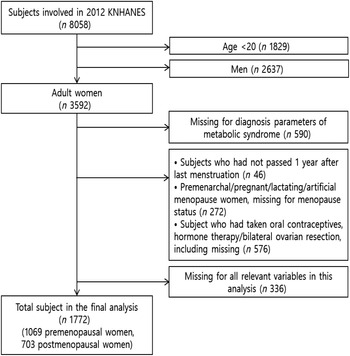
In this study, participants who were female aged over 20 years and fully took part in three parts including a health interview survey, a health examination survey and a nutrition survey were selected. Three thousand five hundred ninety-two adult women who are eligible were chosen out of a total of 8058 women who participated in KNHANES V. We excluded women with incomplete data on the diagnostic criteria of the MetS. In addition, to analyse the effects of menopausal status, we excluded women who had last experienced menstruation <12 months before completing the questionnaire and women who provided a reason for amenorrhoea rather than natural menopause (e.g. pregnancy, lactation, oral contraceptive use, hormone therapy and surgical menopause (bilateral ovarian resection)). We excluded women who lacked data on variables such as menopause, ferritin and Hb. Finally, 1069 premenopausal women and 703 postmenopausal women were included in this study (Fig. 1).

Fig. 1. Flow diagram of participants selection process.
Laboratory measurements
Height, weight, WC and blood pressure were measured during medical check-ups using standard procedures. BMI (kg/m2) was calculated by dividing body weight (kg) by the square of the height (m). WC (cm) was measured at the midpoint between the bottom of the rib cage and the iliac crest of the mid-axillary line while exhaling. Blood pressure was measured three times with intervals of 5 min using a mercury sphygmomanometer with the subject seated after a 5-min stabilisation period. Final blood pressure was the average of the second and third measurements. Blood samples were collected after ≥8-h fast and were analysed at Neodin Medical Institute in Korea. Levels of total cholesterol, HDL-cholesterol, TAG and fasting glucose were determined by an enzymatic assay using a Hitachi automatic analyser 7600 (Hitachi). Hb (reference range: 7.4–9.9 mmol/L) and haematocrit were measured by sodium lauryl sulphate Hb method and cumulative pulse height detection, respectively, using XE-2100D (Sysmex). Serum ferritin levels (reference range: 10–200 ng/ml for women) were measured by an immunoradiometric assay using 1470 WIZARD gamma-Counter (PerkinElmer). Serum ferritin <12 ng/ml was defined as Fe depletion.
Demographic status
Residence areas were classified into urban and rural. Education level was classified as below middle school, high school and college or higher. Occupations were classified as: (1) managers and professional; (2) office and clerical workers; (3) service and sales workers; (4) agriculture, forestry and fishing workers; (5) craft, plant and machine operators, and assemblers; (6) elementary occupations and (7) unemployed. Monthly house incomes were classified as: <2000, 2000–4000, 4000–6000 and ≥6000 thousand won.
Healthy lifestyles
Alcohol intakes were classified as low and high (high-risk drinking was defined as >5 drinks/d). Subjects with a lifetime history of smoking of >100 cigarettes in their lifetime and still smoked daily or occasionally were classified as current smokers; others were classified as ex/non-smokers. Physical activity was dichotomised as regular or irregular. Regular physical activity was defined as: (1) vigorous physical activity, ≥20 min per session ≥3 d per week; (2) moderate physical activity, ≥30 min per session ≥ 5 d per week and (3) walking, ≥ 30 min per session ≥ 5 d per week.
Family history
A family history of CVD was defined as having at least one parent or sibling with a diagnosis of hypertension, ischaemic heart disease or stroke. A family history of diabetes was defined as having at least one parent or sibling with diagnosis of diabetes.
Menopause
In the present study, premenopause was defined as no change in bleeding patterns(Reference El Khoudary, Greendale and Crawford19). Postmenopause was defined as the permanent cessation of menstruation after at least 12 consecutive months of amenorrhoea(Reference Sherman20). In addition, postmenopausal women at ≥1 year after the final menstrual period are referred to as natural menopausal women(Reference Kim, Park and Ryu5).
Definition of the metabolic syndrome
The MetS was defined using criteria for clinical diagnosis of American Heart Association/National Heart, Lung, and Blood Institute, which include elevated waist circumference, raised TAG, reduced HDL, elevated blood pressure and raised plasma glucose based on the National Cholesterol Education Program Adult Treatment Panel III criteria(Reference Gregory, McCullough and Ramirez-Zea21). However, the adult Asians standard proposed by the WHO was applied to the criterion for abdominal obesity(22). Subjects with three or more of the following five risk factors were diagnosed with the MetS. (1) elevated WC (≥80 cm in women), (2) elevated TAG (TAG ≥ 150 mg/dl or receiving medication for elevated TAG), (3) low HDL-cholesterol (<50 mg/dl in women or receiving medication to increase HDL-cholesterol), (4) elevated blood pressure (systolic blood pressure ≥ 130 mmHg and/or ≥85 mmHg diastolic blood pressure or on antihypertensive drug treatment and a history of hypertension) and (5) elevated fasting glucose (≥100 mg/dl or receiving medical treatment for elevated glucose).
Statistical analysis
All statistical analyses were undertaken using STATA software (version 16.0; StataCorp) and GraphPad Prism (version 8; GraphPad Software). The baseline characteristics of the menopausal status and the MetS were summarised using frequency and proportion for categorical variables; and mean and standard deviation or median and interquartile range for continuous variables. Continuous and categorical variables were compared using Student’s t test and χ 2 test, respectively.
Poisson regression analysis was used to assess the association between the MetS and Hb and ferritin levels. The potential covariates were recognised in the existing literature or by subjective prior information plus those variables with P values of ≤0·25 in univariate analysis and were entered in the full model(Reference Steenland and Armstrong23,Reference Royston, Ambler and Sauerbrei24) . In multivariate analysis, we used Poisson multivariate regression with backward elimination to detect the best-fitting model that described contributing variables. Two sequential models, model 1 and model 2, were then constructed. Model 1 was adjusted for age, BMI, high-risk drinking, physical activity, education level, monthly household income, residential areas, energy intake and occupation, while model 2 additionally added an interaction term (interaction between body Fe status and menopause status) to model 1. To visualise the moderating effect of the menopausal status, marginal effect analysis was performed using the results of Poisson regression analysis. All statistical tests were two-sided; P-value < 0·05 was considered statistically significant.
Results
General baseline characteristics
Table 1 provides the baseline characteristics and the risk of the MetS and abnormalities in its risk components by menopause status. The average age and BMI of participants were 48 years and 23·17 kg/m2, respectively. Postmenopause had higher average age (64·72 v. 36·95, P < 0·001) and BMI (24·08 v. 22·58, P < 0·001) than premenopausal women. Compared with premenopausal women, WC (81·56 v. 74·97, P < 0·001), systolic blood pressure (127·31 v. 108·55, P < 0·001), diastolic blood pressure (75·73 v. 72·02, P < 0·001), TAG (135·05 v. 94·16, P < 0·001), fasting glucose (101·03 v. 91·76, P < 0·001), Hb (13·20 v. 12·89, P < 0·001) and ferritin levels (65·60 v. 30·18, P < 0·001) were also significantly higher in postmenopausal women. By contrast, HDL-cholesterol was significantly lower (50·12 v. 54·80, P < 0·001).
Table 1. Baseline characteristics according to menopause status of the study population from the Korean National Health and Nutrition Examination Surveys in 2012
(Mean values and standard deviations; Prevalence ratio and 95 % confidence intervals)

WC, waist circumference; BP, blood pressure; TC, total cholesterol; MetS, metabolic syndrome; PR, prevalence.
* Reference with WC < 80 cm, TAG < 150 mg/dl, HDL-cholesterol ≥ 50 mg/dl, BP < 130/85 mmHg and glucose < 100 mg/dl, respectively.
The percentage of those with the MetS was lower in the premenopausal group than the postmenopausal one. As expected, the risk of the MetS and abnormalities of its all-risk factors were significantly associated with menopause status. Remarkably, the risk of Fe depletion among postmenopausal women was significantly lower than in premenopausal women.
The metabolic syndrome characteristics
Table 2 summarises the general characteristics of participants with or without the MetS. Hb (13·25 v. 12·92, P < 0·001) and serum ferritin levels (62·33 v. 37·39, P < 0·001) were significantly higher in those with the MetS. High-risk drinking, education level, monthly household income, residential areas and occupation were significantly associated with the risk of the MetS (P < 0·001).
Table 2. Characteristics by the presence of the metabolic syndrome (MetS)
(Mean values and standard deviations; numbers and percentages)

* P-value was analysed by t test for continuous variables and χ 2 test for categorical variables.
The percentage of the MetS among premenopausal women with Fe depletion and premenopausal women without Fe depletion was 5·8 % (28/240) and 94·2 % (458/1532), respectively. Premenopausal women with Fe depletion were 2·562-fold lower risk of the MetS compared with premenopausal women without Fe depletion (PR = 0·390, 95 % CI 0·266, 0·571, P < 0·001). Furthermore, the percentage of the MetS among postmenopausal women with Fe depletion and postmenopausal women without Fe depletion was 11·9 % (58/121) and 88·1 % (428/1651), respectively. The risk of the MetS among postmenopausal women with Fe depletion was higher than postmenopausal women without Fe depletion (PR = 1·849, 95 % CI 1·406, 2·432, P < 0·001) (shown in Fig. 2). Besides, we did not find the relationship between the MetS and family history of CVD and diabetes, and smoking status.

Fig. 2. Risk of the metabolic syndrome among in pre- and postmenopausal women with or without iron depletion. (A). χ
2 = 34·64, PR = 0·390, 95 % CI 0·266, 0·571. (B). χ
2 = 27·44, PR = 1·849, 95 % CI 1·406, 2·432. ![]() Premenopause with iron depletion;
Premenopause with iron depletion; ![]() Premenopause without iron depletion.
Premenopause without iron depletion. ![]() Postmenopause with iron depletion;
Postmenopause with iron depletion; ![]() Postmenopause without iron depletion.
Postmenopause without iron depletion.
nopause status, Hb, ferritin and the metabolic syndrome
Tables 3 and 4 present the relationship between the risk of the MetS and Fe during menopause status. Model 1 showed the association between the menopause status and body Fe status on the MetS after adjusting for age, BMI, high-risk drinking, physical activity, education level, monthly household income, residential areas, energy intake and occupation. Model 2 was designed to assess the interaction of the body Fe status with the menopause status.
Table 3. Poisson regression analysis to determine the association between the Hb as an iron indicator and the risk of the metabolic syndrome during menopause status*
(Prevalence ratio (PR) and 95 % confidence intervals)

* Model 1: adjusted for age (categorical variable), BMI, high-risk drinking, physical activity, education level, monthly household income, residential areas, energy intake and occupation. Model 2: further adjusted for model 1 plus interaction between body Fe status and menopause status.
Table 4. Poisson regression analysis to determine the association between the serum ferritin as an iron indicator and the risk of the metabolic syndrome during menopause status*
(Prevalence ratio (PR) and 95 % confidence intervals)

* Model 1: adjusted for age (categorical variable), BMI, high-risk drinking, physical activity, education level, monthly household income, residential areas, energy intake and occupation. Model 2: further adjusted for model 1 plus interaction between body Fe status and menopause status.
In terms of serum Hb levels, model 1 showed that subjects with the MetS included significantly more who are aged over 40 years and had high BMI. As expected, both Hb and menopause status were positively and significantly correlated with the risk of the MetS. When the Hb level increased by one unit (g/dl), the risk of the MetS increased by 12 % (PR = 1·115, 95 % CI 1·025, 1·212, P = 0·011). Postmenopausal women had a higher risk of the MetS than premenopausal women. In model 2, only Hb (PR = 1·162, 95 % CI 1·004, 1·345, P = 0·044) was associated with the risk of the MetS (shown in Table 3).
Not unexpected, serum ferritin (PR = 1·002, 95 % CI 1·001, 1·004, P = 0·012) and postmenopause (PR = 1·712, 95 % CI 1·019, 2·873, P = 0·042) were associated with the development of the MetS. Of note, we also found that both ferritin (PR = 1·006, 95 % CI 1·003,·010, P = 0·001) and postmenopause (PR = 2·183, 95 % CI 1·252, 3·806, P = 0·006) were positively significant for the development of the MetS in model 2 (shown in Table 4).
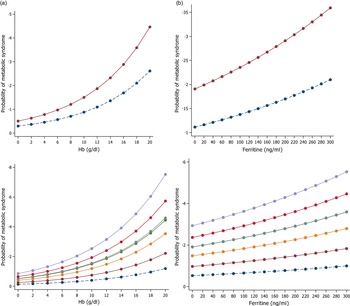
Figure 3 shows the marginal effect of the levels of serum Hb and ferritin, on the MetS by menopause and age group after adjustment for potential confounders among the Korean population. The effect of Hb and ferritin showed a similar trend. An increase in serum Hb and ferritin was associated with an increase in the risk of the MetS according to menopausal status and age group.

Fig. 3. The marginal effect of Hb (A) and serum ferritin (B) levels on the metabolic syndrome according to menopause status and age group, respectively. ![]() , 20-29;
, 20-29; ![]() , 30-39;
, 30-39; ![]() , 40-49;
, 40-49; ![]() , 50-59;
, 50-59; ![]() , 60-69;
, 60-69; ![]() , 70-79;
, 70-79; ![]() , 80-;
, 80-; ![]() , Premenopause;
, Premenopause; ![]() , postmenopause
, postmenopause
Discussion
This study reported the association between body Fe status and the MetS during menopause in adult women based on a database from KNHANES V in 2012. Our striking findings found that the risk of the MetS was significantly higher in postmenopausal women than in premenopausal women. Remarkably, an increase in serum ferritin was associated with an increase in the risk of the MetS.
As known, the main factors of the pathophysiology of the MetS and its components are abdominal adiposity and insulin resistance(Reference Stefanska, Bergmann and Sypniewska2,Reference Aganović and Dušek25–Reference McCracken, Monaghan and Sreenivasan27). Adipocytokines and proinflammatory substances secreted by visceral adipose tissue caused insulin resistance, leading to diabetes, hypertension and atherosclerosis, which is a collection of risk components of the MetS(Reference Stefanska, Bergmann and Sypniewska2). In addition, NEFA produced by lipolysis in excessive adipose tissue contribute to the pathophysiology of insulin resistance. Of note, oxidative stress interacts with adipose tissue and inflammation and reinforces the inflammatory pathway of leading to insulin resistance. Therefore, biomarkers for evaluation of the MetS include inflammatory markers, adipocytokines and Fe status(Reference Stefanska, Bergmann and Sypniewska2,Reference Bresgen and Eckl12).
Several evidence shows that the reduction of oestrogen in menopause could cause physical changes (e.g. increased central body fat)(Reference Carr9,Reference Poehlman, Toth and Gardner28) and affect Fe status(Reference Stefanska, Bergmann and Sypniewska2). During menopause, oestrogen levels rapidly decrease, but Fe levels increase. In fact, serum ferritin levels are 2–3 times higher in postmenopause than in premenopause, which is consistent with our results(Reference Jian, Pelle and Huang13). The association of oestrogen with Fe in vivo might be due to the effect of oestrogen on menstrual blood and on the expression of hepcidin, a peptide hormone that regulates Fe homoeostasis(Reference Stefanska, Bergmann and Sypniewska2,Reference Dacks29,Reference Yang, Jian and Katz30).
It has been established that menopause is a risk factor for the MetS; it is suggested that menopausal status may affect the association between Fe status and the MetS(Reference Stefanska, Bergmann and Sypniewska2); nevertheless, the association between serum ferritin levels and menopausal status has not been well-established. Our findings show that serum ferritin is positively associated with the MetS during menopause, which was consistent with several previous studies in Korea, in which high serum ferritin levels were found to be significantly associated with the risk of the MetS in postmenopause but not in premenopause(Reference Kim, Chon and Jung15,Reference Cho, Shin and Yi17). Collectively, our finding supports previous reports in Korea that serum ferritin levels were higher in pre- and postmenopausal women with the MetS than in those without the MetS(Reference Yoon, Go and Kim14,Reference Cho16), although these studies have different characteristics about sample size, study population or analysis, suggesting that the association between increased ferritin levels and the high risk of MetS.
It may be that the association between ferritin and the MetS is differentially moderated by menopause status. In the present study, we found that the risk of Fe depletion in premenopause was significantly higher than postmenopause and that the risk of the MetS tends to be decreased among premenopause with than without Fe depletion. By contrast, the risk of the MetS among postmenopausal women with Fe depletion was higher than postmenopausal women without Fe depletion. However, compared with premenopause, the risk of the MetS was higher in postmenopause, which was in agreement with the previous study(Reference Koperdanova and Cullis31). We suppose this was due to the effects of metabolic changes after menopause (e.g. abdominal obesity caused by fat rearrangement, development of insulin resistance, alterations of lipid metabolism and oxidative stress) on the pathophysiological factors of the MetS(Reference Stefanska, Bergmann and Sypniewska2,Reference Carr9).
Hb is known as a simple and low-cost indicator of Fe status(Reference Chung, Yim and Kim32). However, the role of elevated Hb levels in the risk of the MetS has not been actively studied and adequately evaluated, especially in women. In this study, the adult women were divided into premenopausal and postmenopausal groups, and Hb and ferritin levels were used as surrogates of Fe status to determine the association between Fe status and the MetS during menopausal status. We found that Hb levels were positively and significantly correlated with the risk of the MetS, which was in agreement with previous studies(Reference Chung, Yim and Kim32–Reference Zhou, Wu and Wang34).
Poisson regression analysis was also conducted after redefining age as a categorical variable to determine whether menopause status or age influenced the high risk of the MetS. According to our results, the risk of the MetS was higher in the middle-aged or older age group, which is consistent with the previous studies(Reference Kim, Park and Ryu5,Reference Cho, Lee and Park6,Reference Cho, Shin and Yi17). It could serve as a basis for confirming the importance of the menopause effect.
In the current study, we found that ferritin was significantly associated with the MetS during menopause, but Hb was not. Determination of Hb and ferritin level is considered suitable laboratory tests for assessing Fe status(Reference Mei, Cogswell and Parvanta35,Reference Jung, Park and Kim36). Hb is responsible for erythrocyte production and the turnover of haem degradation pathway(Reference Mei, Cogswell and Parvanta35). For this reason, Hb levels are influenced by factors other than Fe depletion and the specificity for the Fe state may be insufficient(Reference Mei, Cogswell and Parvanta35). Ferritin contributes to maintaining the balance of Fe inside the cell, and serum ferritin levels correlate with total Fe storage in the body in the stable state(Reference Jung, Park and Kim36). Accordingly, ferritin is a marker that sensitively reflects Fe status(Reference Cho16,Reference Daru, Colman and Stanworth37). Furthermore, serum ferritin levels provide more accurate information about when Fe stores are sufficient(Reference Mei, Cogswell and Parvanta35). Therefore, ferritin may be a more appropriate indicator of Fe status than Hb for investigating relations between elevated Fe status and metabolic response. As described above, pathological factors associated with the MetS, including oxidative stress, are enhanced in postmenopausal women, and premenopausal women may be considered to be less susceptible to the same degree of oxidative stress because they are in better physical health and have lower levels of accumulated oxidative damage(Reference Liguori, Russo and Curcio38).
Serum ferritin is used as a clinical biomarker to evaluate Fe status. When the serum ferritin increased, the risk of the MetS increased in both premenopausal women and postmenopausal women. It could be explained that ferritin itself causes a series of inflammation on the inner walls of blood vessels, leading to the dysfunction of vascular endothelial cells(Reference Fischer, Glauert and Yin39,Reference Libby, Ridker and Maseri40). Thus, to effectively prevent and manage the risk of the MetS in menopausal women, we suggest that the effects of menopause should be determined by subdividing the MetS into its diagnostic components. Moreover, further prospective or longitudinal studies are needed to clarify the causality between ferritin levels and the MetS. Particularly, clinically related studies on menopause and Fe status could offer novel treatments.
The current study’s strengths include its large sample size. Furthermore, to the best of our knowledge, our study is significant in that it is the first study that visualises the moderator effect of menopause status on the relationship between Fe status and the MetS by analysing premenopausal women and postmenopausal women at the same time. In particular, our findings demonstrated that ferritin levels are a positive correlation with the risk of the MetS and that this correlation is significantly stronger for premenopause than for postmenopause. For other research, our results may be a cornerstone for interpreting and a thorough understanding of serum ferritin levels among women at menopause. However, this study has several limitations. First, the cross-sectional design cannot evaluate causality between body Fe and the MetS during menopause. Second, we used the KNHANES V data, which were collected in 2012, and thus, recent demographic characteristics might not have been accurately accounted for which affects the generalisation of our study. In addition, subjects with serum ferritin and Hb levels outside the normal range were included in the study, and factors affecting the Fe status, such as inflammation status, Fe supplementation and anaemia, were not fully considered.
Acknowledgements
The authors thank all research staff that contributed to the data collection. This work was supported by National Research Foundation of Korea (NRF) grant funded by the Korea government (MEST) (grant nos. NRF2013R1A1A3008851 and 2018R1D1A1B07049610).
There are no conflicts of interest.
Study concept and design (H. N. D, M. S. K. and S. Y.); acquisition of data (H. N. D, S. Y. and M. S. K); analysis and interpretation of data (H. N. D, S. Y. and M. S. K); statistical analysis (H. N. D, S. Y and M. S. K), drafting of the manuscript (H. N. D, S. Y. and M. S. K), editing of the manuscript (J. S. P, C. O. and M. S. K) and approval of the manuscript (H. N. D, S. Y., J. S. P, C. O. and M. S. K).