


Iodine is an essential component for the synthesis of thyroid hormones involved in the regulation of various enzymes. Both iodine deficiency and excess can damage health. Data reflecting either iodine turnover or its effect on thyroid size and function can help define optimal iodine requirements(1).
Iodine deficiency used to be common in China. However, because the implementation of universal salt iodisation (USI) in 1995, significant progress has been made in preventing iodine deficiency disorder (IDD)(Reference Zhao and van der Haar2). As early as 2000, China virtually eliminated IDD through the USI strategy(Reference Wang, Zhang and Ge3). By the end of 2015, 94·2 % of rural China had achieved the goal of eliminating IDD(Reference Sun, Lei and Liu4). However, thyroid disease, specifically thyroid cancer, has been increasing worldwide, including in China(Reference Shan, Chen and Lian5). In addition, the most recent standard for intake of iodised salt has been changed from one national concentration to three concentrations: 30, 25 and 20 mg/kg(6). However, it is doubted that there is some correlation between the high prevalence of thyroid disease and long-term USI policy(Reference Su, Li and Liu7,Reference Li, Teng and Ba8) .
Optimal iodine intake is important for the prevention of both IDD and excess iodine. The recommended nutrient intake (RNI) of dietary iodine is an important guideline to help people achieve an appropriate iodine nutritional status. Currently, a daily iodine intake of at least 150 μg is recommended for adults in the USA(9), Canada, Australia and New Zealand(10). This is based mainly on turnover studies conducted by American scientists in the 1960s and 1970s, especially data concerning 131I radioiodine accumulation in the thyroid(Reference Fisher and Oddie11–Reference Oddie, Fisher and Long14). The absorption and transport of iodine in vivo is a complex metabolic process that is closely related to the iodine nutritional status of the body. Median urinary iodine concentration (mUIC) is recommended by the WHO, International Council for Control of Iodine Deficiency Disorders and UNICEF for assessing iodine nutrition worldwide(15). Daily iodine intake can be extrapolated from urinary concentration as follows(9): daily iodine intake = urinary iodine (µg/l) × 0·0235 × weight (kg). Yet, according to data from the National Health and Nutrition Examination Surveys I–III(Reference Hollowell, Staehling and Hannon16), the iodine status of the American population has changed from excessive to optimal. The mUIC of the American population in the 1970s was 320 μg/l, but dropped to 145 μg/l from 1988 to 1994. From 2000 to 2010, the American mUIC was maintained at 176 and 114 μg/l in male and female populations, respectively.
Similarly, with long-term USI and adjustment of the new Chinese salt iodine standard (GB26878-2011) in 2012, which decreased the recommended salt iodine concentration from 35 to 20–30 mg/kg, the mUIC in China has changed from excessive (238·6 μg/l) in 2011 to adequate (197·9 μg/l) in 2014(Reference He, Su and Liu17). However, the current iodine status or iodine requirements in China may be quite different from baseline iodine intake since the 131I radioactive iodine studies were conducted in the USA. In addition, some studies have reported that the maximum tolerance level of iodine in the Chinese population is not consistent with that in other countries(Reference Sang, Wang and Yao18). Therefore, the application of data from abroad to the Chinese population may not present the most accurate picture.
Data on average iodine requirements of the Chinese population are limited. The current RNI of iodine in China, which was calculated according to the adjustment of adult body weight in US data, is 120 μg(19). Because of biosecurity concerns, radioisotope labelling cannot currently be performed. However, it is imperative to determine a basis for the scientific iodine recommendation for Chinese residents in the future. To this end, this study carried out an iodine metabolism test to assess the average iodine requirement of young men and women in China. We also explored a new method to determine population iodine requirements according to the ‘iodine overflow’ hypothesis proposed by our team.
Experimental methods
Subjects
Sixty subjects aged 18–25 years with normal BMI (19–24 kg/m2) were recruited from Ningxia Medical University during May and June 2017. Physical examination was performed at the onset of study. Fasting blood sample and morning spot urine were used for screening. Inclusion criteria were normal thyroid function (defined as thyroid-stimulating hormone (TSH) of 0·4–4·5 mIU/l, free thyroxine (FT4) of 8·9–17·2 pg/ml and free triiodothyronine (FT3) of 1·21–4·18 pg/ml) and adequate urine iodine (mUIC 100–300 μg/l); no infection or inflammation (C-reactive protein < 10 mg/l); no overt constipation; no drugs for thyroid diseases and no nutrient supplements in the past month. A total of eighty subjects were screened and sixty (thirty male, thirty female) were eventually enrolled. All subjects signed the informed consent.
G*Power (version 3.1.3) was used for sample size calculations. As this study was a before–after self-controlled study, we use a paired t-test for sample size calculation. According to Zimmermann’s study(Reference Moore Lori, Liu Sarah and Halliday Tanya20), the standard deviation of iodine retention was 4·4 μg/d, the statistical power (1–β error probability) was set at 0·8, the α error was set at 0·05 and the effect size (f2) was estimated at 1·4(Reference Dold, Zimmermann Michael and Baumgartner21). The power calculation revealed a minimum sample size of 37.
Study design and procedures
We conducted a balance study over a total period of 19 d. The adaptation period took place for 7 d before formal metabolic testing, during which all diets were cooked with non-iodised salt. On the third day of the adaptation period, 24-h urinary iodine levels were monitored to determine whether iodine excretion reached a stable level. The overall metabolic balance test was conducted in three 4-d sections based on the dosage of dietary iodine (low, medium or high). A flow diagram of the study participants is shown in Fig. 1.
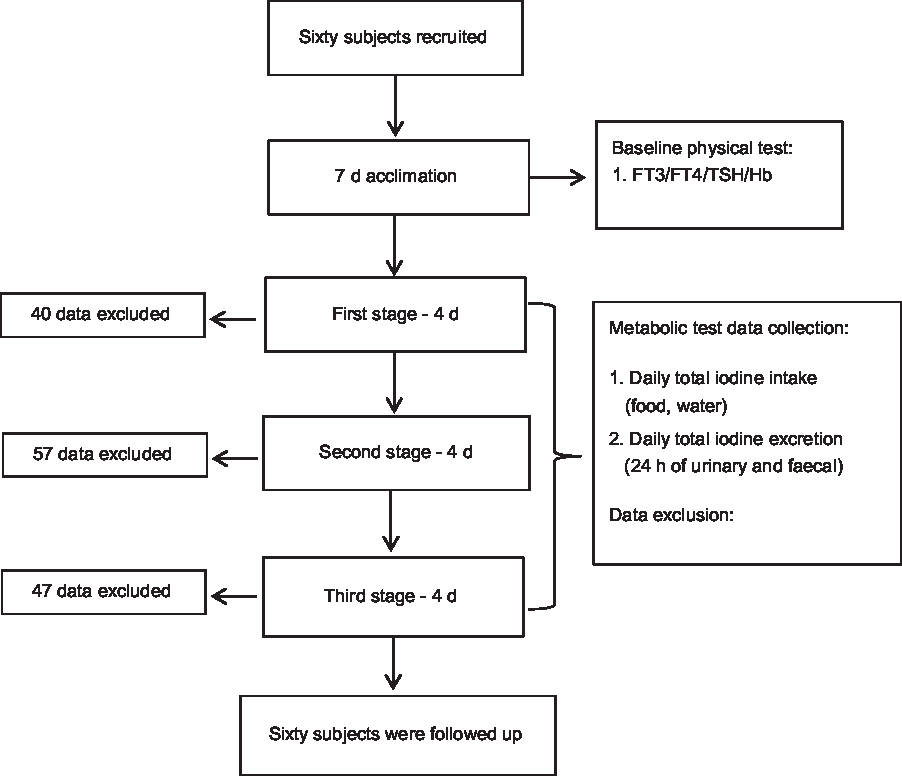
Fig. 1. Study participant flow diagram. FT3, free triiodothyronine; FT4, free thyroxine; TSH, thyroid-stimulating hormone.
Total iodine intake was defined as all iodine intake from food, cooking and drinking water. Iodine is also present in the air at very low levels; however, because it is lower than the detection limits of traditional analytical techniques, it was not factored into this study.
Total iodine excretion included 24 h of urinary and faecal iodine from 07.00 hours until 07.00 hours the following day. Iodine loss and metabolic balance in urine and faeces of young men and women were analysed in response to varying levels of iodine intake.
This study was approved by the Ethics Committee of the National Institute for Nutrition and Health in the Chinese Center for Disease Control and Prevention and registered at medresman.org (ChiCTR1800014877).
‘Iodine overflow’ hypothesis
The hypothesis is that when the body can fully and effectively absorb and use dietary iodine (i.e. only when the required iodine is adequate to meet needs for thyroid hormone synthesis and necessary storage in vivo), the remaining iodine will be excreted. Thus, before a certain iodine intake threshold is reached, iodine retention will increase accordingly, and the increased intake of iodine will ‘overflow’ and be excreted. This ‘spillover’ level should indicate the lower limit of iodine requirements for young adults.
Study diet
Study diets were designed according to daily menus at the student canteen and pre-study dietary preference questionnaires completed by all subjects.
The typical daily diet included three meals consisting of one meat course, two vegetables and one soup available for both lunch and dinner. Fruits and snacks were provided in a unified way. Staple foods could be added freely, and all other foods were provided by rationing supplies. Subjects were not allowed to eat any food, beverage or water that was not provided as part of the study.
The study diet contained three different concentrations of iodine, from low to high (about 20, 40 and 60 μg). The first stage was a low-iodine diet (avoid any food with high iodine content, and pure water without iodine was used for drinking and cooking). The second stage was a moderate-iodine diet with eggs (each egg contained 6–8 μg of iodine), and 200 g of porridge cooked with local tap water (iodine content of 39·3 μg/kg) for breakfast. The third stage was a high-iodine diet, adding about 150–200 g of milk (iodine content of 101 μg/kg) to the breakfast.
The iodine content of various local raw food materials, condiments and drinking water was measured to ensure the low-iodine dietary demand in the first stage. In addition, dairy products and eggs used to increase dietary iodine in the later periods were also evaluated in advance and purchased in a unified batch. The experimental diet was prepared using a special stove in the school canteen according to set recipes. All ingredients, including condiments, were designated brands or from the same source.
In addition to iodine, protein and fat content was analysed according to the national standard method (GB 5009.5-2016 and GB 5009.6-2016, respectively).
Assessment of iodine intake
After a 7-d acclimation period, the weights of each food ingested per meal per d during the metabolic test were accurately recorded. Subjects were instructed to consume the food and fruits and to leave left over food in the provided containers so that any residual food could be weighed to accurately estimate actual daily consumption. Samples of each kind of food were collected and mixed well using a clean blender every day during this period. The food processing information was recorded, and food samples were frozen and stored in a cryogenic refrigerator at –20°C for later determination of iodine and other major nutrients.
Assessment of iodine excretion
Urine specimen details were recorded for each 24-h collection period and reported as the total weight of urine specimens. Urine specific gravity was also measured using a calibrated dosimeter. After sufficient mixing of each 24-h collection, the urine volume was carefully calculated, and two aliquots were taken to obtain concentrations of urinary iodine and urinary creatinine. Twenty-four-h urine collections were deemed incomplete if either of the following criteria applied(Reference Tan, Tian and Wang22): urinary creatinine < 0·1 (mmol × kg)/(body weight × d), or 24-h urine volume < 500 ml. During the whole study, 24-h urinary iodine excretion was monitored daily using the Quantitative Test Kit AR for urinary iodine (Wuhan Zhongsheng) to learn in a timely manner whether the participant had ingested foods outside of the study diet.
To ensure the integrity of faecal sample collection, faeces were visually labelled with pigmentation via a carmine capsule at the onset of each of the three stages. Before breakfast on the first day of each period, two food-grade carmine capsules were taken orally to mark the start of collecting the faeces produced by subsequent food intake. Another two tablets were also taken to mark the end of faeces collection during this period before breakfast on day 5. The faeces of each subject for each iodine level stage were mixed, and approximately 200 g was taken for further freeze-drying.
Subsequently, processed urine and faecal samples were frozen at –20°C and sent for laboratory determination of iodine content. The original excretion of iodine in faeces was calculated according to the weight ratio.
Laboratory analysis
All iodine analyses were completed at the National Iodine Reference Laboratory, China CDC in Beijing, China. Contents of dietary iodine and faecal iodine were determined using arsenic-cerium catalytic spectrophotometry (national standard method GB5009.267-2016).
The national standard substance for iodine detection was purchased from the National Institute of Standards and Technology. Certified values (uncertainty range) for food (GBW10014) and water (GBW09113e) were 240 (210–270) μg/kg and 8·5 (7·0–9·4) μg/l, respectively. Average recoveries of low-, medium-, and high-iodine foods ranged from 94·9 to 106 %.
Urinary samples were analysed by a standard method of arsenic-cerium catalytic spectrophotometry (WS/T 107.1-2016). Two levels of lyophilised human urine were used as certified reference materials (CRM) (Lot Nos. GBW09108n and GBW09110q; National Iodine Reference Laboratory) with mean certified iodine concentrations of 76·9 μg/l (95 % central interval: 67·9, 85·9 μg/l) and 232 μg/l (95 % central interval 217, 247 μg/l). Both CRM were run with each batch of samples. The total within- and between-assay coefficients of variance (CV) were 1·6 and 2·7 %, respectively. Based on analyses of the relevant CRM, the average recovery of iodine from urine was 100–105 %.
Quality control
In the balance test, it is difficult to control the intake of iodine from diet. Therefore, we adopted a number of quality controls. For example, in the preparation stage of the test diet, relevant raw materials and common seasonings were all sampled and measured in advance to avoid the use of ingredients and condiments with high iodine content. All cooking water and iodine-free salt were measured to confirm iodine contents under detection levels. All participants were required to limit food to that provided during the study. To examine compliance, urine iodine rapid test kits were used daily to monitor iodine concentrations in 24-h urine samples (Fig. 2). If the urine iodine result was abnormally elevated, the volunteer was promptly given feedback and reminded to pay attention to dietary control. Duplicate meal samples for each participant were collected and measured for calculation of daily iodine intake. The final measured daily iodine consumption of low-, moderate, and high-iodine groups was kept within the target levels of 17·9, 44·2 and 62·3 μg, respectively.
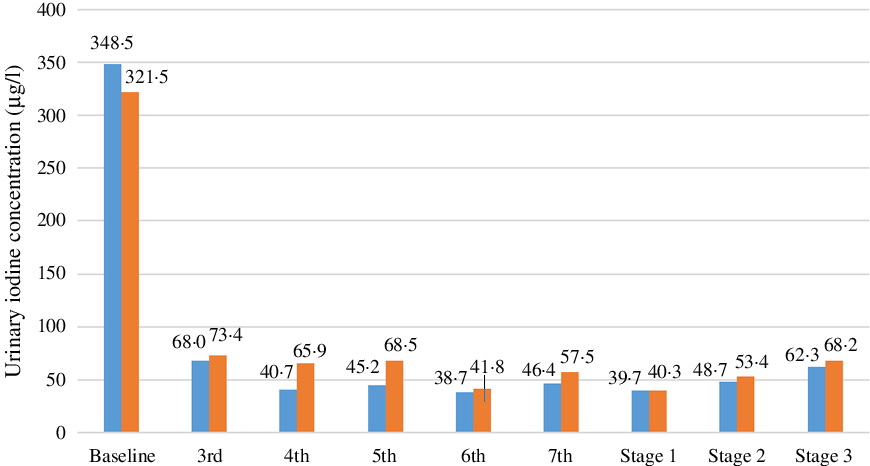
Fig. 2. Urine iodine excretion level monitoring. ![]() , Male;
, Male; ![]() , female.
, female.
Statistical analysis
Statistical analysis was performed using SPSS (version 19; IBM Corporation) and SAS 9.4 (SAS Institute). A P value less than 0·05 was considered statistically significant.
Normality distribution tests were performed on all data using the Shapiro–Wilk test. Normally distributed indices are expressed as mean values and standard deviations, while indices with non-normal distributions are expressed as medians (P25, P75). Differences in iodine intake, excretion and retention among the three stages were compared using repeated-measures ANOVA or the Friedman test for multiple comparisons of normally or non-normally distributed data. To explore the variance and sphericity of iodine intake, excretion and retention at each stage, indices were analysed by Levene’s test and Mauchly’s test.
A random effect model was used to assess the dose–response relationship between daily iodine intake and iodine excretion, as well as iodine retention. Individual iodine intake was taken as a fixed factor, while the participant was considered as a random factor in models. Pearson or Spearman coefficients were employed to examine correlations between subject characteristics at baseline and iodine excretion or iodine retention.
Model selection was based on the Akaike information criterion (AIC) and −2Res log likelihood. The dose–response relationship between iodine intake and iodine excretion (iodine retention) can be presented as µg/d or µg/kg body weight per d. From the final random effect model, we obtained predicted iodine excretion, iodine retention and the zero balance (iodine intake = iodine excretion, iodine retention = 0 μg/d) of iodine intake compared with iodine retention.
The ‘iodine overflow’ hypothesis was also used to explore iodine requirements when zero balance is reached. Increments of 24-h iodine intake and 24-h iodine excretion compared with the previous stage and ratios of the increment of iodine excretion to intake were calculated. When the ratio increased to more than 1, this indicated an ‘overflowed status’.
Results
Subject characteristics
Sixty subjects were enrolled, and all completed the study. Baseline characteristics of the participants are shown in Table 1. All subjects were in good iodine status, and the thyroid hormones (TSH, FT3 and FT4) were all within a normal range. In addition, BMI values and Hb levels of all subjects were within normal ranges.
Table 1. General characteristics of all the volunteers
(Mean values and 25th, 75th percentiles)
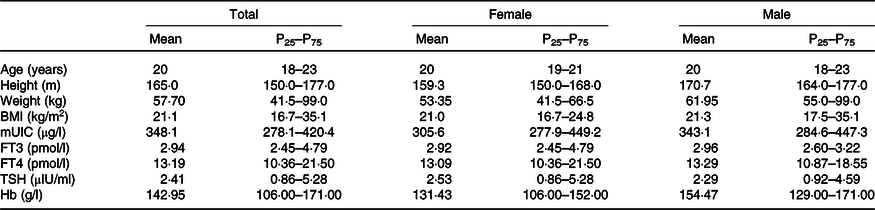
mUIC, median urinary iodine concentration; FT3, free triiodothyronine; FT4, free thyroxine; TSH, thyroid-stimulating hormone.
Analysis of experimental diet
Our study diets were matched for macronutrient content, with contributions of carbohydrate, protein and fat to total energy of 56–58, 13–16 and 29–33 %, respectively (data not shown), in accordance with local typical dietary habits. The dietary iodine intake for each iodine level was kept within target levels (Table 2), and the median iodine intake from low to high levels was 17·9, 44·2 and 62·3 μg/d (P < 0·05).
Table 2. Iodine and macronutrient intakes during the test
(Mean values and 25th, 75th percentiles)
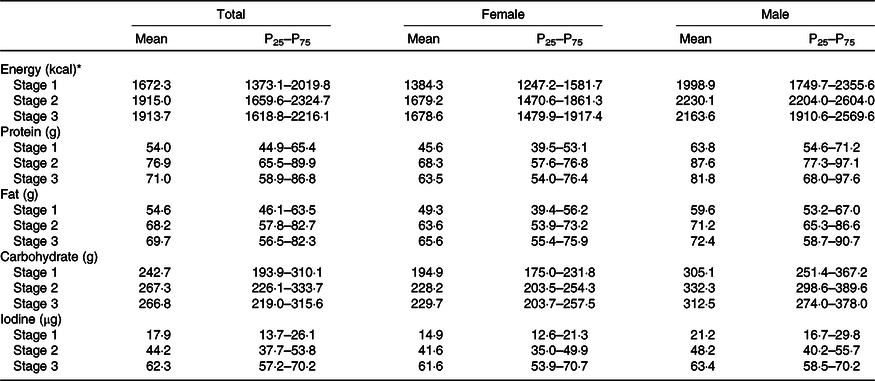
* To convert energy values from kcal to kJ, multiply by 4·184.
Monitoring urine iodine excretion levels
Urinary iodine concentration reflects very recent iodine nutrition (d) in contrast to thyroid size and serum TSH. The baseline spot urinary iodine level of all subjects in this study was high (>300 μg/l), but all three thyroid function indicators (TSH, FT3 and FT4) were normal. From the third day of the adaptation period, we collected 24-h urine from all subjects and monitored the iodine content. The average UIC dropped to 70·7 μg/l on the same day. As shown in Fig. 2, the 24-h UIC of subjects in the low-iodine diet group gradually decreased, especially in male subjects. After 7 d of adaptation, urinary iodine levels basically plateaued (<100 μg/l), which was similar to average urinary iodine excretion levels on the following four consecutive days of the low-iodine period. With increased iodine intake during the second and third stages, urinary iodine excretion also showed an increasing trend.
Association between iodine intake and excretion or retention across dosages
All sixty participants finished the whole experiment and each was monitored daily for iodine retention throughout the test; thus, the total original data points for iodine balance calculation were 720 (60 × 12). However, based on the exclusion criteria, 144 data points for iodine intake and iodine excretion were removed, yielding 576 data points for data analysis – far beyond the required minimum sample size of 37. Data were not normally distributed.
Table 3 shows the total iodine excretion of all participants during the three trial periods, including total faecal and urinary iodine. There were significant differences in 24-h urinary iodine excretion, 24-h urine volume and UIC across dosages. The rate of faecal iodine excretion to total iodine excretion was 9·5–14·5 %. The average 24-h urine volume (1·1–1·3 l) was less than reported for US adults (1·5 l)(Reference Larsson and Victor23).
Table 3. Determination of total iodine excretion
(Mean values and 25th, 75th percentiles)

* Compared with stage 1, the difference is statistically significant.
† Compared with stage 2, the difference is statistically significant.
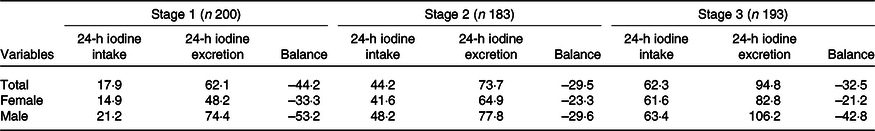
Table 4 summarises daily iodine intake, total iodine excretion and iodine retention among the three stages, which differed among low-, medium- and high-iodine groups (P < 0·001). All participants were in negative balance throughout the study period.
Table 4. Distribution of iodine intake and excretion (µg/d)
(Mean values)
For all three stages, there were no significant associations between baseline characteristics and iodine intake or iodine excretion, except for baseline Hb concentration (r 0·199–0·493, P = 0·001–0·005). Therefore, the baseline Hb concentration was added to the random effect model.
From the random effect model, the relationship between iodine intake and iodine excretion can be described by the following equations: (1) iodine excretion (µg/d) = 0·49 × iodine intake (µg/d) + 0·29 × Hb (g/l) + 10·51 and (2) iodine excretion (µg/kg per d) = 0·45 × iodine intake (µg/kg per d) + 0·002 × Hb (g/l) + 0·64.
The relationship between iodine intake and iodine retention can be calculated by the following equations: (1) iodine retention (µg/d) = 0·51 × iodine intake (µg/d) – 0·29 × Hb (g/l) – 10·52 and (2) iodine retention (µg/kg per d) = 0·55 × iodine intake (µg/kg per d) – 0·002 × Hb (g/l) – 0·64.
As Hb was identified as a covariate for model analysis, it improved the model fit for iodine excretion (AIC of 5097 compared with 5036, P < 0·001, for μg/d data; AIC of 395 compared with 363, P < 0·001, for μg/kg per d data) and iodine retention (AIC of 5133 compared with 5028, P < 0·001, for μg/d data; AIC of 461 compared with 363, P < 0·001, for μg/kg per d data). From the final model, there was a correlation between observed and predicted data for iodine excretion (r 0·538, P < 0·001, for μg/d data) and iodine retention (r 0·304, P < 0·001, for μg/d data). The zero-iodine balance derived from the random effect model shown in Figs. 3 and 4 was 102 μg/d and 1·68 μg/kg per d. With respect to sex, the mean iodine intake from zero-iodine balance was 107·8 μg/d (1·72 μg/kg per d) for males and 95·9 μg/d (1·65 μg/kg per d) for females.
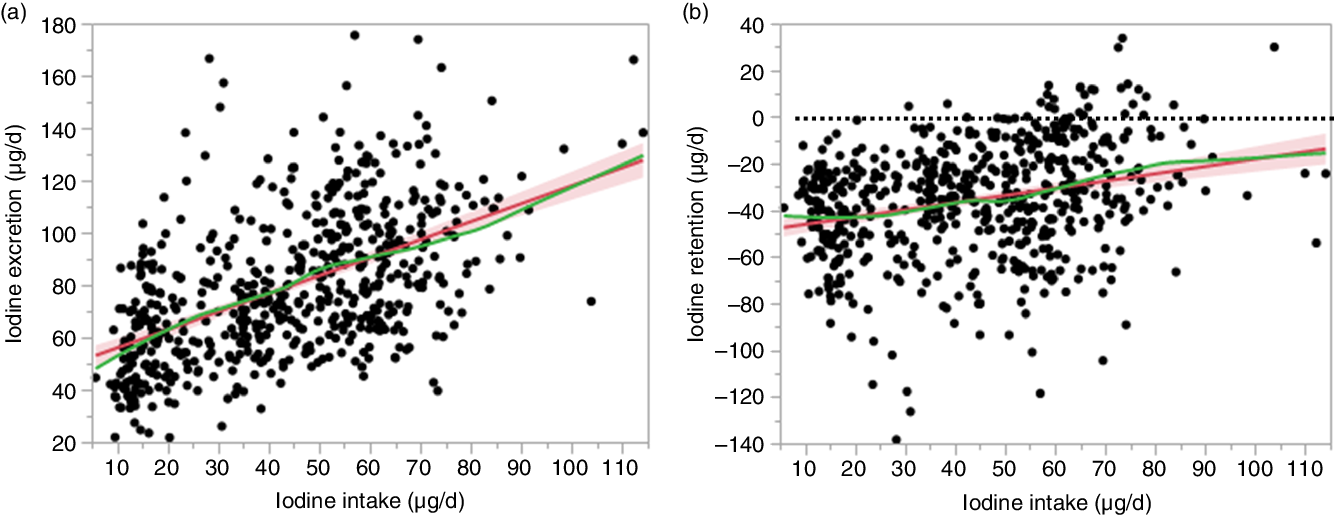
Fig. 3. Association between iodine intake and iodine excretion (µg/d) and retention (µg/d). The red line and red area represent the fitted line and the corresponding 95 % confidence interval. The green line represents the smoothing line of the points. (a) Iodine excretion (µg/d) = 0·49 × iodine intake (µg/d) + 0·29× Hb (g/l) + 10·51. (b) Iodine retention (µg/d) = 0·51 × iodine intake (µg/d) – 0·29 × Hb (g/l) – 10·52. The dotted line in (b) represents the zero balance line.
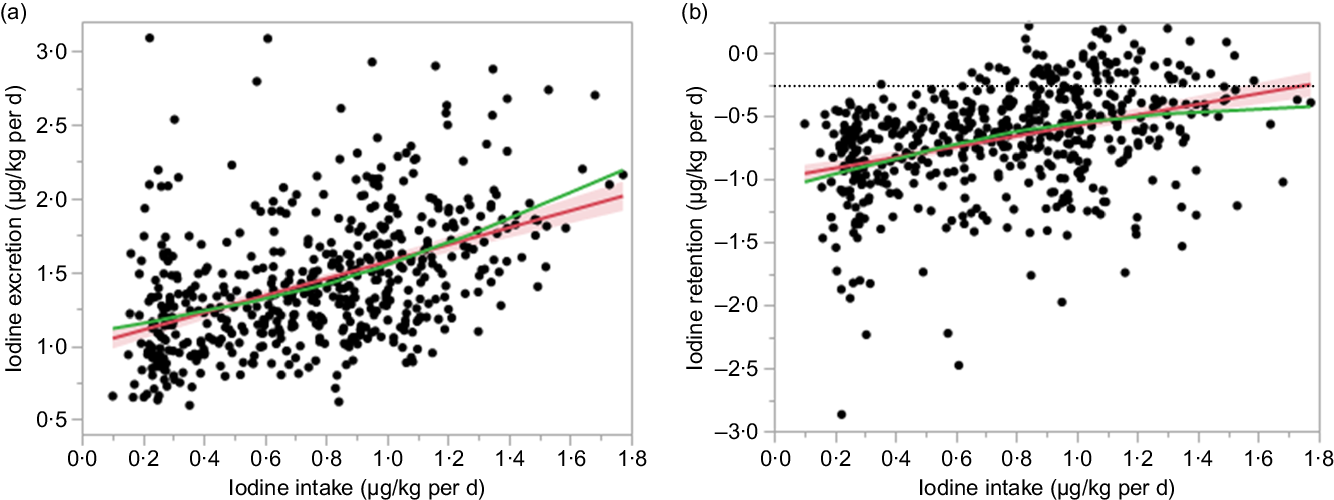
Fig. 4. Association between iodine intake and iodine excretion (µg/kg per d) and retention (µg/kg per d). The red line and red area represent the fitted line and the corresponding 95 % confidence interval. The green line represents the smoothing line of the points. (a) Iodine excretion (µg/kg per d) = 0·45 × iodine intake (µg/kg per d) + 0·002 × Hb (g/l) + 0·64. (b) Iodine retention (µg/kg per d) = 0·55 × iodine intake (µg/kg per d) – 0·002 × Hb (g/l) – 0·64.
Iodine requirement assessment by ‘iodine overflow’ hypothesis
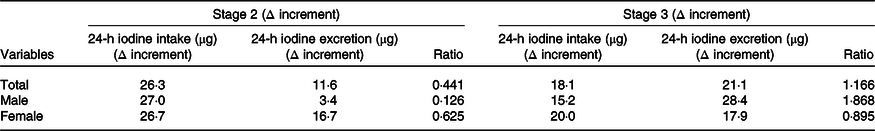
Our results also showed that with increased total iodine intake, the excretion of urinary and faecal iodine also increased. When average iodine intake increased from 17·9 to 44·2 μg/d, average iodine excretion increased from 62·1 to 73·7 μg/d (yielding a 26·3-µg increase in average daily iodine intake) and average iodine excretion increased to 11·6 μg/d. The increase of daily iodine excretion accounted for 44·1 % of the increase in average daily iodine intake. When average iodine intake increased from 44·2 to 62·3 μg/d and average iodine excretion increased from 73·7 to 94·8 μg/d, indicating an 18·1-µg increase in average daily iodine intake and 21·1-µg increase in average daily iodine excretion.
All of the increased iodine was totally excreted through urine and faeces (21·1/18·1 = 116·6 %). This trend was consistent between sexes; however, this result was more typical in men. When the intake dosage of iodine increased from medium to high, all the increased iodine was excreted through faeces and urine (ratio = 1·868), indicating an ‘overflowed status’. In women during the same period, only 89·5 % of the increased dietary iodine was excreted (Table 5).
Table 5. Changes in the ratio of iodine intake to excretion increment
(Mean values)
Discussion
Review of available literature for iodine status in the Chinese population revealed a pioneering iodine nutrition survey carried out from 1994 to 1995, which showed that mUIC less than 100 μg/l did not harm children’s intelligence quotient (IQ) in Shanghai(Reference Cai, Ma and Zhang24), the only non-endemic area of IDD in China (iodine content in tap water in Shanghai is 16·1 μg/l). Before implementation of USI in 1994–1995, the mUIC of 2640 students aged 9–13 years was 64·50 μg/l, while that of 512 adults in three factories was 89·18 μg/l. According to the current standard, this population might be slightly iodine deficient, but the rate of goitre by palpation was only 1·55 % among students aged 9–13 years in Shanghai at that time. Only grade I was recognised, and the goitre rate at an ultrasonic level was 1·57 % (urban students, 20/1277). The goitre rate of the 512 adults was 3·71 %. The average IQ level of 2893 school students was 101·52 (sd 15·99). There were no differences in IQ values between male and female students, or urban and rural students. Analysis for frequency also showed a higher proportion of high-IQ children (51·4 % students with an IQ score > 110 v. 9·7 % students with IQ < 90). Our own study(Reference Huidi, Meng and Lichen25) evaluating a mUIC cut-off value for defining iodine deficiency in pregnant women also showed that after 20 years of implementing USI, expectant Chinese mothers with an mUIC of 107·4 μg/l, less than the WHO’s 150 μg/l benchmark, maintained thyroid function in both themselves and their newborn babies.
Daily iodine intake can be extrapolated from urinary concentration(9). In adults, most dietary iodine eventually appears in the urine, in equilibrium with their iodine nutritional status. A UIC of 100 μg/l corresponds to about 150 μg of iodine per d in adults(Reference John, Marc and Francois26). If the current urine iodine standard overcorrects after long-term USI in China, it follows that the related recommended daily iodine intake may also be overestimated for the current Chinese population.
On the basis of these considerations, our team assumed that the iodine nutritional status of the body is supersaturated after 20 years implementation of USI in China. In this study, all participants were in negative iodine balance throughout the three stages. There was a non-linear relation between daily iodine intake and both daily iodine excretion and daily iodine retention. As such, the random effect model yielded poor prediction of iodine requirements in this balance study. To overcome this limitation, we proposed an innovative hypothesis, called ‘iodine overflow’, to address the current average requirement of iodine for adults (excluding pregnant women and lactating mothers). This hypothesis is based on our work demonstrating that the body can fully and effectively absorb and use dietary iodine, especially after a period of low-iodine depletion (11 d in our study)(Reference Dworkin, Jacquez and Beierwaltes27). Moreover, before a certain iodine intake threshold is reached, with the increase of iodine intake, part of the intake iodine will be retained in the body. We found that the increased iodine intake from a low to medium dosage was greater than the discharge of iodine. However, with further increases of iodine dosage (if already close to or meeting our estimated threshold value for requirement), the increased intake of iodine will be completely eliminated. In the present study, we also found that the increase in iodine intake was lower than the discharge of iodine from stage II to III in males. Thus, this ‘spillover’ level might indicate the lower limit of iodine requirements for young adults. According to this hypothesis, we designed the current iodine metabolic test, which contained three different concentrations of iodine. To identify the ‘spillover’ level, the difference between levels was about 20 μg.
All subjects in this study were in negative iodine balance throughout the different iodine stages. This result is consistent with previous studies in adults(Reference Fisher and Oddie11–Reference Oddie, Fisher and Long14). In addition, Dold et al.(Reference Dold, Zimmermann and Baumgartner28) observed a negative balance of iodine at a low dosage (60 μg/d) in a study of infant iodine requirements, as did Bakker et al.(Reference Bakker, Vulsma and de Randamie29) in healthy neonates. Iodine balance is further complicated by the need to consider the thyroidal compartment in addition to iodine intake and excretion(Reference Dworkin, Jacquez and Beierwaltes27). Thus, even in studies of several months’ duration, iodine equilibrium is not clearly established; in fact, negative iodine balance has been reported(Reference Dworkin, Jacquez and Beierwaltes27).
In the balance experiment on iodine RNI in healthy Chinese women performed by Tan et al.(Reference Tan, Tian and Wang22), 92·3 % of samples were in positive balance. This difference might arise from differing study designs. In particular, the dietary iodine intake dosage in the experimental diet used by Tan et al.(Reference Tan, Tian and Wang22) was much higher than the current RNI level (173·5 v. 120 μg/d). Yet, in our previous work, we found that volunteers could maintain normal thyroid function while they consumed non-iodised salt (average mUIC was about 60 μg/l), as indicated by TSH, an excellent indicator of altered thyroid function.
In this study, the baseline spot urine iodine concentration was more than 300 μg/l. This value might be partly related to the local water iodine concentration (23·4 μg/l), which was higher than the 2017 national average (<10 μg/l). With subjects starting the low-iodised diet, 24-h mUIC rapidly decreased to about 70 μg/l by the third day and was maintained at approximately 55 μg/l after 1 week of adaptation. As dietary iodine intake increased from 17·9 to 44·2, and then to 62·3 μg/d, the UIC increased accordingly, approaching levels experienced by Shanghai students before implementation of the USI policy (66·4 v. 64·5 μg/l)(Reference Cai, Ma and Zhang24). Moreover, the iodine concentration in local tap water in our study was similar to Shanghai in 1990 (23·4 v. 16·1 μg/l).
In terms of sample collection, Tan et al.(Reference Tan, Tian and Wang22) set up a 7-d trial period at each level of iodine intake, but only collected full sets of metabolic samples for 3 d at each level. We set up four trial days for each dosage group and collected dietary and 24-h urine and faecal samples at each stage. To ensure the integrity of faecal sample collection, carmine was used as a marker. Our original data point was 720 (60 subjects × 12 d); however, after some data were excluded, the final number of data points was 576. This value is larger than the sample size of the Tan et al.(Reference Tan, Tian and Wang22) study (300 data points) and meets the recommendation of Dworkin et al. (Reference Dworkin, Jacquez and Beierwaltes27) for a minimum of 129 metabolic test data points.
In a study of iodine requirements, Tan et al.(Reference Tan, Tian and Wang22) used a balance experiment to explore the estimated average requirement and RNI of iodine for Chinese female adults. They found a close linear relationship between total iodine excretion and intake, or total iodine intake and iodine balance; the correlation coefficients were high (r 0·735 and r 0·911, respectively; P < 0·001). No simple linear relationship existed between iodine intake and daily iodine excretion in our study (r 2 0·2452 and 0·2796 for males and females, respectively). However, there are some limitations for deriving a daily iodine requirement based on balance studies(9). First, iodine balance is complicated by the need to consider the thyroidal compartment in addition to iodine intake and excretion(Reference Dworkin, Jacquez and Beierwaltes27). It has been argued that balance should be estimated from a steady state of habitual intake and that the study duration of balance studies may be too short to obtain a new balance at a different level of intake(Reference Mertz30). Despite this limitation of balance studies, their results have been used to estimate the average iodine requirement for children(9). Dold et al.(Reference Dold, Zimmermann and Baumgartner28) assessed the dose–response relationship between daily iodine intake and iodine retention by fitting mixed effects models in early infancy. Zero balance was obtained from a mixed effects model of iodine intake compared with iodine retention (µg/d), and a proposed estimated average requirement was estimated. A strong correlation (r 0·919, P < 0·001) between observed and predicted data for iodine excretion was found in this study, indicating satisfactory performance of the model to predict iodine excretion and iodine retention from iodine intake. Yet, in our study, only a weak correlation was found between observed and predicted data for iodine excretion (r 0·538, P < 0·001, for μg/d data) and iodine retention (r 0·304, P < 0·001, for μg/d data). These findings demonstrate that as a result of a fundamentally different study design, use of these methods to analyse our data might not be suitable. Notably, a positive balance indicates that intake and/or bioavailability of the element under study from the test diet is greater than habitual intake and that the pool size is increasing until a new equilibrium is reached. The opposite is true for a negative balance, which indicates that bioavailability from the test diet is smaller than the habitual intake with the pool size decreasing to reach equilibrium(Reference Mertz30). Thus, a balance study does not determine ‘the’ requirement of a mineral element, but rather the intake required to maintain the existing pool size.
In the current study, we first tried to estimate the daily iodine requirement according to our ‘iodine overflow’ hypothesis. We found that iodine excretion increased with increased intake of iodine. With low to moderate dosages, iodine intake increased 27 and 26·7 μg/d (males and females, respectively), and 12·6 % and 62·5 % of the increased iodine intake was excreted (males and females, respectively). In males, increased iodine intake at a moderate to high level in stage three was all excreted, so the high-iodine group (63·4 μg /d) may have already reached the daily requirement, which might be adequate for thyroid hormone synthesis and necessary in vivo storage. In contrast, although the iodine intake of females in stage 3 also increased by 17·9 μg/d, 89·5 % was excreted; the rest might be restored in vivo. Thus, we estimated that the corresponding level of 61·6 μg/d does not meet the optimal requirement for females. This result is lower than the result obtained in the aforementioned balance study undertaken by Dold et al.(Reference Dold, Zimmermann and Baumgartner28), but larger than the obligatory amount of iodine excretion (57 μg/d)(Reference Vought and London12). In theory, negative balances do not persist (provided the intake is above the minimum obligatory loss) and equilibrium will establish itself, even if it takes years. However, such a long experimental period is very difficult to carry out.
The present study has both strengths and weaknesses. We believe this is the first use of the ‘iodine overflow’ hypothesis to estimate the daily requirement of iodine. Our sample size far exceeded the recommended size for balance studies and was larger than previous studies. The experimental period was also longer than previous reports. Accurate and precise analytic methods are key points for determining exact iodine balances. All of our analytic methods showed high precision and low CV values. One weakness of our study was the potential underestimation of iodine excretion and consequent overestimation of iodine retention because losses from sweat, saliva and skin were not measured. Another weakness of our study is that we used only three iodine doses and did not get to a true zero baseline. Additional dosages and longer studies are in progress to confirm our hypothesis and the present results. Finally, we did not set up a washout period; however, the implications of this would be limited in our study because of the low-high dosage design.
In conclusion, the ‘iodine overflow’ hypothesis proposed by our team provides another useful method for assessing the iodine requirement of adults in China. According to the new method, a daily iodine intake of 63·4 μg/d may satisfy the minimum iodine requirements for young male adults in China, while a similar level (61·6 μg/d) might be insufficient for females. Our findings also indicate that the present iodine RNI for male adults may be set too high. The data provide scientific evidence for a reasonable reference intake of dietary iodine for adults. However, further studies are needed to verify the results and theory.
Acknowledgements
We are grateful to all the participants in our study and all the staff working for this project.
This project was supported by the National Natural Science Foundation of China (grant no. 81872624) and Sanming Project of Medicine in Shenzhen (no. SZSM201611017) and 2017 Major Public Health Project ‘Survey and Evaluation of Iodine Nutrition and Thyroid Diseases of Chinese Population’.
Authors’ contributions were as follows: L. Y. analysed data and wrote the paper; L. Y., J. W. and J. Y. conducted the research; H. Z. and X. L. performed the statistical analysis; X. L., D. M., J. L., X. T., Y. F. and Q. C. provided essential materials; Y. G., X. L., H. W., J. X., H. T., H. Z. and W. Y. detected the iodine content of all the samples; X. L. and X. Y. designed the research. All authors read and approved the final manuscript.
The authors declare that there were no conflicts of interest.


