


Ageing and inactivity are associated with loss of muscle mass, muscle strength and muscle quality(Reference Visser, Goodpaster and Kritchevsky1–Reference Hughes, Frontera and Wood4). Obesity and low muscle strength are strong predictors of functional decline among older adults(Reference Schaap, Koster and Visser5), and serious health consequences such as limitations in daily living activities(Reference Vermeulen, Neyens and van Rossum6), disability, risk of falling, fracture and mortality(Reference Newman, Kupelian and Visser7,Reference Van Kan8) . Ageing is characterised by changes in body composition where loss of muscle mass is often accompanied by increased fat mass (FM). Age-related changes in body composition also include fat redistribution, with reduction in peripheral subcutaneous fat and increased visceral fat, and fat deposition in non-adipose tissue such as skeletal muscles(Reference Delmonico, Harris and Visser3,Reference Hughes, Roubenoff and Wood9) . Along with the rising number of older adults aged above 65 years, the prevalence of obesity among older adults is expected to increase(Reference Lim, Canevelli and Cesari10,Reference Roubenoff11) . Obesity, excessive accumulation of body fat, is associated with higher muscle mass(Reference Janssen, Heymsfield and Wang12–Reference Koster, Ding and Stenholm14), suggesting that the strength production capacity is higher in obese than non-obese individuals(Reference Lawman, Troiano and Perna15–Reference Tallis, James and Seebacher17). Additionally, since obesity is related to reduced muscle function and mobility limitation(Reference Batsis18–Reference Newman, Haggerty and Goodpaster20), muscle strength and physical performance tests, where the total body mass is taken into account or serve as an extra load, may be useful tests to identify obese individuals at increased risk of functional impairment
Handgrip strength (HGS) is widely used as an indicator of overall muscle strength, especially among older people(Reference Beaudart, McCloskey and Bruyère21). Low HGS in older adults has consistently been linked to poor health outcomes such as long-term disability onset, low quality of life(Reference Rantanen, Volpato and Luigi Ferrucci22,Reference Cooper, Kuh and Hardy23) , functional decline and mortality(Reference Rijk, Roos and Deckx24). However, in individuals with obesity, where FM serves as an extra load while moving, a limitation with measuring the absolute HGS is the reduced ability to reflect the actual physical performance capacity. Relative HGS (HGS/total body mass) has been suggested as a more sensitive method than absolute HGS to discriminate between obese and non-obese older adults at risk of impaired physical performance(Reference Ramírez-Vélez, Pérez-Sousa and García-Hermoso25). Further, muscle quality, defined as the ratio of muscle strength or power per unit muscle mass(Reference Barbat-Artigas, Rolland and Zamboni26), is another suggested parameter to identify muscle function in older adults, and the use of muscle quality is expected to grow in importance(Reference McGregor, Cameron-Smith and Poppitt27,Reference Cruz-Jentoft, Bahat and Bauer28) .
To prevent negative health outcomes and to enable older adults to remain living independently in their homes, effective and low-cost strategies to early identify functional impairment related to obesity are needed. In the present study, we aimed to detect methods to identify obese older adults at increased risk of functional impairment. Using two common phenotype definitions of obesity, we wanted to compare muscle strength (absolute HGS, relative HGS and stair climb test), muscle quality (absolute HGS/upper body appendicular skeletal muscle mass) and physical performance (balance test, repeated sit-to-stand test and gait speed) between obese and non-obese home-dwelling older adults.
Methods
Participants
The present study was conducted in 2014–2015 at Oslo and Akershus University College of Applied Sciences, Norway. Invitation letters were sent to home-dwelling women and men (≥ 70 years) living in the area of Skedsmo, Norway, listed in the National Population Register. In total, 2860 older adults (≥ 70 years of age) were invited to participate, of which 477 (17 %) responded to the invitation and thus 438 (16 %) participated. One participant withdrew the informed consent. Bioimpedance analyser (BIA) measurements were only available in 417 individuals; thus, 417 were included in this study. There were no exclusion criteria. Cognitive health and nutritional status were measured using the Mini-Mental State Examination test form and the Mini Nutritional Assessment form®, respectively. Both the Mini-Mental State Examination and Mini Nutritional Assessment have a maximum score of thirty points, and high scores indicate a high cognitive function and good nutritional status, respectively. In a previous study, data on cognitive health (Mini-Mental State Examination score), nutritional status (Mini Nutritional Assessment score), co-morbidities and dietary intake (2 × 24 h dietary recall method) in the same study population (n 417) have been shown(Reference Ottestad, Ulven and Øyri29). The data included in the current study were obtained from a cross-sectional study which served as a screening visit for a randomised controlled study (Clinicaltrials.gov, ID no. NCT02218333)(Reference Ottestad, Løvstad and Gjevestad30). The present study was conducted according to the guidelines in the Declaration of Helsinki, and all procedures involving human subjects were approved by the Regional Committees for Medical and Health Research Ethics, Health Region South East, Norway (2014/150/REK). Written informed consent was obtained from all participants. Extracts from the National Population Registry were used according to and with approval by the Norwegian Tax Administration.
Study design
In this cross-sectional study, sex-specific cut-off points for two obesity phenotypes (waist circumference (WC) and percentage of body fat (FM %)) were used to create groups that allowed within-sex comparisons of muscle strength, muscle mass, muscle quality and physical performance between obese and non-obese. For women, the cut-off points were > 35 % FM and ≥ 88 cm (obese) or ≤ 35 % and < 88 cm (non-obese). For men, the cut-off points were > 25 % FM and ≥102 cm (obese) or ≤ 25 % and < 102 cm (non-obese)(31).
Body composition and waist circumference
Body composition was measured by a single frequency BIA (BC-418 MA; Tanita Corp.), operating at 50 kHz, providing measurements of fat-free mass, body FM and FM % for the whole body. The participants were standing barefoot on the instrument platform. Four pairs of electrodes were positioned at each hand and foot, in which the low-voltage current entered the limbs. Appendicular skeletal muscle mass was derived from the sum of the fat-free mass of the four limbs based on equations incorporated in the software by the manufacturer. In-house validation of BIA against dual-energy X-ray absorptiometry was performed in forty-seven individuals of the current study population, showing comparable estimates of appendicular skeletal muscle mass measured with BIA on group level. Between-day CV % (sd/mean) of the BIA measurement of fat-free mass was calculated in a subgroup (n 46). Each subject was measured twice, on separate days. The between day CV % was 1·8 %. To identify subjects with low appendicular skeletal muscle mass, sex-specific cut-off points (< 15 kg in women and < 20 kg in men) were used(Reference Cruz-Jentoft, Bahat and Bauer28,Reference Studenski, Peters and Alley32) . WC (cm) was measured with the use of a measuring band in standing position with arms hanging loosely, and on exhalation at the midpoint between the top of the iliac crest and the lower margin of the last palpable rib. The measurement was performed with the abdomen relaxed at the end of expiration(33).
Muscle strength, muscle quality and physical performance
HGS of both hands was measured using a digital handheld dynamometer (KE-MAP80K1, Kern MAP). Participants were placed in a sitting position, elbow in 90° flexion and wrist in a neutral position. The participants were asked to squeeze the dynamometer as hard as possible simultaneously by breathing out. The maximal HGS of three measurements was registered from each hand. Absolute HGS was defined as the maximum HGS, regardless of dominant or non-dominant hand. Low absolute HGS was defined as < 16 kg in women and < 27 kg in men(Reference Cruz-Jentoft, Bahat and Bauer28,Reference Dodds, Syddall and Cooper34) . Relative HGS was defined as the absolute HGS (kg)/total body mass (kg). Upper body muscle quality was calculated by absolute HGS/upper body appendicular skeletal muscle mass(Reference Barbat-Artigas, Rolland and Zamboni26,Reference Hairi, Cumming and Naganathan35–Reference Sui, Holloway-Kew and Hyde38) . As described elsewhere, in a subgroup of forty-seven participants the between-day CV of absolute HGS was 5·0 %(Reference Ottestad, Ulven and Øyri29). Low muscle quality was defined as muscle quality < 5·475 in women and < 5·760 in men(Reference Cooper, Hardy and Bann36). The stair climb test (16 steps, 18 cm height) has been found to be a relevant measure of leg power (force and speed) impairments(Reference Bean, Kiely and LaRose39). The test was performed where each participant was given two attempts with at least 2 min rest in between, and the best performance was registered. The time was recorded to the nearest 100th of a second. No cut-off points for slow stair climb exist. The Short Physical Performance Battery (SPPB) tests (balance test, repeated sit-to-stand test and gait speed) were performed according to the SPPB protocol(Reference Guralnik, Ferrucci and Pieper40). According to SPPB, scores of 0–4 of the three tests were summed to give a maximum total score of 12 points, and a total score ≤ 8 points indicates poor physical performance. To describe subjects with reduced muscle strength in the lower body and reduced gait speed, cut-off points for the repeated sit-to-stand test (> 15·0 s) and gait speed (≤ 0·8 m/s) were used(Reference Cruz-Jentoft, Bahat and Bauer28).
Statistic
All continuous normally distributed data were presented as mean and standard deviation; not normally distributed data were presented as median (25–75 percentiles) and categorical data as number and percentage. For continuous variables, independent sample t test or Mann–Whitney U test was used in normally distributed and not normally distributed data, respectively, and for categorical variables, the χ 2 test was used. Cohen’s kappa (ĸ) was used to determine the agreement between the two phenotypes (WC and FM%) of obesity used to define women and men as either obese or non-obese. The level of significance was defined as P < 0·05. All analysis was performed using SPSS for Windows (version 26·0; SPSS, Inc.).
Results
Characteristic of the study population
In this study, 417 community-dwelling older women (n 217, 52 %) aged 74 (71–77) years and men (n 200, 48 %) aged 78 (74–82) years were included. The Mini-Mental State Examination and Mini Nutritional Assessment scores were skewed towards high values, and the median scores were 28 (26–30) and 28 (27–29) in women and 29 (26–30) and 28 (27–29) in men, respectively. As shown in Table 1, using WC and FM % to define obesity, 59 and 62 % of the women, respectively, were obese. In men, 38 and 49 % were defined as obese, respectively. Agreement between WC and FM % classification was ĸ = 0·62 (95 % CI 0·51, 0·73) P < 0·001 in women and ĸ = 0·54 (95 % CI 0·43, 0·65) P < 0·001 in men. Mean absolute HGS was 21·8 (sd 4·7) kg in women and 38·1 (sd 7·0) kg in men. Few women and men had low absolute HGS (7 and 6 %, respectively), low SPPB score (6 and 8 %, respectively) and low appendicular skeletal muscle mass (7 and 8 %, respectively). Despite this, low muscle quality was observed in 64 and 34 % of the women and men, respectively. Data on relative HGS, muscle quality, physical performance and body composition in women and men are further outlined in Table 1.
Table 1. Anthropometric measurements, muscle strength, quality and physical performance in women and men
(Mean values and standard deviations; numbers and percentages; median values and interquartile range)

* Two women and four men missing.
† Three women missing.
‡ Two women missing.
§ One women missing.
Body composition, muscle strength, muscle quality and physical performance
As shown in Table 2, older women with obesity defined by increased WC or FM % had significantly higher appendicular skeletal muscle mass but similar absolute HGS than non-obese women. However, the obese women had significantly lower relative HGS and muscle quality, and they spent significantly longer time performing the stair climb test and the repeated sit-to-stand test than the non-obese women (Table 2). As shown in Table 3, obese men defined by WC or FM % had similar absolute HGS but lower relative HGS compared with non-obese men. Further, obese men defined by WC had higher appendicular skeletal muscle mass, lower muscle quality, spent longer time on the stair climb test and the repeated sit-to-stand test than the non-obese men. The only difference between obese and non-obese men defined by FM % was lower relative HGS among obese men.
Table 2. Absolute and relative handgrip strength, muscle quality and mass, and physical performance in obese and non-obese older women
(Mean values and standard deviations)
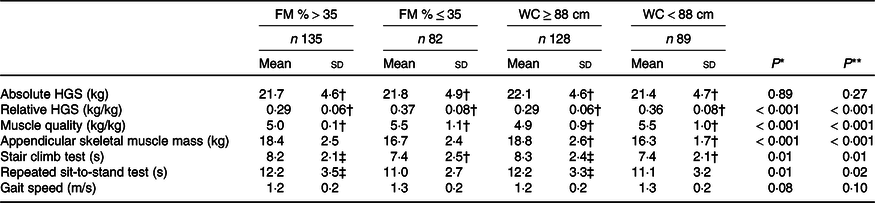
FM, total body fat mass; WC, waist circumference; HGS, handgrip strength.
* Between women with FM > 35 % v. ≤ 35%.
** Between women with WC ≥ 88 cm v. < 88 cm.
† One missing.
‡ Two missing.
Table 3. Absolute and relative handgrip strength, muscle quality and mass, and physical performance in obese and non-obese older men
(Mean values and standard deviations)
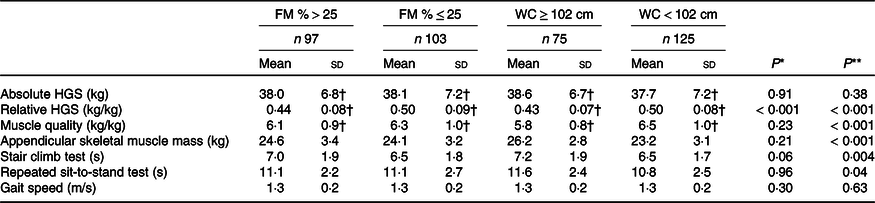
FM, total body fat mass; WC, waist circumference; HGS, handgrip strength.
* Between men with FM > 25 % v. ≤ 25%.
** Between women with WC ≥ 102 cm v. < 102 cm.
† Two missing.
Discussion
In the present study, where home-dwelling older adults had high cognitive function and good nutritional status, we show that the absolute muscle strength was not able to discriminate between obese and non-obese older adults. However, relative muscle strength in particular, but also muscle quality and physical performance tests where the total body mass was taken into account or served as an extra load, identified the obese older adults at increased risk of functional impairment.
Obesity is associated with higher FM and muscle mass(Reference Janssen, Heymsfield and Wang12–Reference Koster, Ding and Stenholm14,Reference Bouchard, Héroux and Janssen41) , and HGS produced by obese individuals is higher than in non-obese(Reference Cava, Yeat and Mittendorfer16,Reference Tallis, James and Seebacher17) . HGS is widely used for the measurement of muscle strength, and cut-off points for low HGS have been lowered by the European Working Group on Sarcopenia in Older People(Reference Cruz-Jentoft, Bahat and Bauer28) compared with previous recommendations(Reference Cruz-Jentoft, Baeyens and Bauer42). Thus, the probability to misclassify obese individuals has increased. To identify obese older individuals with low muscle strength, the total body mass must also be taken into account. Further, this may incorrectly lead to the suggestion that the actual muscle strength in obese individuals is sufficient. The present study shows that obese and non-obese older adults had similar absolute HGS, but the obese individuals had poorer physical performance where total body mass served as an extra load (repeated sit-to-stand and stair climb tests) than the non-obese. Even though absolute HGS is a highly efficient screening tool(Reference Martin, Yule and Syddall43), it may misclassify individuals as it only accounts for ∼40 % of the variance in lower body strength(Reference Manini and Clark44). Thus, caution should be taken into account when estimating overall strength from absolute HGS in obese individuals and from one single measurement tool(Reference Bohannon45–Reference Tieland, Verdijk and de Groot47). Since strength production capacity relative to body mass was lower among the obese than non-obese, it may indicate that relative HGS is a more sensitive method than absolute HGS to identify obese older adults at the risk of functional impairment. Furthermore, relative HGS has been associated with cardiometabolic disease risk factors(Reference Koster, Ding and Stenholm14,Reference Silva, Saraiva and Nascimento48,Reference Lombardo, Padua and Campoli49) . Currently, no population-specific cut-off points for low relative HGS exist. Future prospective studies are needed to establish sex-specific cut-off points that predict clinically relevant impaired muscle function.
Despite finding a higher appendicular skeletal muscle mass in obese compared with non-obese individuals, differences were not observed in absolute HGS between the two groups. It is well known that obesity leads to fat infiltration into muscle tissue, causing decline in muscle strength to a greater extent than loss of muscle mass(Reference Goodpaster, Park and Harris2). Previous studies in older adults have shown that increased FM contributes to a deterioration of muscle strength and lower absolute HGS(Reference de Carvalho, Scholes and Santos50,Reference Kim, Leng and Kritchevsky51) . Muscle quality, expressing muscle strength relative to muscle mass, declines with age and obesity(Reference Koster, Ding and Stenholm14,Reference Goodpaster, Carlson and Visser52) , and marked inter-individual differences in rates of loss have been reported(Reference Barbat-Artigas, Rolland and Zamboni26,Reference Hairi, Cumming and Naganathan35,Reference Barbat-Artigas, Pion and Leduc-Gaudet53) . In accordance with previous studies, lower muscle quality was observed in obese women and men, which may explain the lack of differences in absolute HGS between obese and non-obese individuals(Reference Koster, Ding and Stenholm14,Reference Valenzuela, Maffiuletti and Tringali54) . By definition, muscle quality provides a good indication of muscle function. However, muscle quality referring both to micro- and macroscopic changes in muscle architecture and composition(Reference McGregor, Cameron-Smith and Poppitt27,Reference Fragala, Kenny and Kuchel55) and may thus be technically difficult to measure accurately(Reference McGregor, Cameron-Smith and Poppitt27,Reference Buckinx, Landi and Cesari56–Reference Walowski, Braun and Maisch58) . Further, previous studies have shown that both muscle mass, obesity and age affect the relationship between muscle quality and physical function(Reference Barbat-Artigas, Pion and Leduc-Gaudet53). Consequently, despite similar values of muscle quality, obese individuals may have poorer muscle function than non-obese. Muscle quality measurement is suggested to grow in importance, but cut-off points for low values need to be established and validation of muscle quality as an assessment tool is needed. However, since the active muscle mass may only be a small part of the total muscle mass, it is important to emphasise that both relative HGS and muscle quality estimated by absolute HGS/upper body muscle mass have limitations. Further, muscle quality (HGS/upper body muscle mass) would not necessarily be a good measure of overall muscle quality because the muscle mass may be differently distributed on the body. Thus, implementation of muscle quality as a screening measurement for functional impairment in older adults, especially among obese, should be done with caution.
Absolute HGS has traditionally been used as a measure of muscle strength in the assessment of muscle function in older adults. However, as previously shown, lower body strength may better reflect the functional capacity compared with absolute HGS, which is necessary for activities of daily living such as mobility, gait speed and stairs climbing(Reference Bouchard, Héroux and Janssen41,Reference Coelho-Junior, Rodrigues and de Oliveira Gonçalves59,Reference Yeung, Reijnierse and Trappenburg60) . In addition, although absolute HGS has been shown to strongly correlate with leg strength in older adults, absolute HGS does not provide valid results when evaluating the efficacy of exercise intervention programmes to increase muscle mass or strength in an older population(Reference Tieland, Verdijk and de Groot47). The repeated sit-to-stand and stair climb tests are widely used as lower extremity strength measurement(Reference Beaudart, McCloskey and Bruyère21,Reference Cesari, Kritchevsky and Newman61) and have been shown relevant measures of leg power impairments(Reference Bean, Kiely and LaRose39). Further, these methods take total body mass into account and are affected by muscle strength, dynamic balance and cardiorespiratory endurance, and thus represent overall physical performance rather than overall muscle strength(Reference Lord, Murray and Chapman62,Reference Bohannon, Bubela and Magasi63) . The short gait speed test (4 m) may not be as sensitive as repeated sit-to-stand and stair climb tests in older obese adults, but studies where longer walking distances have been used (20 and 500 m)(Reference Batsis, Zbehlik and Barre64,Reference Stenholm, Rantanen and Heliövaara65) show differences between the obese and non-obese. In a clinical context, repeated sit-to-stand test and stair climbing test are simple tests that could be easily implemented.
More women than men were classified as obese, and a substantial agreement between WC and FM % was observed among women. A moderate agreement between the methods was observed in men, and only obesity defined by WC identified individuals at increased risk for functional impairment. In a previous study, where the two obesity phenotypes WC and FM % were compared, WC was more sensitive to identify older adults at the risk of functional impairment than FM %(Reference Khor, Lim and Tay66). However, in our study, more men were defined as obese by FM % than WC. Thus, the lower agreement between the obese phenotypes in men than in women could be explained by the cut-off point to define obesity by FM % in men is too low. Furthermore, WC is a surrogate measure of visceral adiposity and may reflect greater inflammatory potential(Reference Power and Schulkin67) and insulin resistance(Reference Racette, Evans and Weiss68), which may contribute to progressive loss of muscle mass, muscle strength and muscle quality(Reference Racette, Evans and Weiss68–Reference Visser, Pahor and Taaffe70). In a clinical context, WC measurement may be preferred because it is easier to implement than FM %. Moreover, increased WC is associated with lower quality of life, a decline in physical function and a slightly higher risk of disability over time(Reference Batsis, Zbehlik and Barre64). Thus, WC has been suggested to be measured routinely in clinical practice(Reference Ross, Neeland and Yamashita71).
There are, however, some limitations in this study. Food intake and physical activity may affect BIA measurements. Due to practicalities, non-fasting measurement of body composition BIA was performed in this study. To reduce the effect of physical activity, all physical tests were performed after the BIA measurement was performed. However, the participants had no restrictions on physical activity the last 24 h prior to the study visit. Thus, the non-fasting measurement and the activity level may thus have influenced the estimation of fat-free mass and FM in our study. Whether this has contributed to the reduced agreement between WC and FM % is plausible, but uncertain. Furthermore, the majority of older adults had high SPPB score, and the study population included was relatively healthy having high cognitive function, adequate nutritional status and dietary intake, and only a few had severe inflammatory disease (9 %) or respiratory diseases (5 %) as further described elsewhere(Reference Ottestad, Ulven and Øyri29). Despite this, we cannot exclude the possibility that diseases, pain or motivation may have affected the ability to perform the physical tests in some individuals. Unfortunately, we were not able to reveal age-related intra-muscular changes which affect the muscle quality. The participants included in the present study had high muscle mass and physical performance, and thus, the results may not be generalised to obese older frail or sarcopenic older adults. A strength of the present study was the large number of participants, and the fact that several tests were included to assess body composition and muscle function.
In conclusion, methods to identify obese older adults with increased risk of functional impairment are needed. We show that neither muscle mass nor absolute muscle strength was able to discriminate between obese and non-obese older adults at increased risk of functional impairment. However, relative muscle strength, muscle quality and physical performance tests where body mass serves as an extra load identified obese older adults with an increased risk of functional impairment. Relative HGS is a simple and an effective method that is easy to implement for routine clinical practice. Thus, prospective studies are needed to investigate clinically relevant cut-off points for relative HGS in relation to functional impairment in older adults.
Acknowledgements
The authors gratefully acknowledge the participants who volunteered to this study, and we thank Navida A. Sheikh, Ellen Raael, Marit Sandvik and Asta Bye for valuable assistance in this project.
The present study was supported by the Research Council of Norway (grant number 225258/E40), Oslo and Akershus University College of Applied Sciences, University of Oslo, Throne Holst Foundation for Nutrition Research and TINE SA.
S. M. U., K. B. H. and I. O. conceived and designed the study, L. K. L. Ø. and I. O. conducted the research and A. L. N. and I. O. interpreted and performed statistical analysis. A. L. N. and I. O. wrote this paper and had the primary responsibility for the final content. All authors have critically reviewed the manuscript.
A. L. N., L. K. L. Ø., T. R. and I. O. have no competing interest. During the past 5 years, S. M. U. has received research grants from TINE, Mills DA and Olympic Seafood, but are not related to the content of this manuscript. During the past 5 years, K. B. H. has received research grants or honoraria from Mills DA, TINE, Olympic Seafood, Amgen, Sanofi, Kaneka and Pronova. None of them is related to the contents of this manuscript either.


