


Patients admitted to vascular surgery units are a nutritionally vulnerable group with rates of malnutrition as high as 60–90 % cited in the literature(Reference Thomas, Delaney and Suen1–Reference Zhang, Tang and Fang4). Poor nutritional health has significant consequences such as higher rates of infection(Reference Westvik, Krause and Pradhan5), longer hospital length of stay(Reference Ambler, Brooks and Al Zuhir6,Reference Gau, Chen and Hung7) and more proximal amputations in those with diabetic foot infections(Reference Gau, Chen and Hung7).
Identification and nutritional management of malnutrition in patients admitted to vascular surgery units is paramount to maximise nutritional health and clinical outcomes. To date, there has been limited research examining methods to identify and diagnose malnutrition in this patient group. We have previously reported that four commonly used malnutrition screening tools (Malnutrition Universal Screening Tool, Malnutrition Screening Tool, Nutrition Risk Screen-2002 and the Mini Nutritional Assessment – Short Form) were ineffective in identifying risk of malnutrition amongst vascular surgery patients(Reference Thomas, Kaambwa and Delaney8). However very little evidence is available regarding appropriate nutrition assessment tools.
In 2019, the Global Leadership Initiative on Malnutrition (GLIM) was proposed as a diagnostic framework for diagnosing protein–energy malnutrition (PEM). The purpose of GLIM was to build a global consensus regarding the criteria required for diagnosing PEM in a clinical setting. Empirical consensus was reached that the first step of GLIM is using a validated screening tool to identify patients at risk of malnutrition. The next step, the diagnosis of PEM, is derived from the presence of one or more of three phenotypic criteria (non-intentional weight loss, low BMI and reduced muscle mass) and one or more of two aetiological criteria (reduced food intake and inflammation/disease burden)(Reference Cederholm, Jensen and Correia9). Work has commenced on validating the GLIM framework with a recent study in adult inpatients examining the performance of GLIM using Subjective Global Assessment (SGA) as the comparator(Reference Allard, Keller and Gramlich10). Results showed sensitivity (Sn) and specificity (Sp) values of 61·3 % and 89·8 %, respectively, when GLIM malnourished was compared with malnourished (SGA B and C combined) on the SGA. Similar work has been undertaken in a range of clinical specialties included geriatric rehabilitation(Reference Clark, Reijnierse and Lim11), ambulatory cancer care(Reference De Groot, Lee and Ackerie12) and intensive care patients(Reference Theilla, Rattanachaiwong and Kagan13,Reference Henrique, Pereira and Ferreira14) with Sn values of 56·7 %–100 % and Sp of 55·3 %–98·1 %. Studies examining the GLIM vary in the interpretation of the GLIM process, including how the criteria are interpreted as well as the inclusion or exclusion of the initial screening.
A nutrition assessment tool commonly used in the clinical setting is the Patient-Generated Subjective Global Assessment (PG-SGA)(Reference Ottery, McCallulm and Polisena15). The PG-SGA incorporates a range of parameters to determine whether a patient is well nourished (PG-SGA-A), suspected or moderately malnourished (PG-SGA-B) or severely malnourished (PG-SGA-C) and has been used as the gold standard in recent studies exploring the validity of the GLIM(Reference Rosnes, Henriksen and Høidalen16,Reference Ijmker-Hemink, Heerschop and Wanten17) . In these studies, agreement between the GLIM and PG-SGA was low(Reference Ijmker-Hemink, Heerschop and Wanten17) to fair(Reference Rosnes, Henriksen and Høidalen16) with Sn of 43 % and 51 % and Sp of 79 % and 98 % and kappa (κ) of 0·22 and 0·37. Rosnes et al.(Reference Rosnes, Henriksen and Høidalen16) did observe improved (Sn 76 %, Sp 80 %, κ 0·51) agreement when the NRS2002 screening component was removed from the GLIM.
To further the work being undertaken to validate the GLIM criteria in other patient groups and to examine whether GLIM is appropriate for use in vascular surgery units, the aim of this study was to determine the criterion validity of GLIM in diagnosing PEM in patients admitted to a vascular surgery unit using the PG-SGA as the comparator (Semi-gold standard(Reference Cederholm and Barazzoni18)).
Methods
This study is a retrospective analysis of baseline data collected during an observational study conducted from October 2014 to August 2016 that examined the nutritional status of adult patients admitted to a tertiary vascular surgery unit in Adelaide, South Australia. Data variables utilised in this study were chosen based on the recommendations outlined for validation of GLIM criteria(Reference de van der Schueren, Keller and Cederholm19). A full description of the study and participant recruitment methods has been described elsewhere(Reference Thomas, Delaney and Suen1). All patients over 18 years of age were eligible to participate but were excluded if they were admitted for day procedures only, were unable to be recruited within 72 h or were receiving palliative care. The study received ethical approval from the Southern Adelaide Health Research and Ethics Committee (approval number 258.14) and governance approval from the Flinders Medical Centre.
Within 72 h of admission, on entry to the study, the PG-SGA was conducted by an accredited practicing dietitian according to the methods of Ottery et al.(Reference Ottery, McCallulm and Polisena15). Each participant was awarded a PG-SGA rating of PG-SGA A (well nourished), B (moderately or suspected malnutrition) or C (severely malnourished).
Retrospective determination of PEM according to the GLIM was completed using baseline parameters. Participants were only included in the analyses if they had all relevant parameters collected at baseline. The GLIM framework incorporates a validated screening tool of choice as the first step; however, in the current study, this step was not included as there was not a valid screening tool completed at the time of data collection. For the phenotypic criteria, percentage weight loss was determined using self-reported weight history at 6 months prior to data collection, or where 6-month data were not able to be reported 1 month data were utilised. This was then compared with current weight to derive percentage loss over 6 months or 1 month, respectively. Body weight was collected using a calibrated weigh chair (HVL-CS Hospital Chair Scale, A&D Mercury Pty Ltd) to the nearest 0·1 kg. BMI was estimated using actual body weight and estimated height from ulna length(20). Low BMI for age was determined as per the GLIM framework(Reference Cederholm, Jensen and Correia9). Muscle mass was determined using the Lunar Prodigy Pro dual-energy X-ray absorptiometer (DEXA) in conjunction with Encore software version 7.5. Appendicular skeletal muscle was calculated as the sum of the appendicular lean soft tissue in both upper and lower limbs and converted to appendicular skeletal muscle index by dividing the appendicular skeletal muscle mass by height squared (ASMI, kg/m2). Participants were classified as having low muscle mass if ASMI was <7·26 kg/m2 in males and <5·25 kg/m2 in females as per the GLIM framework(Reference Cederholm, Jensen and Correia9).
For the aetiologic criteria, information regarding reduction in food intake for 2 weeks or more was collected from the baseline PG-SGA along with data regarding the presence of gastrointestinal symptoms impacting food intake. Similarly, information regarding acute disease/injury or chronic disease-related inflammation was collected from baseline PG-SGA and medical case note entries. These variables included the presence of active liver, respiratory or renal disease, active cancer and/or blood malignancies, major abdominal surgery from the PG-SGA(Reference Ottery, McCallulm and Polisena15) as well as poorly controlled diabetes and medical diagnosis of inflammation in the case notes. Plasma C-reactive protein was measured according to the hospital laboratory and also utilised for the aetiologic criteria of inflammation if values were greater than 8·0 mg/l as per laboratory indicators.
Participants were diagnosed as malnourished according to the GLIM if they displayed at least one phenotypic and one aetiological criterion as per the framework(Reference Cederholm, Jensen and Correia9).
Statistical analysis
All analyses were conducted using SPSS for Windows version 27 (SPSS Inc.). Descriptive statistics were presented as mean and standard deviation or median (interquartile range) depending on normality. Sample characteristics were expressed as frequencies (n, %).
Diagnostic accuracy and consistency of the GLIM were examined. Sn, Sp, positive predictive value and negative predictive value were determined against the results of the PG-SGA (the reference standard) to determine the diagnostic accuracy of the GLIM in diagnosing patients with malnutrition according to recommendations(Reference de van der Schueren, Keller and Cederholm19). As the PG-SGA results in three categories of nutritional status, PG-SGA B and PG-SGA C categories were amalgamated resulting in two categories of ‘well nourished’ and ‘malnourished’ to enable Sn and Sp analysis which is common practice in the literature(Reference Chi, Yin and Zhu21–Reference Donini, Poggiogalle and Molfino23). The recommended cut points for Sn and Sp for determining diagnostic accuracy were set at 80 % as per de van der Shueren et al.(Reference de van der Schueren, Keller and Cederholm19).
Diagnostic consistency between the GLIM and PG-SGA was assessed using κ statistic. The value of κ varies from 0 to 1 with values <0·2 indicating poor, 0·21–0·4 fair, 0·41–0·6 moderate, 0·61–0·8 substantial and >0·8 as almost perfect concordance. Negative κ values indicate that the number of agreements observed is fewer than would be expected by chance indicating poor consistency overall(Reference Landis and Koch24).
Due to the retrospective nature of this study and the inability to do a sample size calculation, a post hoc power calculation was performed to determine the statistical power of the findings. This was conducted using the prevalence of malnutrition found with the PG-SGA as the known population (comparator) and the prevalence of malnutrition found with the GLIM as the study group and an α value of 0·05. Post hoc power calculation was conducted using the online ClinCalc post hoc power calculator to evaluate the statistical power of an existing study(Reference Kane25).
Results
A total of 322 participants were recruited into the original study from a total of 902 eligible patients admitted to the vascular surgery unit(Reference Thomas, Kaambwa and Delaney8). Of the 322 participants, 224 had a full data set to enable determination of the GLIM and were included in this study.
Participant characteristics are shown in Table 1. The majority of participants were male (70·1 %) with a mean (sd) age of 67·3 (14·4) years and median (interquartile range) BMI of 27·8 (24·2, 32·3) kg/m2. Sixty-five (29 %) participants had at least one GLIM phenotype criterion and 194 (86·6 %) had at least one aetiological criterion. Overall, 64 (28·6 %) participants were classified as malnourished by the GLIM, and thirty-eight (17 %) by the PG-SGA.
Table 1. Participant characteristics
(Numbers and percentage; mean values and standard deviations)

IQR, interquartile range; GLIM, Global Leadership Initiative on Malnutrition; PG,-SGA, Patient-Generated Subjective Global Assessment.
Table 2 displays the diagnostic accuracy of the GLIM compared with the PG-SGA with Sn value of 73·7 % (95 % CI (52·8, 94·6)) and Sp 80·6 % (95 % CI (75·2, 86·0)) with negative predictive value of 93·8 % as well as positive predictive value of 43·8 %. There was an overlap of twenty-eight patients that were classified as malnourished by both methods (43·8 % of the GLIM malnourished and 73·7 % of the PG-SGA malnourished). κ was found to be 0·427 (P < 0·001) indicating moderate diagnostic consistency.
Table 2. Concurrent validity of the GLIM in a sample of 224 adult inpatients of a vascular surgery unit compared with the PG-SGA
(Percentages and 95 % confidence intervals)
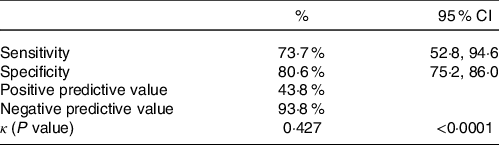
GLIM, Global Leadership Initiative on Malnutrition; PG,-SGA, Patient-Generated Subjective Global Assessment.
The post hoc power calculation is shown in Fig. 1. Using an incidence of 17 % in the population (PG-SGA, comparator) and 28·6 % incidence in the study group (GLIM), and an α of 0·05, a sample size of 224 resulted in a post hoc power of 98·7 %.

Fig. 1. Post hoc power calculations. GLIM, Global Leadership Initiative on Malnutrition; PG,-SGA, Patient-Generated Subjective Global Assessment.
Discussion
This study adds further to research already conducted exploring the validity of GLIM in the diagnosis of PEM across clinical specialties. It also adds to the research examining the assessment of PEM in patients within vascular surgery units.
In patients within a vascular surgery unit, the GLIM reached a Sn of 73·7 % and Sp of 80·6 % which is approaching the cut-off value of 80 % that indicates a valid instrument. However, the positive predictive value was low indicating that whilst the GLIM was able to identify the same malnourished patients as the PG-SGA, it also has a high likelihood of over-diagnosing malnutrition and hence may not be a valid assessment method when compared with the PG-SGA in this patient group.
Previous research examining the validity of the GLIM has produced Sn and Sp values of 43–85 % and 69–79 %, respectively(Reference Allard, Keller and Gramlich10–Reference Theilla, Rattanachaiwong and Kagan13,Reference Rosnes, Henriksen and Høidalen16,Reference Ijmker-Hemink, Heerschop and Wanten17) ; however, the patient groups are varied, and the reference standards also differ across the studies making comparisons more challenging. Other differences can be observed across studies in how the presence of low muscle mass has been determined. Two studies(Reference Rosnes, Henriksen and Høidalen16,Reference Ijmker-Hemink, Heerschop and Wanten17) have utilised bio-electrical impedance assay to determine low muscle mass with another study(Reference De Groot, Lee and Ackerie12) relying on hand-grip strength in addition to low BMI as an alternative method for muscle mass. Previous studies have utilised bio-electrical impedance assay to determine fat free mass (FFM), which can be affected by hydration status and less reliable in obese individuals and in PEM(Reference Coppini, Waitzberg and Campos26,Reference Mialich, Faccioli Sicchieri and Jordao Junior27) . In the current study, FFM was determined using DEXA which is a preferred method and could be viewed as a more robust method compared with the other studies(Reference Cruz-Jentoft, Bahat and Bauer28).
Overall, the GLIM identified a higher proportion of patients as malnourished compared with the PG-SGA which may be due to the differences between the two methods. The PG-SGA incorporates subjective assessment of body composition as opposed to the objective methods used in the GLIM which could lead to under-estimation of muscle and fat depletion by the assessor. Objective measures of muscle stores in the GLIM eliminate the potential assessment bias associated with subjective measures. Another potential reason for the differences is the contribution of the different parameters to the overall diagnosis of nutritional status in the two methods. In the PG-SGA, the physical exam, nutrition impact symptoms and other parameters contribute different weightings to the overall assessment, whereas each criterion in the GLIM is of equal weighting to the overall assessment. Differences in the time frame of reported weight loss (1 month in the PG-SGA and 6 months in the GLIM) could also impact on differences in the overall diagnosis of malnutrition using both methods.
Overall prevalence of PEM in the participants of the current study was 17 % (PG-SGA) and 28·6 % (GLIM) which is lower than other studies examining patients in the vascular surgery setting(Reference Thomas, Delaney and Suen1,Reference De Waele, Moerman and Van Bael3,Reference Zhang, Tang and Fang4) . However, it is dependent on the type of nutritional deficits being included in the assessment and the method of assessment employed. Whilst PEM is relevant in this patient group, micronutrient deficiencies are also relevant and prevalent(Reference Thomas, Delaney and Suen1) and are not captured with either assessment method examined in the current study.
In this study, only nineteen (8·5 %) participants reported a weight loss of 5 % or more and only 12·5 % and 13·5 % were found to have a low BMI or reduced muscle mass, respectively, so only 29 % (n 65) displayed the minimum of one phenotypic criterion required for the GLIM. Conversely, a high proportion (86·6 %) of participants had at least one aetiological criterion, with 174 (77·65 %) displaying the inflammation criterion and 102 (45·5 %) reporting a reduced oral intake. These figures indicate that whilst patients in vascular surgery units may have reduced intake and/or inflammation, it is not translating to the traditional phenotypic criteria included in the GLIM and traditional measures of nutritional status that are incorporated in most assessment tools. Hence, to fully capture the extent of nutritional deficits (PEM as well as micronutrients), an assessment tool incorporating both markers of PEM and micronutrients would be of great value.
When discussing the results, it is important to consider the strengths and limitations of the study. A key strength of the study is that muscle mass was determined using DEXA which is an objective, reliable method of determining muscle quantity according to the revised European consensus on the diagnosis of sarcopenia(Reference Cruz-Jentoft, Bahat and Bauer28). The post hoc power calculation demonstrated that the sample size was adequately powered to detect a difference between the two methods; hence, the results are not due to type 1 error. In addition, the sample size is still comparable or larger than those found in other tool validation studies(Reference Henrique, Pereira and Ferreira14,Reference Pars, Açıkgöz and Erdoğan29–Reference Jackson, MacLaughlin and Vidal-Diez31) and well-cited recommendations(Reference Willet32). A potential limitation to acknowledge is in the determination of data to address the phenotypic criterion pertaining to weight loss in the GLIM. In the GLIM, the cut-off used is >5 % within the past 6 months (or >10 % beyond 6 months). As these data were obtained from the PG-SGA collected in the original study, we were not able to determine whether the >5 % weight loss reported in the PG-SGA was within 6 months or 1 month in some participants. Whilst there is an element of lack of clarity regarding this data, it would not affect the results as weight loss over 1 month or 6 months would meet the GLIM criterion. Another potential limitation could be the omission of the initial screening component of the GLIM which has also occurred in other validation studies(Reference Allard, Keller and Gramlich10,Reference López-Gómez, Ballesteros-Pomar and Torres-Torres33) . Whilst the authors speculate that it is unlikely to it have affected the proportion diagnosed as malnourished in the subsequent assessment phase of the GLIM, future studies should examine the full GLIM including the screening component.
In conclusion, the GLIM framework for diagnosing malnutrition did not perform adequately in a cohort of patients admitted to a vascular surgery. A key nutritional issue in patients within vascular surgery settings is micronutrient-deficit, and hence the addition of parameters to identify these deficits in addition to PEM would be of great value.
Acknowledgements
The authors wish to acknowledge the study participants who provided their time and commitment to the original data collection
This research received no specific grant from any funding agency, commercial or not-for-profit sectors.
J. T. contributed to the study design and carried out the study including data analysis and interpretation of the findings as well as writing the manuscript. C. D. contributed to the study design as well as the writing of the manuscript. M. M. contributed to the study design, interpretation of the findings and the writing of the manuscript.
There are no conflicts of interest.


