


Plasma 25-hydroxyvitamin D (25(OH)D) inadequacy (<50 nmol/l; deficiency and insufficiency) is a recognised health problem( Reference Ahmed, Franey and McDevitt 1 ). Despite vitamin D supplementation guidelines( 2 , Reference Holick, Binkley and Bischoff-Ferrari 3 ), their implementation remains inconsistent( Reference Pramyothin and Holick 4 ) and 25(OH)D inadequacy in healthy children ranges from 14 to 49 % worldwide( Reference Choudhary, Chou and Heller 5 ). A recent systematic review reported prevalence of plasma 25(OH)D deficiency and insufficiency of 41 and 59 %, respectively, in European paediatric cancer patients, higher than healthy children and paediatric cancer patients from North America (15 and 46 %) and the Middle East (24 and 51 %)( Reference Revuelta Iniesta, Rush and Paciarotti 6 ).
Plasma 25(OH)D is primarily obtained from UVB sunlight through dermal synthesis, but it can also be obtained from the diet. However, few foods naturally contain vitamin D( Reference Holick 7 ), and in the UK fortification is rare( 8 ). In high-latitude countries, such as Scotland( 8 ), populations are at an increased risk of 25(OH)D inadequacy. Other factors contributing to 25(OH)D inadequacy in children have been attributed to skin pigmentation, obesity and age (infants and adolescents)( 2 , Reference Holick 7 ).
Children treated for cancer experience multiple side effects, which might affect plasma 25(OH)D. These include phototoxicity, which requires avoidance of direct sunlight, reduced dietary intake( Reference Oeffinger, Mertens and Sklar 9 ), hepatotoxicity and nephrotoxicity, which may interfere with the activation of 25(OH)D( Reference Zhou, Assem and Tay 10 ). 25(OH)D inadequacy in children increases the risk of bone fractures, rickets and slow growth( Reference Herbst, Bajorin and Bleiberg 11 ), with a subsequent increased risk of osteoporosis( Reference Oeffinger and Hudson 12 ). Most children and adolescents treated for cancer survive into adulthood( Reference Wallace, Thompson and Anderson 13 ), but they have an increased risk of developing the metabolic syndrome, cardiac complications and have a reduced peak bone mass( Reference Wallace, Thompson and Anderson 13 ). Despite the importance of vitamin D to health, the high prevalence of 25(OH)D inadequacy in Europe and the recent call for high-quality population-based longitudinal cohort studies, there are a few published studies in the UK, and none in Scotland, investigating plasma 25(OH)D concentration in paediatric cancer patients( Reference Revuelta Iniesta, Rush and Paciarotti 6 ). To address this clinical question, we aimed to investigate both plasma 25(OH)D and parathyroid hormone (PTH) concentrations of paediatric cancer patients at defined time points for 24 months; compare plasma 25(OH)D concentration of healthy children with a paediatric cancer cohort from Scotland; and explore possible factors (age, ethnicity, sex, seasonality, nutritional status, diagnosis, treatment and the use of nutritional support) contributing to plasma 25(OH)D inadequacy at baseline and at 3 and 6 months.
Methods
Study design, population and timeline
A prospective cohort study was conducted. Eligibility criteria were children aged <18 years, diagnosed with cancer (International Classification of Childhood Cancer, third edition; ICCC-3)( Reference Steliarova-Foucher, Stiller and Lacour 14 ) or Langerhans cell histiocytosis between August 2010 and January 2014 and attending the South East Scotland regional centre (56°N) for Haematology and Oncology at the Royal Hospital for Sick Children (RHSC), Edinburgh or Ninewells Hospital, Dundee; patients were recruited consecutively. We excluded children who were treated palliatively at any time. Children were monitored for a maximum period of 24 months and all measurements were obtained at baseline (newly diagnosed), 3, 6, 9 and 12 months and every 6 months thereafter. Factors contributing to plasma 25(OH)D inadequacy were only explored at baseline and at 3 and 6 months because of the reduced sample size at later stages.
Anonymised control data were obtained from the control subjects recruited within a case–control study of vitamin D in children with epilepsy carried out between July 2013 and March 2014 at RHSC. Controls were recruited over an overlapping time frame, similar representative seasons and regions as the cancer patients. Consecutive potentially eligible controls attending the RHSC Emergency Department (which serves SE Scotland) who were previously healthy, not in extremis nor had an existing chronic condition (and specifically no epilepsy or other seizure disorder) and who required blood samples to be taken as part of their clinical assessment (e.g. child with a fever) were invited to the epilepsy study. Participants to the epilepsy study along with their parents gave written informed consent and – where appropriate – informed assent. Recruitment was completed when the target sample size for each season was achieved. Advice on vitamin D supplementation was not provided before sample collection. Ethical approval for secondary use of the anonymised control data for comparison with that of the cancer patients in this study, without the need for additional consent, was given by the South East Scotland Research Ethics Service. Control data were not matched for age, sex or BMI; however, samples were matched for synthesising (1 April–30 September) and non-synthesising periods (1 October–31 March) for comparative reasons.
Demographics and clinical parameters
Clinical data (diagnosis, treatment protocol and length of treatment) and demographic data (age, sex, ethnicity and socio-economic deprivation) were collected from medical notes. Treatment intensity was classified according to Kazak et al.( Reference Kazak, Hocking and Ittenbach 15 ). As a proxy marker for socio-economic deprivation of individuals, we used Standard Index of Multiple Deprivation( 16 ).
The paediatric cancer cohort was grouped according to the wider definition of solid tumours, haematological cancers, brain tumours and other associated diagnoses.
Data collection
Plasma 25(OH)D, PTH, Ca, phosphate and Mg concentrations were measured. Plasma 25(OH)D was analysed using liquid chromatography-tandem MS technique at the Royal Infirmary of Glasgow and PTH was analysed using the Immulite 2000 Intact PTH technique at the Royal Infirmary of Edinburgh. The immediate CV (%) for the assays were ≤8·9 and 5·7 %, respectively. Ca, phosphate and Mg were analysed using the Abbott Architect c8000 at RHSC.
Plasma 25(OH)D concentration was classified as synthesising (1 April–30 September) and non-synthesising periods (1 October–31 March). Plasma 25(OH)D status was defined according to the Royal College of Paediatrics and Child Health (RCPCH)( 2 ) as deficiency (<25 nmol/l), insufficiency (25–50 nmol/l), sufficiency (51–75 nmol/l), optimal (>75 nmol/l). Plasma 25(OH)D inadequacy was used when 25(OH)D concentration was <50 nmol/l. Plasma 25(OH)D toxicity was defined as >175 nmol/l (with associated symptoms) and the PTH reference as 1·7–7·5 pmol/l( 17 ).
Height (or length) and weight were measured using standard procedures. BMI centile was calculated and UK BMI growth centiles were used. Nutritional status was classified as underweight (BMI≤2·3th centile), healthy weight (BMI>2·3rd to <85th centile) and overweight (BMI≥85th centile)( Reference Cole, Freeman and Preece 18 ). Vitamin D intake was assessed using a 24 h multi-pass recall method( Reference Reilly, Montgomery and Jackson 19 ) to establish patterns of change in vitamin D throughout the study period. This was analysed in WinDiets® (Univation Ltd 2005) programme( Reference Wise 20 ). Any nutritional treatment and vitamin D supplementation was recorded. Nutritional treatment was prescribed according to subjective global assessment by the multi-disciplinary team and consisted of enteral±parenteral nutrition (macronutrient) and micronutrient (vitamin D according to UK RCPCH guidelines( 2 ) or multivitamins), and a combination of macronutrients and micronutrients.
This study was granted ethical approval from NHS Scotland (NHS REC 06-51104-52).
Statistical analyses
The Statistical Package for Social Science (version 19; IBM-SPSS for Windows Statistics) was used to analyse all data. Descriptive statistics were used to evaluate the prevalence of plasma 25(OH)D inadequacy. Comparisons between the paediatric cancer cohort and the healthy controls were performed using Mann–Whitney test; correlations between plasma 25(OH)D and the following variables – Ca, PTH, BMI centile and age – were performed using Spearman’s correlation. Univariate associations between demographic data and categorical variables were established by χ 2 test. P<0·05 was considered statistically significant. We followed the STROBE guidelines for the presentation of our data( Reference Vandenbroucke, von Elm and Altman 21 ). No a priori sample size estimation was performed for this pilot study in a regional cohort of paediatric cancer patients.
Results
Demographic and clinical characteristics
In all, thirty-three of thirty-five healthy controls and sixty-five of eighty-two paediatric cancer patients had plasma 25(OH)D samples available at baseline (Fig. 1). Of the healthy controls, two (6 %) samples were never returned because of laboratory issues. Demographic and clinical characteristics of the population are presented in Tables 1 and 2. Sex, ethnicity and socio-economic status, as well as age at diagnosis, did not statistically differ between groups. BMI centiles were significantly lower in the paediatric cancer cohort. A total of twenty-four treatment protocols were used to treat the paediatric cancer cohort, the median time follow-up was 312 (interquartile ranges (IQR) 123·5–653·2) d and 22 % (n 18) were classified as low risk, 37 % (n 30) as medium risk and 41·5 % (n 34) as high risk. The time between diagnosis and baseline measurements was 15·5 (IQR 10·0–25·0) d and between the start of cancer treatment and baseline measurements was 9·5 (IQR 6·0–19·5) d. All patients were receiving cancer treatment when plasma 25(OH)D samples were taken.
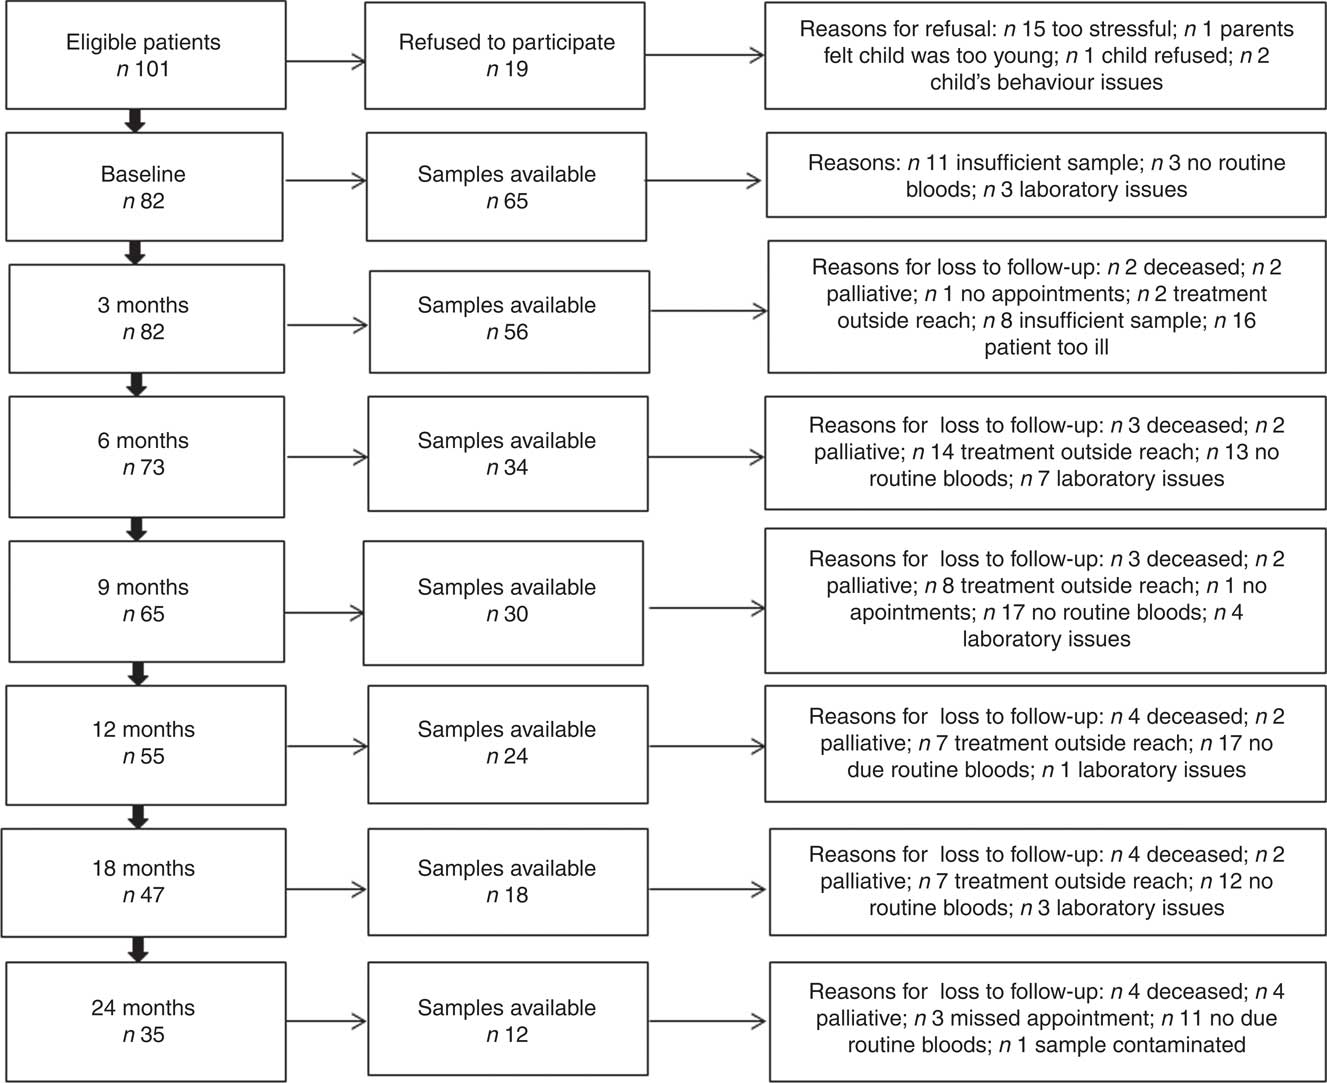
Fig. 1 Flow chart showing the sample size at different stages of the study period.
Table 1 Characteristics of the paediatric cancer population and the healthy controls (Medians and interquartile ranges (IQR); numbers and percentages)
SES, socio-economic status; ALL, acute lymphoblastic leukaemia; AML, acute myeloid leukaemia; CML, chronic myeloid leukaemia; HLH, hemophagocytic lymphohistiocytosis; LCH, Langerhans cell histiocytosis; CNS, central nervous system.
* Mann–Whitney test.
† χ 2 Test. SIMD: Standard Index of Multiple Deprivation presented as a quintile where ‘I’ denotes the most deprived and ‘V’ the least deprived.
Table 2 Plasma 25-hydroxyvitamin D (25(OH)D) concentration of the paediatric cancer cohort and the healthy controls at baseline (Median and interquartile ranges (IQR); numbers and percentages)
ST, solid tumours; HM, haematological malignancies; BT, brain tumours; OAD, other associated diagnoses.
* χ 2-Test.
† Fisher’s exact test; 25(OH)D reference ranges: deficiency <25 nmol/l, insufficiency 25–50 nmol/l, sufficiency 51–75 nmol/l, optimal >75 nmol/l, 25(OH)D inadequacy (<50 nmol/l).
Plasma 25-hydroxyvitamin D concentration
At baseline, of the eighty-two paediatric cancer patients, seventeen (21 %) did not have plasma 25(OH)D available because of clinical reasons (Fig. 1), thirty-four (41 %) were obtained during the synthesising period and thirty-one (38 %) during the non-synthesising period. There was no difference (U (453); P=0·3) between the synthesising (median 39·0, IQR 30·0–62·0) and non-synthesising period (median 36, IQR 16·0–61·0) in plasma 25(OH)D concentration in the cancer cohort at any time point, apart from the 3-month follow-up (Fig. 2). Of the thirty-five controls, nineteen (54 %) were obtained during the synthesising period and twelve (34 %) during the non-synthesising period. Plasma 25(OH)D (nmol/l) statistically differed (U (42·5); P=0·003) during the non-synthesising (median 26·0, IQR 18·0–46·5) and synthesising periods (median 56·5, IQR 45·5–78·0). Baseline plasma 25(OH)D of the cancer cohort did not differ from the healthy controls (P=0·7).
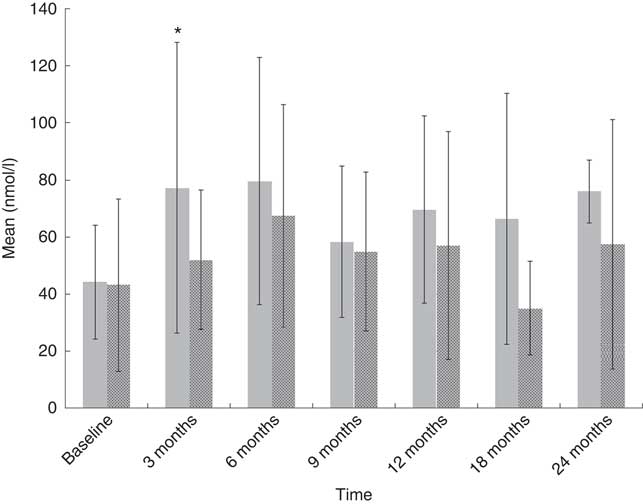
Fig. 2 Plasma 25-hydroxyvitamin D (25(OH)D) with data stratified according to seasonal variation. Values are means, with their standard deviations represented by vertical bars (* P<0·05), independent t test used to compare 25(OH)D concentration between synthesising (![]() , 1 April–30 September) and non-synthesising periods (
, 1 April–30 September) and non-synthesising periods (![]() , 1 October–31 March).
, 1 October–31 March).
At baseline, prevalence of plasma 25(OH)D inadequacy was 64 % (42/65) in cancer patients and 63 % (22/35) in healthy children. There was a higher prevalence of plasma 25(OH)D deficiency in paediatric cancer patients (n 19; 29 %) in comparison with healthy children (n 8; 22 %), but this was not statistically significant (P=0·2; χ 2 test). In the cancer cohort, prevalence of plasma 25(OH)D inadequacy ranged between 33 and 50 % throughout the study period (Fig. 3). Patients with solid tumours had the highest prevalence of 25(OH)D inadequacy (34 %) followed by haematological malignancies (26 %) at both baseline (Table 2) and at all time points (online Supplementary Table S1). At baseline, of thirty-two solid tumour patients 37·5 % (n 12) were deficient and 31·2 % (n 10) were insufficient and of twenty-six haemalogical malignancy patients 19·2 % (n 5) were deficient and 46·1 % (n 12) were insufficient (Table 2).
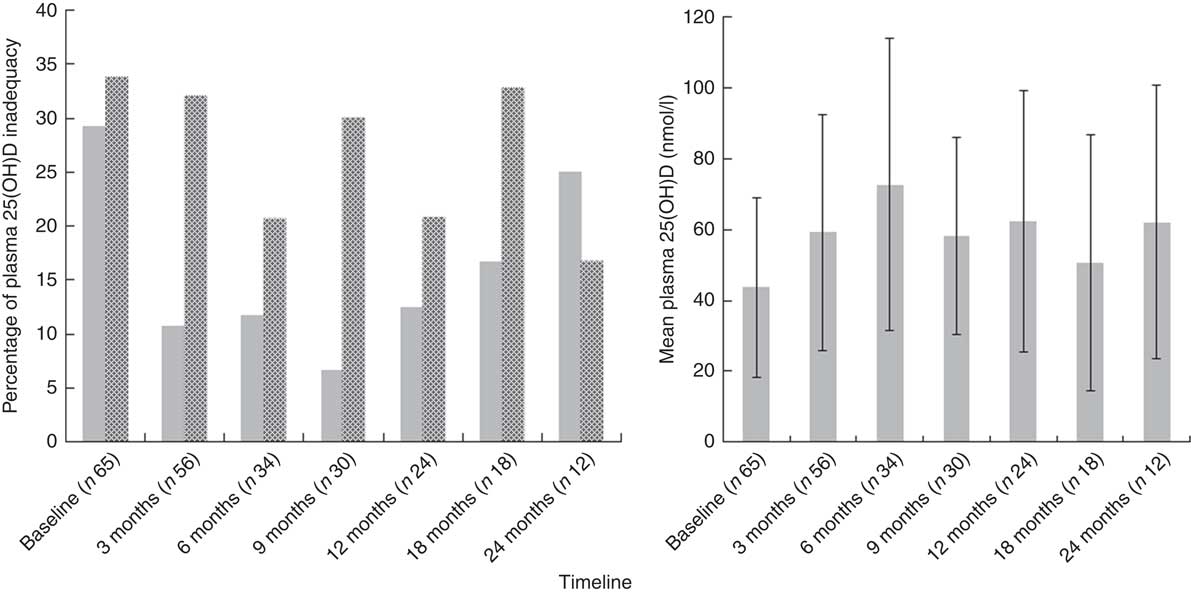
Fig. 3 Plasma 25-hydroxyvitamin D (25(OH)D) concentration (![]() , deficiency<25 nmol/l, left) and prevalence of 25(OH)D deficiency and insufficiency (
, deficiency<25 nmol/l, left) and prevalence of 25(OH)D deficiency and insufficiency (![]() , insufficiency 25–50 nmol/l, right) at different stages of the study period. Values are means, with their standard deviations represented by vertical bars (left).
, insufficiency 25–50 nmol/l, right) at different stages of the study period. Values are means, with their standard deviations represented by vertical bars (left).
Nutritional support was prescribed to 26 % (21/82) of paediatric cancer patients at baseline, of which 14/82 (17 %) were on macronutrients (enteral±parenteral nutrition) and 7/82 (8 %) were on both macronutrients (enteral±parenteral nutrition) and micronutrients. The median time between the start of nutritional support and baseline was 8 (IQR 0–23) d. In all, 80 % (66/82) of cancer patients received vitamin D from one or more forms of nutritional support for several days or weeks during the study period. Of these, 39/82 received macronutrient supplementation providing 292 (IQR 128–332) IU/d, 48/82 (58 %) received both micronutrient and macronutrient supplementation providing 464 (IQR 440–664) IU/d and 21/82 (26 %) received macronutrient only and micronutrient (±macronutrient) supplementation. The vitamin D intake from diet alone was 68 (IQR 24–76) IU/d and supplementation of vitamin D ranged from 400 IU/d to 20 000 IU single dose of vitamin D during the study period.
Paediatric cancer patients who were not supplemented had the lowest plasma 25(OH)D. The prevalence of plasma 25(OH)D inadequacy stratified by nutritional support and stages of disease is presented in Table 3. This was highest in children who did not receive supplementation ranging from 32·0 (IQR 21·0–46·5) nmol/l at 18 months to 45·0 (IQR 28·0–64·5) nmol/l at 24 months. In contrast, paediatric cancer patients supplemented with micronutrients (±macronutrient) had the lowest prevalence of plasma 25(OH)D inadequacy and the highest plasma 25(OH)D at most stages ranging from 78·0 (IQR 49·2–134·5) nmol/l at 6 months to 82·0 (IQR 57·0–128·5) nmol/l at 12 months. This was followed by children supplemented with macronutrients only, which ranged from 43·0 (29·2–75·7) nmol/l at baseline to 79·0 (IQR 49·0–93·0) nmol/l at 6 months. A considerable number of patients in the macronutrient subgroup had already received micronutrient supplementation. Of the seven patients who were on macronutrient support at 6 months, all of them had received micronutrient supplementation previously. Similarly, 2/5 (40 %) patients on macronutrient support at 12 months and 1/2 (50 %) patients at 18 months had received micronutrient supplementation in the previous follow-up. Moreover, micronutrient supplementation was significantly associated with a lower prevalence of plasma 25(OH)D inadequacy (Fisher’s exact test; P=0·04; relative risk 0·27; 95 % CI 0·04, 1·8) at 6 months. Three patients reached plasma 25(OH)D concentration of >175 nmol/l( 17 ) following a single high dose (20 000 IU/d) of vitamin D.
Table 3 Prevalence of plasma 25-hydroxyvitamin D (25(OH)D) inadequacy with data stratified by nutritional support and at different stages of the disease† (Numbers and percentages; medians and interquartile ranges (IQR))
OAD, other associated diagnoses.
† 25(OH)D reference ranges: deficiency <25 nmol/l, insufficiency 25–50 nmol/l, sufficiency 51–75 nmol/l, optimal >75 nmol/l, 25(OH)D inadequacy (<50 nmol/l).
Plasma 25(OH)D did not correlate with plasma Ca, phosphate, Mg and PTH at any stage in the cancer cohort; however, PTH and plasma 25(OH)D concentration correlated in the healthy controls (r 0·6; P<0·001).
Factors contributing to 25-hydroxyvitamin D inadequacy concentration at baseline and at 3 and 6 months of treatment
Age negatively correlated with plasma 25(OH)D concentration in paediatric cancer patients (r −0·46; P<0·001), only at baseline, and in healthy children (r −0·42; P<0·02), whereby older children had lower plasma 25(OH)D concentration. Although BMI centile was not significantly correlated with plasma 25(OH)D concentration in the paediatric cancer cohort at baseline (r −0·2; P=0·08), 3 months (r −0·2; P=0·2) and 6 months (r −0·2; P=0·3), and in the healthy controls (r −0·3; P=0·3), overnourished paediatric cancer patients were more likely to have higher prevalence of plasma 25(OH)D inadequacy (χ 2 test (8·3); df (1); P=0·005; relative risk 3·1; 95 % CI 1·4, 14·0) at 3 months than healthy and undernourished children with cancer, regardless of whether the patients were on nutritional supplementation. Non-supplemented children were more likely to have inadequate plasma 25(OH)D concentration (relative risk 4·3; 95 % CI 1·1, 4·7) at 6 months (Fisher’s exact test; P=0·04) compared with those supplemented with micronutrients.
None of the following categorical variables were significantly associated with plasma 25(OH)D status and paediatric cancer patients at any stage: treatment risk, diagnostic criteria, ethnicity and sex.
Discussion
This is the first study investigating plasma 25(OH)D concentration at diagnosis and during treatment in paediatric cancer patients from Scotland. Our results show a high prevalence of plasma 25(OH)D inadequacy during the study period. Plasma 25(OH)D concentration in paediatric cancer patients and age-matched healthy controls were similar; however, our paediatric cancer cohort showed no seasonal variation. Children diagnosed with solid tumours exhibited the lowest plasma 25(OH)D concentration and the only effective method to achieve optimal plasma 25(OH)D concentration was by supplementing with vitamin D. Only three factors, and each at 1 time point only, contributed to plasma 25(OH)D inadequacy: older age was the only factor at baseline, overnutrition at 3 months and not being supplemented at 6 months during treatment.
Prevalence of plasma 25-hydroxyvitamin D
In contrast to North England( Reference Sinha, Avery and Turner 22 ) but in agreement with a recent Scottish small study( Reference Paciarotti, Revuelta Iniesta and McKenzie 23 ), our study shows that plasma 25(OH)D concentration in newly diagnosed paediatric cancer patients and healthy children were comparable, suggesting that patients from Scotland are not at a higher risk of plasma 25(OH)D inadequacy than healthy children at diagnosis. However, these concentrations are lower than those reported in paediatric cancer patients from Europe( Reference Revuelta Iniesta, Rush and Paciarotti 6 ). Of note, 11 % of paediatric cancer patients were on vitamin D supplementation at baseline, which may have contributed to higher plasma 25(OH)D concentration at this stage. In addition, there was a higher representation of winter samples in the healthy controls than the paediatric cancer cohort (30 v. 43 %), which might have contributed to the unexpectedly higher prevalence of vitamin D inadequacy in the healthy controls.
Optimal plasma 25(OH)D in children is essential to allow optimal growth, Ca homoeostasis and skeletal development( Reference Holick, Binkley and Bischoff-Ferrari 3 ). Children treated for cancer may have impaired growth velocity during treatment( Reference Revuelta Iniesta, Paciarotti and Brougham 24 ), which can also be exacerbated by vitamin D inadequacy. Current UK guidelines on vitamin D are aimed at healthy children and stipulate that children under 5 years of age should be supplemented with 7·5–10 µg/d (300–400 IU) of vitamin D( 2 ). We have clearly established that most cancer patients who were not supplemented were either deficient or insufficient, or eventually became deficient, as shown by the high prevalence of plasma 25(OH)D inadequacy (33–50 %). Furthermore, macronutrient supplementation alone prevented plasma 25(OH)D inadequacy, but patients rarely reached optimal concentration, suggesting that macronutrient supplementation, which is fortified with vitamin D, does not meet the requirements for vitamin D in this population. Finally, vitamin D supplementation taken in the form of multivitamins or as therapeutic supplementation was essential to achieve optimal 25(OH)D concentration in all paediatric cancer patients. Remarkably, we found that older children were at a higher risk of plasma 25(OH)D inadequacy at baseline and therefore would also require supplementation, which is not stipulated in the RCPCH guidelines( 2 ). However, it is important to note that three patients on single high-dose (20 000 IU) vitamin D supplementation reached 25(OH)D>175 nmol/l concentration( 17 ). Therefore, we recommend vitamin D supplementation for all paediatric cancer patients, but emphasise the need for close monitoring to avoid potential toxicity.
Unlike healthy children, our paediatric cancer cohort did not show any seasonal variation in plasma 25(OH)D concentration. These findings are supported by a study performed in survivors of childhood cancer from the USA (latitude 34°N)( Reference Sala, Pencharz and Barr 25 ) but contrasts with two studies( Reference Sinha, Avery and Turner 22 , Reference Modan-Moses, Pinhas-Hamiel and Munitz-Shenkar 26 ): one performed in North England (latitude 54·9°N) during and after therapy( Reference Sinha, Avery and Turner 22 ) and the other performed in Israel (latitude 31°N) in paediatric cancer patients during therapy( Reference Modan-Moses, Pinhas-Hamiel and Munitz-Shenkar 26 ). Therefore, we hypothesise that Scottish paediatric cancer patients are not exposed to enough sunlight during the summer months, probably becase of the multiple treatment side effects( Reference Revuelta Iniesta, Paciarotti and Brougham 24 , Reference Sala, Pencharz and Barr 25 ), and that diet alone is insufficient to replenish plasma 25(OH)D stores.
Stratification of the data by diagnosis revealed results consistent with a recent systematic review( Reference Revuelta Iniesta, Rush and Paciarotti 6 ) and a large study (n 2198) performed in the adult oncology population from USA. Patients diagnosed with solid tumours had prevalence of plasma 25(OH)D inadequacy of 71 and 75 %, respectively; our study showed that children diagnosed with solid tumours exhibited the highest prevalence of plasma 25(OH)D inadequacy (69 %; deficiency 37·5 % and insufficiency 31·2 %) at diagnosis. However, our study also showed high prevalence of plasma 25(OH)D inadequacy in the haematological malignancy group (65 %; deficiency 19·2 % and insufficiency 46·1 %) at diagnosis, which contrasts with findings from elsewhere( Reference Revuelta Iniesta, Rush and Paciarotti 6 , Reference Sala, Pencharz and Barr 25 ). Although others have reported similar prevalence of vitamin D inadequacy in Canadian children diagnosed with haematological malignancies( Reference Atkinson, Halton and Bradley 27 , Reference Halton, Atkinson and Fraher 28 ), the measured vitamin D was 1,25-dihydroxyvitamin D (1,25(OH)2D), which is not equivalent to plasma 25(OH)D. Despite supplementation with macronutrients and micronutrients, prevalence of 25(OH)D inadequacy remained high during treatment for solid tumours and haematological malignancies, highlighting the need for more rigorous monitoring at all stages.
In line with recent evidence( Reference Revuelta Iniesta, Rush and Paciarotti 6 , Reference Sinha, Avery and Turner 22 ), our study found a relationship between PTH and plasma 25(OH)D in healthy controls, but not in paediatric cancer patients. Although in health PTH measured alongside plasma 25(OH)D is considered the most sensitive physiological measure of plasma 25(OH)D status and bone homoeostasis( Reference Holick 29 ), our study suggests that there might be other factors influencing their relationship. We were unable to investigate this because of the relatively small sample; however, it has been attributed to the type of cancer and the different treatments, including chemotherapy and corticosteroids, which can lead to nephrotoxicity and hepatotoxicity, in turn interfering with the 25(OH)D, 1,25(OH)2D and PTH metabolism( Reference Zhou, Assem and Tay 10 , Reference Atkinson 30 ). Furthermore, a stronger relationship between plasma PTH and 25(OH)D develops with age( Reference Greer 31 ), which might have affected our results, as the controls were slightly older.
Factors contributing to reduced plasma 25-hydroxyvitamin D concentration at baseline and at 3 and 6 months
Consistent with a meta-analysis( Reference Revuelta Iniesta, Rush and Paciarotti 6 ), older age was associated with reduced plasma 25(OH)D concentration in paediatric cancer patients at baseline. This association was also found in our healthy controls, in line with a study performed in healthy children from the USA( Reference Kumar, Muntner and Kaskel 32 ), which could reflect the widespread issue of vitamin D. Teenagers tend to eat less vitamin-D-rich foods, especially fortified foods, and spend less time playing outdoors than younger children( Reference Rosen, Beebe and Shaibi 33 ). In addition, the high levels of vitamin D inadequacy during treatment could have been attributed to the fact that patients were supplemented with a very low dose of vitamin D (440–664 IU). A higher dose of 600 IU is recommended for all paediatric patients (including infants), whereas therapeutic doses are age dependent and all doses are over 1000 IU/d( Reference Holick, Binkley and Bischoff-Ferrari 3 , 17 ). Alongside infancy, puberty is accompanied by a rapid period of growth, and appropriate plasma 25(OH)D concentration is essential to allow for optimal growth( Reference Tanner 34 ); thus, this population should be targeted and appropriate doses should be prescribed to all patients.
In contrast with other studies investigating factors contributing to plasma 25(OH)D inadequacy in paediatric cancer patients( Reference Paciarotti, Revuelta Iniesta and McKenzie 23 , Reference Modan-Moses, Pinhas-Hamiel and Munitz-Shenkar 26 ), our results showed that( Reference Modan-Moses, Pinhas-Hamiel and Munitz-Shenkar 7 ) like healthy individuals, overnourished children maybe more likely to have plasma 25(OH)D inadequacy following 3 months of treatment, and this was regardless of nutritional support. An inverse relationship between high BMI and plasma 25(OH)D in the healthy population is well established( Reference Holick 7 ), which has been attributed to a reduction in plasma 25(OH)D availability due to the sequestration of vitamin D by adipose tissue( Reference Wortsman, Matsuoka and Chen 35 ). Overweight children require higher doses of chemotherapy and glucocorticoids than normal-weight or undernourished children. In addition, cancer treatments tend to be most intense during the first 3–6 months post diagnosis. Chemotherapy agents commonly used in cancer treatment can cause hepatotoxicity and nephrotoxicity and thus inhibit the activation of vitamin D( Reference Atkinson, Halton and Bradley 27 ), whereas glucocorticoids stimulate vitamin D catabolism and can increase the risk of vitamin D deficiency( Reference Atkinson, Halton and Bradley 27 ). Therefore, higher doses of chemotherapy agents and glucocorticoids may explain this association between overnourished patients and lower 25(OH)D concentration
Limitations of the study and future research
The reduced sample size at later stages of the study precluded considering factors associated with plasma 25(OH)D at later stages of treatment. Some cancer patients were already on nutritional support at baseline, which could potentially have affected plasma 25(OH)D concentration. It should be noted that although age did not statistically differ between the controls and the cancer cohort, the controls were slightly older. In addition, the higher proportion of samples obtained from the non-synthesising period in the controls may have distorted the high plasma 25(OH)D inadequacy reported. Finally, there were only two non-Caucasian patients (dark skin) in both groups, which could explain why lower plasma 25(OH)D concentration was not associated with ethnicity. Future research should include large multicentre epidemiological studies that are better able to identify factors contributing to plasma 25(OH)D inadequacy in the different types of cancer during treatment, as well as randomised controlled trials in which the effects of vitamin D supplementation on clinical outcome, particularly bone mass density, are warranted.
Conclusion
We have highlighted that Scottish paediatric cancer patients have a high prevalence of plasma 25(OH)D inadequacy at diagnosis and during treatment and that older age, not being supplemented and possibly being overnourished potentially contribute to inadequacy. Importantly, we recommend vitamin D supplementation to all paediatric cancer patients given that macronutrient supplementation alone prevented further 25(OH)D inadequacy, but rarely produced optimal concentration, and high longitudinal inadequacy rates continued throughout the study.
Acknowledgements
The authors thank Prof. Hamish Wallace, Prof. Angela Thomas, Dr Angela Edgar, Lindsay Archibald, Alison Gillies and Elaine Lawrie for their valuable input to the study, and Kerry White for ongoing support. The authors also wish to express their most sincere appreciation to the parents and children who took the time to participate in the research project.
This study was funded by the following funding bodies: Fergus Maclay Leukaemia Trust (a registered Scottish charity), Queen Margaret University, Cancer and Leukaemia Fund (Royal Hospital for Sick Children) and the GI-Nutrition Research fund of Child Life and Health, University of Edinburgh. The controls were funded by the Roald Dahl Marvellous Children’s Charity and the Burdett Trust to carry out the study on vitamin D in children with epilepsy – ‘Bone and brains’.
R. R. I. designed the study, collected the data from the paediatric cancer cohort, analysed the data, drafted the manuscripts and provided final approval of the manuscript; I. P. collected the data from the paediatric cancer cohort, and provided critical feedback and final approval of the manuscript; I. D. supervised the study, and provided critical feedback and final approval of the manuscript; J. M. supervised the study, and provided critical feedback and final approval of the manuscript; C. B. collected the data from the control cohort, and provided critical feedback and final approval; R. C. supervised the data collection from the controls, and provided critical feedback and final approval of the manuscript; M. B. supervised the study and data collection from the cohort, and provided critical feedback and final approval of the manuscript; D. W. designed, coordinated and supervised the study, and provided critical feedback and final approval of the manuscript.
The authors have no conflicts of interest relevant to this article to disclose.
Supplementary Material
For supplementary material/s referred to in this article, please visit https://doi.org/10.1017/S0007114516004074


 Open access