

1. Summary of Paper and Conclusions of the Working Party
1.1. Solvency II
Solvency II has been under consideration and development since the early 2000s. The previous regime, in force since the 1970s (which had come to be known as Solvency I), was not risk-sensitive and a number of key risks, including market, credit and operational risks, were not explicitly taken into account in capital requirements. Furthermore, Solvency I permitted the continuation of different methodologies in different EU countries, e.g., either book or market value of either assets or liabilities, depending on country.
The lack of risk sensitivity introduced problems ranging from inaccurate assessment of risks requiring supervisory intervention to a sub-optimal allocation of capital relative to the risks being borne. The Solvency II framework proposed to remedy these shortcomings of Solvency I.
Appendix 2 gives an overview of the evolution of Solvency II, including future plans, together with a summary of past and current issues.
1.2. The Working Party
In November 2015 our working party was established with the aim of producing a sessional paper to consider Solvency II’s objectives and assess the outcome of the final regulations against its key objectives which include:
-
∙ improved protection of policyholders and beneficiaries;
-
∙ harmonisation;
-
∙ effective risk management; and
-
∙ financial stability.
As part of that process, meetings were held in London and Edinburgh to gather views from the profession. A workshop was also held at the Institute and Faculty of Actuaries Life Conference in 2016 in which we shared an overview of Solvency II’s strengths and weaknesses and conducted a survey to seek the views of the attendees (see Appendix 1).
One of the outcomes of these meetings is a realisation that there is no single prevailing view within the profession. In a similar vein, where there is common acceptance of issues coming out of Solvency II there is no single answer to these – more a range of potential solutions.
This paper focusses on life insurance business. Non-life, health and reinsurance business have not been considered. This paper also focusses mainly on the UK, but aspects from other countries have been considered where possible.
One of the goals of the working party has been to inform the debate on Solvency II ahead of the 2017 review by the European Insurance and Occupational Pensions Authority (EIOPA) (see Appendix 2 section 2).
As at the end of 2015, insurers and reinsurers in the UK had invested £3bn in the Solvency II Directive, according to the Association of British Insurers (2015). Preparation and transition to the Directive has been a costly exercise with various delays introducing changes in the original rules. Whilst there are lessons to be learned from the way that Solvency II was introduced and the costs associated with it, our working party has chosen not to explore the process of implementation.
The investment has been made and we now have a regulatory regime that is appropriate for a modern insurance industry and current technology.
In the United Kingdom, Brexit has added a new dimension to the debate, causing the Treasury Select Committee (TSC) in the United Kingdom to look at European insurance regulation and to consult on its suitability for the United Kingdom. Our working party, along with the practice boards and other relevant working parties, had an input into the profession’s written response to the TSC’s consultation (Institute and Faculty of Actuaries (IFoA), 2016).
1.3. Efficiency and Competitiveness
Solvency II seeks to equalise the level of competitiveness and foster the development of an internal market across Europe. Consequently EIOPA has some regard to absolute competitiveness, although the outcome of Solvency II suggests that the latter appears to have been limited. As pointed out by the TSC, the Prudential Regulatory Authority (PRA) has within its primary objectives no remit in respect of competitiveness and questioned whether this was appropriate (Treasury Committee, 2017). This is relevant because there are a number of burdensome and costly aspects of Solvency II that can affect profitability, discourage new entrants and reduce the competitiveness of the industry.
For example, in respect of annuity business:
-
∙ Investment return opportunities are reduced through ineligibility of assets such as Equity Release Mortgages.
-
∙ The consequent need to package such assets to meet eligibility rules increases costs and absorbs resources.
-
∙ Tighter cash flow matching requirements than under Solvency I and other eligibility rules also increase costs.
-
∙ Restrictions on the trading of bonds reduce profitability.
The standard formula has deficiencies, which require firms to seek Internal Model Approval, and it is difficult to change, so it may inhibit innovation.
Approval processes – such as the internal model approval process (IMAP) and approval to use the matching adjustment (MA) – need to be made more efficient. Currently they are lengthy, costly and burdensome.
Furthermore, the current process to introduce changes to the internal model potentially inhibits innovation.
1.4. Market Consistent Valuation, Capital and Risk Margin
Solvency II is a comprehensive programme of regulatory requirements for insurers, covering authorisation, corporate governance, supervisory reporting, public disclosure, risk assessment and management, as well as solvency and reserving. It is one of, if not, the most sophisticated regulatory regimes in the world. As a consequence we cover these aspects in some detail in sections 2 and 3.
Solvency II’s foundation for the calculation of technical provisions and capital requirements is market consistency. Omnibus II recognised that for long-term guaranteed business a number of shortfalls and political concessions would be required to make Solvency II acceptable to the member states.
From a product perspective, annuity business is probably the most important long-term guaranteed business written in the United Kingdom. Here it was recognised that it was default risk rather than spread risk that was the principal credit risk and this was accommodated through a higher discount rate linked to the assets owned and lower capital requirements.
This clear break from market consistency now makes it possible to reduce technical provisions by taking on credit risk. It also means that a significant proportion of the UK’s long-term guaranteed business is still valued on a basis that has similarities with the Solvency I regime.
It raises the question as to whether market consistency is a useful tool to provide a general approach or whether it is an end in itself. There may be flaws in following a dogmatic market consistent approach but it is through market consistency that effective risk management is rewarded.
Its design moved us to a framework that has demanded a true best estimate of the liabilities with a requirement to hold enough capital for a 1 in 200 year worst-case outcome. The assumption is that recapitalisation, perhaps through acquisition, can be achieved with a 12-month timeframe. This can be viewed as a “going concern” basis rather than a “run-off” basis with prudent margins (Swain & Swallow, Reference Swain and Swallow2015).
For annuity business, the size and volatility of the risk margin has been thrown into the spotlight by the current low interest rate environment. This is giving rise to a number of issues and questions being raised around the rationale and logic of the risk margin along with potential solutions.
As with many other aspects of Solvency II that need revisiting, there are numerous solutions each of which warrant individual assessment before a single recommendation can be made. This is a role for more specialist working parties than our own. Indeed there are already working parties that have looked at, or are looking at, MAs and Transitional Measures for Technical Provisions.
1.5. Impact on Behaviour
Solvency II generally rewards the matching of assets and liabilities through a reduction in Solvency Capital Requirement (SCR), although there are exceptions, the most notable of which is the risk margin. This encourages insurers to assess which risks are rewarded and which are not. In turn this has an impact on behaviour, which we cover in section 4.
In the United Kingdom such a practice has been prevalent within with-profits funds since the realistic balance sheet was introduced in 2003. By contrast, e.g. for German insurers, there is a trend to extend the duration of their assets so as to reduce the interest rate risk. In practice, the trend in Germany has been gradual because of the transitional arrangements, the Ultimate Forward Rate (UFR) to some extent and the fact that the interest rate down shock in determining the SCR is small when rates are low.
For annuity business the MA eligibility rules have introduced a shift away from assets such as callable bonds to illiquid assets. To meet these rules, some previously favoured illiquid assets, such as equity release mortgages, have had to be securitised internally.
Even for unit-linked business moving away from matching the face value of units to one that is closer to the best estimate liability (BEL) reduces capital requirements.
One of the impacts of Solvency II though that raises some concern is that it increases pro-cyclicality. As markets fall or become more volatile insurers either have to find more capital or sell. There is a good argument for counter-cyclical buffers to dampen such effects and provide time for insurers to take a more considered response to changing market conditions.
Finally, there is also the impact on product design. A combination of capital requirements and low interest rates will increase the trend (already evident in the United Kingdom) away from traditional savings products with guarantees to unit-linked contracts.
Insurers that sell both savings and protection business can benefit from the diversification benefits of holding both insurance and market risk on their balance sheet.
1.6. Pillars 2 and 3: Own Risk and Solvency Assessment (ORSA), Liquidity and Disclosures
Most of the contentious issues have been around Pillar 1 and long-term guaranteed business. Solvency II though is also about embedding risk management and good governance within the Boards of insurance companies and clearly defining where their responsibility lies. We cover these aspects in section 5.
In this regard, much of Solvency II has the UK’s DNA throughout it. Pillar 2 aspects such as ORSA are similar to the Individual Capital Assessment (ICA) regime we knew before Solvency II. However, Pillar 2 has raised the bar considerably compared to the Solvency I regime.
Our view, and that of those voting at the Life Conference, was that Pillar 2 has been a major success of Solvency II adding to financial stability.
Pillar 3 has introduced greater transparency across Europe in terms of reporting and greater public disclosure. From a UK perspective though, there is a loss of some of the granularity of detail that we are used to seeing in the outgoing PRA returns. In that respect there is less transparency.
In the working party’s opinion, certain parts of the detailed reporting do not appear to justify the costs. The whole process of looking through to the layering of assets within funds requires huge amounts of processing with its associated costs and resourcing, without it being clear how the information benefits regulators or analysts.
1.7. Solvency II’s Performance Relative to its Objectives
Pulling together those aspects of Solvency II that the working party explored we have drawn our own conclusions as to how well Solvency II performed relative to its objectives of improved consumer protection, effective risk management, harmonisation and financial stability.
1.7.1. Improved protection of policyholders and beneficiaries
As we have discussed, the introduction of a market consistent approach has resulted in a regime that provides a more scientific approach of determining capital requirements. In addition, allocating more money to back insurance liabilities and their capital requirements has also enhanced policyholder protection.
During the oral evidence given by Andrew Chamberlain on behalf of the IFoA, the TSC made the point that, because the PRA has no primary responsibility in respect of competition, allocating more money to back insurance liabilities and their capital requirements is an easy way for regulators to improve policyholder protection.
In our working party we believe that the improved consumer protection objectives have been met although there was no prevailing view to that effect at the Life Conference workshop (see Figure 1).
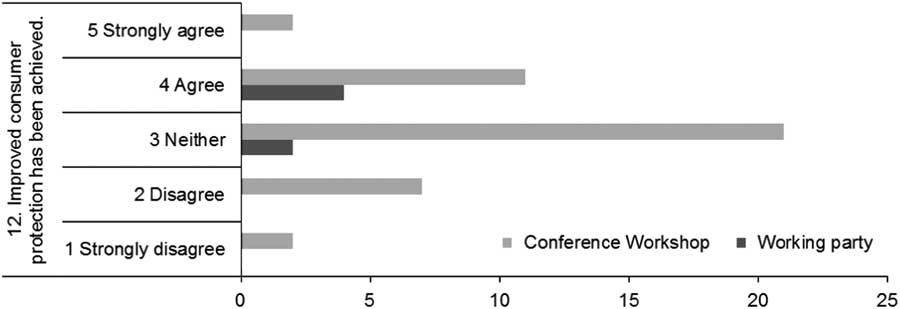
Figure 1 Improved customer protection has been achieved. Conference workshop: Votes 43, average 3.1, SD 0.9.
1.7.2. Effective risk management
The market consistent aspect of Solvency II provides a solid foundation upon which the capital requirements reflect the risks inherent within an insurance company or group.
Insurers are now rewarded for matching liabilities with corresponding assets where this is possible. Market consistency is being questioned in terms of its impact on financial stability and its relevance to long-term guaranteed business. However, it has a huge impact in encouraging effective risk management.
These incentives have been reduced by the extrapolation from a 20-year point to the UFR in respect of euro liabilities. Similarly, under the MA it is possible to improve a life insurer’s capital position by taking on credit risk. To ensure effective risk management it has been necessary to develop strict admissibility and cash flow matching rules.
Our working party’s view is that in general Solvency II has delivered a system that tends to encourage effective risk management. The views of those voting at the Life Conference was less emphatic where there were divergent views on how successful Solvency II has performed in this respect (see Figure 2).
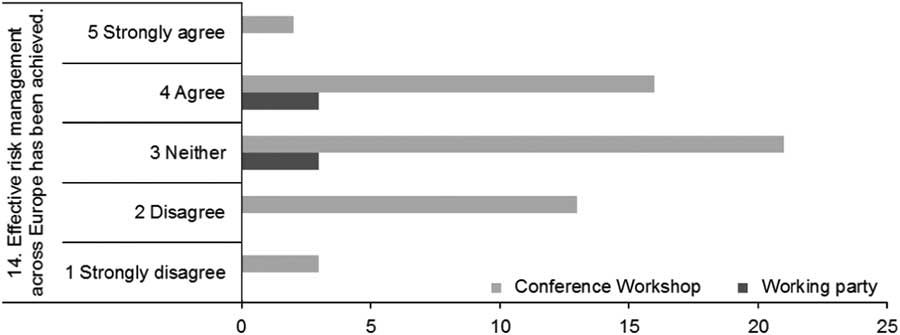
Figure 2 Effective risk management across Europe has been achieved. Conference workshop: Votes 55, average 3.0, SD 0.95.
1.7.3. Harmonisation
The detail of the regulation and the introduction of a common European regulator has resulted in a high degree of harmonisation on the face of it, but in section 6 we take a deeper look to reveal important areas in which harmonisation has not been achieved. Even reserving and capital requirements may differ significantly between insurers.
An insurer writing long-term traditional with-profits business in euro benefits from an extrapolation of the euro swap curve to the UFR from year 20. Whilst a UK insurer writing annuity business may, or may not, take advantage of the MA.
Nor, in this case, is the reporting similar. The impact of the MA is disclosed when reporting whilst the impact of the extrapolation to the UFR is not. Hence an analyst has additional information to form a view on the balance sheet strength of a UK annuity writer but does not necessarily have similar information regarding a continental with-profits office.
An insurer with an internal model might measure more risks than an insurer using the standard formula. Elsewhere aspects such as the volatility adjustment (VA) and the transitional measures are not applied uniformly.
That said, Solvency II has imposed a sophisticated, detailed and revolutionary set of rules across 28-member states and this feat is a major accomplishment.
Despite this, our view and that of our voting audience at the Life Conference was that Solvency II had failed to achieve harmonisation (see Figure 3).

Figure 3 Harmonisation across Europe has been achieved. Conference workshop: Votes 54, average 2.0, SD 0.85.
1.7.4. Financial stability
There is a concern around the pro-cyclical nature of market consistent approaches and questions are being asked about the going concern approach of Solvency II compared to the run-off approach of Solvency I.
Pro-cyclicality and financial stability are areas where we can inform the debate. Market consistency will tend to be pro-cyclical. If markets fall, it makes sense to hold capital against further falls. For insurers without enough spare capital this can result in insurers selling risky assets creating pro-cyclicality with potentially disastrous outcomes for financial institutions. The move to market consistency and the use of a 1-year Value at Risk (VaR) increases the risk of herd behaviour as, in the absence of capital, insurers would be required to de-risk within the same time frame as other institutions.
Markets though can over-react. Many are not deep and liquid. Insurers writing long tail business do not have immediate cash flows to pay. A capital regime that provides time for insurers to formulate a measured response would be desirable.
The symmetric adjustment for equities in the Standard Formula achieves this but its effectiveness is restricted by a maximum 10% reduction in the size of the standard equity stress.
It does, however, give time for markets to find their new level if they have over-reacted and for insurers to formulate their best response if they have not. Variations to this and applying it to other market risks such as spread risk could be one solution. Indeed there is a range of solutions that could be usefully assessed.
The concern around pro-cyclicality is such that our working party is unanimous in its view that Solvency II has fallen short of its goal of aiding financial stability. The Life Conference voting pattern was similarly tight but with a stronger view that Solvency II had not met its objectives (see Figure 4).

Figure 4 Financial markets are more stable. Conference workshop: Votes 56, average 1.4, SD 0.55.
1.8. Impact of Brexit
Brexit could not be ignored and section 7 covers this. The working party feel that the United Kingdom should retain Solvency II as a framework but take advantage of our ability to adapt it to meet our needs. Without the need to reach agreement with 27 other member states the United Kingdom has greater scope to adapt Solvency II to address its shortcomings.
It is also worth bearing in mind that if the United Kingdom chooses to retain Solvency II then, with no voice, Solvency II could evolve in a way that does not suit the United Kingdom. As an example there is no great attachment to the MA in mainland Europe and the risk is that it could be removed. We should aim to avoid being locked into Solvency II where we have no say and where changes could go against the United Kingdom.
Passporting and equivalence through mutual recognition of the UK’s and EU’s regulatory system is a highly desirable goal. This is especially true for international nature of business carried out by Lloyds of London and in the London Market. For multi-national life companies it is perhaps less important given that the current norm is to operate through local legal entities.
If we change too much, passporting and equivalence could be at risk but it ought to be noted that these decisions are made at a political level. The United States of America enjoys equivalence (but not passporting) even with significant differences between our two regimes. As we have already noted harmonisation has not been achieved in respect of a German insurer writing long term with-profits business compared with that of a UK annuity writer.
The EIOPA review for Europe as a whole and Brexit for the United Kingdom may permit streamlining and simplifying of systems and processes that could make our industry more flexible and potentially more competitive. It is hoped that this paper and the transcripts of the discussion will help inform that debate.
1.9. Closing Comments
As EIOPA and the TSC review Solvency II and look to the future evolution of the regime, the working party hopes that this paper will represent a good overview of the effectiveness of Solvency II. We have been pleased to input into the IFoA’s response to the TSC consultation. We also hope that this paper, along with the discussion, will represent an enduring retrospective on the initial introduction of Solvency II and the lessons that can be learned from it. There are a number of areas where more research could be conducted – the issues around discounting, the merits of the various alternatives to the calculation of the risk margin, the implications of counter-cyclical buffers for a range of market risks. We look forward to the profession continuing to make a contribution in areas such as these.
2. Market Consistent Valuation
2.1. Market Consistency
A market consistent value is often associated with fair value and should be rational and unbiased. Kemp (Reference Kemp2009) defines the market consistent value of an asset or liability to mean:
-
a) its market value, if it is readily traded on a market at the point in time that the valuation is struck; or
-
b) a reasoned best estimate of what its market value would have been had such a market then existed, in all other situations.
Market consistent valuation frameworks rely on financial instruments traded in deep and liquid markets where cash flows can be used to create a replicating portfolio, or market observables can be used as inputs to models.
Solvency II started with the intention of being market consistent. However, throughout the implementation process numerous compromises have been made, and with each compromise it moves a little further away from true market consistency. Some deviations were more justifiable than others as it has been argued that “full” market consistency may be too harsh or not suitable for long-term liabilities. However “partial” market consistency impacts the potential to hedge liabilities. While some of the measures have more theoretical justification, others have been political compromises amongst EU members to ensure the sustainability of long-term business in certain markets.
Another view is that over and above the theoretical benefits of market consistency, Solvency II also wishes to harmonise valuation methodologies across the EU with minimal scope for subjectivity. A market consistent valuation framework is one way to achieve this. In effect, deviations discussed in this section relating to market consistency may also be moves away from harmonisation.
The main areas of concern are the UFR, MA, VA and transitional measures. These all formed a part of the long-term guarantees (LTG) package, with the aim to eliminate “artificial” volatility from the balance sheet of insurers, but also moves Solvency II away from “full” market consistency. In this section, we will discuss the UFR, MA and VA as these are focussed on short-term market fluctuations; in addition, topics such as the extended recoverability period and symmetric adjustment will be touched upon but not explored in detail here.
The transitional measures described in section 2.3 are also a significant deviation from market consistency as they smooth the transition between Solvency I and Solvency II reserves on the in-force business of insurers without taking the full impact of Solvency II from the implementation date.
2.1.1. UFR
The risk-free yield curve is based on interest rates swaps observed in deep, liquid and transparent markets; where swaps are not available government bonds are used. However, for long-term liabilities where liquid financial instruments are not available, the curve is extrapolated from a stipulated Last Liquid Point (LLP) to the UFR, which is provided by EIOPA.
For the euro the LLP is year 20 and the extrapolated curve converges to the UFR of 4.2% over a period of 40 years. Anecdotally the 20 year LLP seems to be a political compromise between the European countries. However, in the current low interest rate environment EIOPA has already suggested a lower UFR in just over 1 year into Solvency II. Their suggestion is that, for the euro in 2018, the “calculated UFR” is 3.65% (as opposed to the current 4.2%) and that after applying a maximum year on year change of 15 basis points the “applicable UFR” will be 4.05% (EIOPA, 2017)
With interest rates at unprecedented low levels, many question the suitability of the UFR. There are debates around this area with insurers and regulators alike trying to gauge what the “right” value should be.
The emergence of negative interest rates in countries such as Switzerland and Germany show more acutely the issues surrounding a fixed UFR set before the current low interest rate environment. In general, negative interest rates challenge current economic theory and the calibration of solvency models across a broad spectrum of financial institutions.
Some countries, such as Germany, are more dependent on the value of the UFR than others, due to the nature of the business sold; while other countries, such as the United Kingdom, rely on measures such as the MA. These valuation tools are a part of the LTG package, countries which may object to the UFR but rely on other aspects of the LTG package, are less likely to challenge it.
The UFR is less of an issue in countries where swap markets are deemed to be deep and liquid out to very long maturities.
2.1.2. MA
The MA is a flat addition to the risk-free yield curve, and can be applied to portfolios where the liabilities are fixed cash flows and the assets backing them can be separately identified, organised and managed from the rest of the business activities of the insurer.
MA is based on the portfolio of the insurer, and is essentially a proxy for the illiquidity premium on the assets held to back the liabilities.
As at 1 January 2016, according to data published by EIOPA (2016a), the MA was being used by insurers in Spain (15 insurers) and the UK (23 insurers) with two further national supervisors indicating that it may be used in the future, particularly in respect of new business. The data shows that removing the MA would reduce the SCR ratio by an average of 65% in the United Kingdom and 50% in Spain.
In the United Kingdom it is applied to annuities, however, it might be considered unfair to single out annuities for preferential treatment. That it is restricted to annuities reflects the fact that this was part of the compromise measures agreed as part of Omnibus II.
Basing the value of a fixed cash flow liability on the assets backing it and recognising on day 1 the unearned illiquidity premium is clearly not market consistent. Indeed it is very similar to the Solvency I discount rate used in the United Kingdom but without a prudent margin in the fundamental spread.
This impact can be to reduce the technical provisions at an undertaking level by up to circa 10%, compared to not using the MA, according to data published by EIOPA (2016a).
Investing in this way creates a capital requirement for spread risk although the spread risk has been reduced to capture the fact that the portfolio is exposed to default rather than spread risk. According to data published by EIOPA (2016a), the impact at insurer level can be to reduce the SCR up to a half, although for other insurers it can result in a small increase.
It is possible that this capital requirement can be more than covered by the benefit of the lower BEL coming from the higher discount rate. This appears counter-intuitive as it is the exact opposite of rewarding effective risk management, as it is hard to imagine that the additional yield comes without additional risk other than illiquidity risk.
There are stipulations in the derivation of the fundamental spread on government and non-government exposures; it is also adjusted so that the MA on non-investment grade assets does not exceed that calculated for investment grade assets. Hence additional capital is required when a BBB-rated bond downgrades to BB-rated.
The MA can become negative when spreads are very tight, although it is usually higher than the VA.
The eligibility criteria for the MA are set out in Appendix 5.
In order to use the MA, insurers need to apply for it from their national regulator; however, once approved the insurer cannot choose not to apply it. If the insurer cannot comply with the eligibility criteria or is not able to restore eligibility status, it will be banned from using MA for a period of 2 years. These rules appear to be a deterrent from applying the MA in the first place and also introduce a new risk in respect of the loss of the MA. It is not clear what other benefit this rule serves for the protection of policyholders.
The consequence of a departure from a market consistent framework is the ability to arbitrage rule inconsistencies.
Assets such as equity release mortgages do not meet the rules and can no longer be held directly within MA portfolios. However, many companies have created special legal entities to meet the eligibility criteria. Special purpose vehicles (SPVs) have been used for cash flows from equity release products, commercial real estate mortgages and infrastructure finance (Rule, Reference Rule2017). In these SPVs securitisation techniques such as credit enhancement features and liquidity facilities are used so as to allow them to issue eligible senior tranches.
Liabilities such as Periodic Payment Order (PPO) annuity payments can, at least in theory, be reinsured on a Retail Price Index basis into a MA compliant portfolio as a means to derive some benefit from the MA.
Arbitrage opportunities such as this have created the growth of an “industry” in structuring portfolios to make them eligible. These increase the cost base of insurers, increase operational risk and add to the complexity of an insurer’s balance sheet.
Finally, the SCR is calculated separately for different MA portfolios and cannot be diversified with the rest of the insurer’s business activities, or between MA portfolios. Therefore, the more MA portfolios, the less diversification benefit that can be taken into account. However, MA can be taken into account for the calculation of the SCR for spread risk, and hence can decrease the SCR. It significantly reduces SCR volatility too.
2.1.3. VA
The VA is a constant addition to the liquid part of the risk-free yield curve, therefore the spread is only applied up until the LLP for each currency and thereafter the adjusted yield curve is extrapolated to the UFR should it also be applicable.
It aims to protect insurers with long-term liabilities from short-term volatility in the market. VA is the spread between the interest rate of the assets in the reference portfolio and the corresponding risk-free rate for each currency, minus the fundamental spread – a haircut for default and downgrade on the qualifying assets. If the market spreads are very wide in a specific country, a country spread can be added to the currency spread.
The reference portfolio is determined by EIOPA and includes assets typically held by insurers to cover their liabilities (BEL).
Unlike MA, VA can be used in conjunction with transitional measures on risk-free rates, and if the VA is used MA cannot be applied. However, in the standard formula it does not respond to SCR shocks for spread risk.
The use of VA should be allowed by national supervisors, but some countries may have an approval process.
As at 1 January 2016, according to data published by EIOPA (2016a), VA was being used by 852 undertakings in 23 countries, the largest take-ups are in France with 217 undertakings. The technical provisions of the French undertakings applying the VA represent 18.1% of the total technical provisions in the European Economic Area (EEA); this is followed by Germany at 10.1% and the United Kingdom at 9.2% and are mainly for the life businesses.
The data show that removing the VA would reduce the SCR ratio by an average of 34% at the EEA level, with the biggest impact in Denmark and Germany at 91% and 85%, respectively; as compared to the United Kingdom where it is only 6%, therefore at the EEA level it is fairly significant especially for certain countries such as Germany.
2.1.4. General
MA and VA are utilised by different insurers in different countries. Where approvals need to be obtained, processes may not be equally stringent therefore creating an uneven playing field. This reduces the harmonising effects of Solvency II, which is one of the objectives mentioned in section 1.2.
The various adjustments to the risk-free discount rate raise the question of whether it is too conservative for the insurance industry with long-term liabilities. Where specific adjustments were designed for specific products, such as the MA, there could be a case for unification by establishing a fairer adjustment across the whole yield curve and across all products.
This suggests that there is a case, if not for entity specific discount rates, then a discount rate that reflects a good investment grade entity where insolvency can be entertained – AA or A rated discount curves.
The fact that the standard formula treats sovereign bonds in the domestic currency in all member states as risk-free (as stated in section 3.1.6.6) raises questions as not all countries issue bonds of equal credit quality; spreads in certain countries trade at significant spreads above German government bonds. Further, certain supranational, regional and local authority bonds get a similar treatment, irrespective of financial health although there are requirements they need to meet, e.g., around tax raising powers to provide consistency with sovereigns (Solvency II Wire, 2016a).
Solvency II equivalence for other non-Solvency II countries, e.g.: the United States, Bermuda and Japan also introduce non-market consistent valuation methodologies and reduce the impact of harmonisation for insurers across countries outside of the EU. There is already emergence of evidence which show insurers in Solvency II countries reinsuring longevity risk to regions outside of the EU where solvency requirements are not as stringent (Bulley, Reference Bulley2016).
2.1.5. Findings on market consistency
Our survey at last year’s Life Conference in Edinburgh asked whether aspects of Solvency II that were not market consistent should be removed.
Figure 5 shows that most participants were in favour of the deviations from market consistency, and within the working party we have a difference of opinion on the subject.
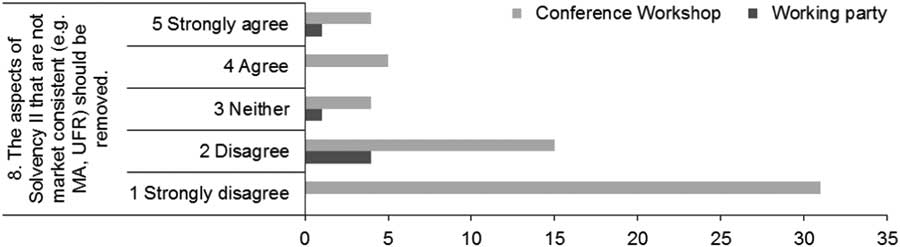
Figure 5 The aspects of Solvency II that are not market consistent (e.g. matching adjustment (MA), Ultimate Forward Rate (UFR)) should be removed. Conference workshop: Votes 59, average 1.9, SD 1.25.
There may be flaws in following a market consistent approach but in the working party’s view it is through market consistency that effective risk management is rewarded.
In the United Kingdom, annuity business is the most important long-term guaranteed business written, and it has been recognised that default risk rather than spread risk was key and this was accommodated through a higher discount rate linked to the assets’ owned and lower capital requirements.
The front-ending of the illiquidity premium on the assets held by the insurer is a deviation from market consistency, which means that a significant proportion of the UK’s long-term guaranteed business is still regulated on a basis that is close to the Solvency I regime. To ensure effective risk management for MA business it has been necessary to develop strict admissibility and cash flow matching rules, which comes with issues of its own in terms of creating additional costs and complexity.
Further, the impact of market consistency on financial stability has come into question and the effect on long-term guaranteed business. However, overall, it has made significant improvements in encouraging effective risk management in Europe.
2.2. Risk Margin
2.2.1. Cost of capital approach
Under Solvency II, the technical provisions are defined as the sum of the BEL and risk margin.
The risk margin is intended to represent the amount another insurer would require to take on the obligations of the insurer. It is calculated using a cost of capital approach; the insurer must project its SCR in respect of non-hedgeable risks, and apply a prescribed cost of capital charge of 6% p.a. This charge is then discounted at the risk-free rate to determine the risk margin.
The risk margin is relatively large for insurers with significant non-hedgeable risks, and particularly for those that have a long duration, such as longevity.
The underlying concept is that the notional transfer of technical provisions to another insurer would enable that insurer to cover the technical provisions (including the risk margin) and that the run-off of risk margin each year would compensate the insurer for providing capital against non-hedgeable risks. This effectively means that the transfer of technical provisions of an insurer in financial difficulties would be sufficient (on best estimate assumptions) to fully capitalise the transferred liabilities in the future.
2.2.2. Choice of approach: risk margin as prudence
The concept of a risk margin was not an entirely new concept unique to Solvency II.
The Market Consistent Embedded Value Principles (CFO Forum, 2016a), which pre-date Solvency II, include Cost of Non-Hedgeable Risks, which is similar in concept to the Solvency II risk margin, and is presented as an equivalent cost of capital.
When Solvency II was under development, two alternative approaches to defining the risk margin were considered (CEIOPS, 2007, page 12). One was the cost of capital approach described above (which is the Swiss Solvency Test (SST) approach), and the other was a recalculation of liabilities replacing best estimate assumptions (which are by definition 50th percentile) with an alternative point on the probability distribution, e.g., 75th percentile (which is the Australian approach). One of the main factors which swayed the decision in favour of cost of capital is the difficulty of defining assumptions on the basis of a probability distribution.
It appears from the consideration of two alternative approaches that a key driver for the inclusion of the risk margin in Solvency II was the desire to retain some form of prudent margin to the BEL, rather than a specific conviction that cost of capital must be covered.
2.2.3. Projection of SCR
Although the cost of capital approach was selected on grounds of relative simplicity, it requires an annual projection of SCR for the full run-off period of the liabilities, which is anything but straightforward for many insurers.
To calculate SCR accurately at each future duration requires complex projections within complex projections, and this is impractical for many insurers’ models. This difficulty is recognised within EIOPA guidance, which has set out a number of simplified methods. Unfortunately, these methods do not appear to be sufficiently accurate in many cases.
One robust approach to this problem is to define, for each block of business and for each component of SCR, an appropriate “risk driver” which is output by the model, so that it is assumed that that component of SCR moves proportionately to the driver. For example, for the mass lapse component, the risk driver might be the excess of total surrender values over total BEL in each future year. The projected SCR is then determined in each future year by combining the individual elements in the normal way. This approach requires both analysis and understanding of causes of risks and significant testing.
2.2.4. Cost of capital rate
The cost of capital rate of risk free plus 6% p.a. is defined in the European Commission Delegated Regulation (EU) 2015/35, which is the same rate used for the corresponding calculation in the SST.
It was defined on the basis that the insurer to which liabilities are notionally transferred is itself subject to risks and therefore subject to a relatively high cost of capital. In the development of the SST, it was stated that 6% was deemed to be a reasonable estimate for the stressed cost of capital in BBB-rated companies, which broadly corresponds to the definition of the capital requirement in the SST (Federal Office of Private Insurance, 2006).
It may also be relevant to consider whether discounting at the risk-free rate in determining the risk margin is consistent with adopting a high cost of capital rate reflecting risk.
2.2.5. Problems with the risk margin
In practice, the risk margin has been subject to considerable criticism, primarily on the grounds that it is too sensitive to interest rate movements, but also that it is in any case too large.
To illustrate this, in a speech on 21 February 2017, David Rule (Executive Director, Insurance Supervision, Bank of England) stated that total risk margins for major life insurers in the United Kingdom had increased from £30bn at the start of 2016 to about £44bn in September 2016. He also estimated that a 100 bp reduction in interest rates increase risk margins by around 20%. He went on to refer to the “flawed design” of the risk margin, though he pointed out that for existing business the problems are mitigated by the transitional measure on technical provisions (Rule, Reference Rule2017).
The other issue with the risk margin is that its sensitivity to market risk does not fall within the calculation of the SCR under the standard formula. Consequently hedging the risk margins sensitivity to interest rates results in an increase in the SCR for rates risk.
2.2.6. Potential amendments to the risk margin
An urgent review of the operation of the risk margin is needed.
This could start off by considering two fundamental questions:
-
∙ Is the purpose of the risk margin to provide coverage for the cost of capital, or is it more a means of standardising a measure of prudence in addition to BEL?
-
∙ If the former (or if cost of capital is the preferred approach to the latter), is the requirement to cover full future capitalisation of existing business an appropriate element of Solvency II, or does this represent too high (and therefore too expensive) a level of customer protection?
Answers to these questions could then illuminate a review of risk margin.
The following changes could be considered:
2.2.6.1. Changes within the existing overall structure
-
∙ Reduce the cost of capital rate from 6% p.a.
-
∙ Align the cost of capital rate more specifically to the insurance sector.
-
∙ Increase the discount rate used to determine the risk margin.
-
∙ Make the risk margin more responsive.
-
∙ For example, use a mechanism to adjust the discount rate similar to the MA or VA.
-
∙ Use a cost of capital that decreases as the risk-free rate decreases, though the theoretical justification for this is not clear.
-
-
∙ Treat longevity risk as hedgeable – justified by the increasing availability of reinsurance
-
∙ Alternatively, allow insurers to use the market price of longevity hedging when lower than the risk margin.
-
-
∙ Determine the cost of capital not on the basis of the projected SCR, but of the excess of the projected SCR over the projected risk margin
-
∙ This would be consistent with the assumption that there would be no risk margin after the transfer of liabilities, i.e., that full capitalisation was not needed.
-
∙ However, it would introduce circularity into the calculation of the risk margin, requiring an appropriate solution.
-
-
∙ Allow SCR calculations to take into account the change in risk margin under the scenario:
-
∙ This would mitigate the impact of the risk margin by reducing the amount of SCR, which would itself reduce the risk margin further.
-
∙ However, it would introduce circularity into the calculation of the risk margin, requiring an appropriate solution.
-
-
∙ Impose an artificial maximum to risk margin
-
∙ For example, a defined percentage of SCR at the current date, similar to the definition of the minimum capital requirement (MCR).
-
2.2.6.2. More extensive changes
-
∙ Replace risk margin with something completely different
-
∙ If it is considered that the risk margin is primarily a prudent addition to BEL, this could be relatively simple, e.g., a defined percentage of the SCR (or MCR).
-
-
∙ Abolish the risk margin altogether.
The possibilities listed above might be considered suitable for consideration by the EU, or alternatively by the UK post-Brexit.
2.3. Transitional Measures
2.3.1. Background and summary
-
Transitional measures are set out in Articles 308b-308e of the Solvency II Directive. These include:
-
∙ Transitional measure on risk-free interest rates (Article 308c).
-
∙ Transitional measure on technical provisions (Article 308d).
-
∙ Equity stress in standard formula (Article 308b, paragraph 13).
-
∙ Grandfathering of Tier 1 and 2 Own Funds (Article 308b, paragraphs 9 and 10).
-
∙ Concentration and spread risk for government exposures not denominated in the domestic currency (Article 308b, paragraph 12).
-
∙ Extension of period for initial compliance with SCR (Article 308b, paragraph 14).
These transitional measures are presented as providing an orderly transition to Solvency II.
They are a package of measures negotiated as a political response to issues which were hindering final agreement to implement Solvency II. It would not have been politically acceptable to introduce Solvency II in many countries, including the United Kingdom, if that had meant that many insurers suddenly could not meet the Solvency II requirements.
The most significant issue was the cost of LTG in a low interest environment, and the measures sit alongside the other changes introduced in response to this issue. However, other issues are also covered by the transitional measures.
2.3.2. Transitional measures on risk-free interest rates and technical provisions
These two measures are alternatives – an insurer can use one or the other, but not both together.
Both measures apply only to business in force at end-2015.
Both measures require regulatory approval. The Bank of England has indicated that UK insurers wishing to use transitional measures will be given the freedom to do so (Woods, Reference Woods2015). In contrast, the regulator in the Netherlands has stated that approval will not normally be given, on the grounds that it would be a backwards step from the existing solvency regime there (McCaughey, Reference McCaughey2016).
The results ignoring the measures must still be produced and published. It is therefore possible that rating agencies and other commentators will place more weight on the results ignoring the transitional measure, which better reflect a level playing field. However, in the United Kingdom, analysts appear to be concentrating on results including the transitional measure, as use of transitional measures does not restrict payment of dividends.
The Directive requires that an insurer that would be insolvent without the transitional measure must report annually to the regulator on progress to restore solvency by the end of the transitional period.
2.3.2.1. Transitional measure on risk-free interest rates
This is an adjustment to the Solvency II risk-free rates, equal to a proportion of the difference between the Solvency I interest rate and the single interest rate equivalent to the Solvency II risk-free interest rates, determined as at end-2015 (allowing for the VA where relevant).
The proportion starts at 100% and is reduced to zero linearly over 16 years.
In countries that used a passive Solvency I valuation method, the measure will initially result in a discount rate broadly equivalent to the Solvency I rate, which may be significantly higher than the Solvency II risk-free rates.
According to data published by EIOPA (2016a), five insurers in four countries were applying this transitional measure on the basis of the Solvency II opening balance sheet or quarterly reporting at 31 March 2016. None of these insurers were in the United Kingdom.
2.3.2.2. Transitional measure on technical provisions
This is an adjustment to technical provisions, equal to a proportion of the difference between the Solvency I and Solvency II technical provisions, determined as at end-2015 (allowing for the VA where relevant). The adjustment may be applied at risk group level.
The proportion starts at 100% and is reduced to zero linearly over 16 years.
The Solvency II technical provisions include the risk margin, so this measure effectively defers the introduction of the risk margin, and it will therefore mitigate the sensitivity of the risk margin to interest rates in the short term.
In the United Kingdom, the base position for this measure is normally the technical provisions in the ICA, so the initial adjustment is likely to mainly comprise the risk margin together with the impact of restrictions to contract boundaries, as the remaining technical provisions are similar between ICA and Solvency II.
In countries that used a passive Solvency I valuation method, the adjustment will also include significant elements relating to differences in the discount rate and other valuation assumptions.
The amount of the adjustment is initially defined in monetary terms, there is therefore the likelihood that it will cease to be appropriate; in particular it could become too large following a rise in interest rates or too small following a fall.
There is therefore a provision that the regulator may require (or approve a request from the insurer for) a recalculation every 24 months or where the risk profile of the insurer has materially changed. The PRA has stated that it expects a recalculation every 24 months, and has listed a number of changes in risk profile that would be regarded as material, including changes in interest rates, specifically a change of at least 50 bps in the 10-year yield.
Although this transitional measure can act as a hedge to changes in the risk margin, the review process used by the PRA appears complicated and time-consuming, reducing the effectiveness of the hedge against volatility in the short term. A simpler and more wide-ranging process for recalculation would be welcome.
According to data published by EIOPA (2016a), 154 insurers in 12 countries were applying this traditional measure on the basis of the Solvency II opening balance sheet and quarterly reporting at 31 March 2016, of which 140 are life or composite insurers, with 28 insurers in the United Kingdom. These insurers represent 24% of total EEA technical provisions; the corresponding proportion in the United Kingdom is 57%.
On the basis of insurers which completed the EIOPA stress tests in 2016 (representing about 75% of each national market share, measured by technical provisions), the average SCR coverage ratio at 1 January 2016 for insurers in the EEA using this measure was 183% including the measure and 115% without it. The corresponding ratios in the United Kingdom were 143% and 105%. Despite the low average ratio ignoring this measure, EIOPA reported that no UK insurers would fail to cover their SCR without the measure. Nevertheless, it can be seen that this measure is very significant to solvency.
2.3.2.3. Comparison between measures
As the technical provisions transitional measure includes the risk margin, this measure is likely to be financially more advantageous than the risk-free interest rates transitional measure for most insurers. However, in countries using a passive Solvency I valuation method, it is possible that the risk-free interest rates measure could be more advantageous for a few insurers, e.g., where the impact on technical provisions of moving to risk-free discount rates is offset by changes to other assumptions.
This analysis is borne out by the statistics in EIOPA (2016a), with 154 insurers using the technical provisions measure compared with just five using the risk-free interest rates measure. In the United Kingdom, the impact of the technical provisions measure is normally very significant, whilst the risk-free interest rates measure would not normally be significant and cannot be used in conjunction with the MA. It is therefore not surprising that 28 UK insurers were using the technical provisions measure, with none at all using the alternative.
Both measures require technical provisions to be determined and reported on two different bases. This requirement may be particularly onerous where recalculation of the technical provisions adjustment is needed or where legacy systems must be maintained.
An added complication for the technical provisions measure may be increased volatility of results between recalculations, as well as uncertainty over whether a change in risk profile is sufficiently material to trigger the regulator to require recalculation or to permit approval of a request from the insurer. Some insurers report the impact of a notional recalculation of the measure.
2.3.3. Comments on selected other transitional measures
2.3.3.1. Equity stress in standard formula
This permits the equity stress required in the standard formula for equities purchased before 2016 to be scaled linearly over 7 years from 22% to the full standard formula stresses (39% for type 1 equities and 49% for type 2 equities, in each case subject to the symmetric adjustment).
This measure is optional, and does not require regulatory approval.
The intention is to mitigate the need for forced sales of equities resulting from the introduction of the risk-based capital requirements within Solvency II.
Insurers using this measure are required to keep detailed records of equities subject to the measure. Approximate methods are permitted in the case of equities held within collective investment schemes.
A potential disadvantage is that the symmetric adjustment is not included in the initial revised stress, so, although solvency ratios are higher with this measure, they are likely to be more volatile in times of equity price movements.
2.3.3.2. Grandfathering of existing capital
This measure includes capital to be treated as Tier 1 or Tier 2 that would not otherwise qualify as such, provided that it was issued before 18 January 2015 and that it met the relevant conditions under Solvency I.
This treatment is permitted for 10 years from 1 January 2016.
This appears to be a sensible provision, although it may have provided a short opportunity to issue capital to take advantage of the concession.
2.3.3.3. Concentration and spread risk in standard formula for government exposures not denominated in the domestic currency
This measure requires parameters in the standard formula in respect of EEA government exposures denominated in the currency of another EEA state to be reduced to zero in the first 2 years, and then increased to the full level over the next 2 years.
This presumably is mostly relevant to euro-denominated securities issued by non-Eurozone but EU governments and vice versa (e.g. issuance by Eurozone supranationals such as EIB in sterling).
It is unlikely to be significant to many insurers, though its inclusion in the package indicates that it is significant in some cases.
3. Capital Requirements
3.1. Standard Formula
The standard formula is used to determine the SCR for insurers which do not have an approved internal model. It is therefore considered to be particularly suitable for smaller and medium-sized insurers which are not subject to specific or unusual risks.
The standard formula is of great significance, as it is used by the vast majority of insurers subject to Solvency II. Table 1, published by EIOPA (2016a) based on the entire EEA market as at 1 January 2016, demonstrates this.
Table 1 Number of Undertakings Split by Type and Method of Solvency Capital Requirement Calculation

Although it is considered suitable for smaller and medium-sized insurers, it is believed that outside the United Kingdom the standard formula is used by many larger insurers.
3.1.1. Summary of general structure of standard formula
The standard formula requires a separate capital requirement to be determined for each individual risk type (up to 17 for life insurers).
The capital requirement for each risk is defined in the Delegated Regulation, and for life insurers it is equal to the impact on Own Funds (ignoring the risk margin) of specified scenarios or other calculations of the following types:
-
∙ For interest rate risks, the more onerous of two yield curve scenarios (up and down).
-
∙ For other market risks, scenarios with changes in the market value of each type of exposure.
-
∙ For life and health insurance risks, scenarios that are defined as either:
-
∙ a change in future assumptions; or
-
∙ a fixed stress independent of assumptions.
-
-
∙ For counterparty default risk, a calculation for each exposure depending on type of exposure, probability of default, variance of loss distribution and amount of collateral.
-
∙ For operational risk, a calculation based on the size of the business defined by various metrics (premiums, reserves, expenses).
Each individual capital requirement is required to be defined so that it is calibrated as a 99.5% VaR over a 1-year period – a “1 in 200 year event”.
Simplified methods can be used where the full requirement is disproportionate to the particular risk. Certain simplifications are specified, but insurers can use other simplifications where these can be justified.
The base SCR (excluding operational risk) is determined from the impact of the capital requirements for individual risks, aggregated using a series of correlation matrices. These use correlation factors between each pair of risks at each level. These factors are specified in the Solvency II Directive or the Delegated Regulation, depending on level.
This process is intended to ensure that the overall result remains consistent with 99.5% VaR over a 1-year period, allowing for the effect of diversification between risks on stressed assumptions.
The base SCR is first calculated without allowing for any change in the value of discretionary benefits or that of deferred taxes, as determined in the technical provisions.
The adjustment for the impact on discretionary benefits is then allowed for by repeating the entire calculation using appropriate revised assumptions for these benefits under each risk scenario and taking the difference from the original SCR calculation; the adjustment is subject to a maximum equal to the total value of discretionary benefits in the calculation of technical provisions.
The impact of deferred taxes is determined by assuming an instantaneous loss equal to the SCR, irrespective of the actual taxation regime.
The SCR for operational risk is then added to the result.
EIOPA (2014) has published a useful document setting out the assumptions made in defining the standard formula parameters.
3.1.2. Comments on general structure
The standard formula is required to be suitable for a broad range of mainly smaller and medium-sized insurers across all EU countries.
It should therefore cover the major risks relevant to these insurers, whilst being sufficiently simple and clear to operate, albeit with the option of using simplified methods where appropriate.
It has proved difficult to gain political approval for aspects of the standard formula, e.g., treatment of securitisation, and there are inevitably compromises between simplicity and universal appropriateness.
The appropriateness of the standard formula, both for general use and where considered in the case of a specific insurer, depends to a significant extent on:
-
∙ the comprehensiveness of the risks covered;
-
∙ the appropriateness and accuracy of the diversification methodology and correlation factors for combining risks; and
-
∙ the accuracy of the calibration of the capital requirements for individual risks.
3.1.3. Risks covered
The following are examples of significant risks relevant to certain life insurers, which are not covered by the standard formula:
Further information relating to some of these risks is given in EIOPA (2014).
3.1.3.1. Risks to market values and technical assumptions
Risk of change in:
-
∙ interest rate term structure other than increase/decrease at all durations, e.g., twist;
-
∙ interest rate volatility;
-
∙ spread between government bond yields and swaps;
-
∙ equity volatility;
-
∙ inflation rate (other than in relation to expenses);
-
∙ mortality improvement trend.
These risks have presumably been omitted on grounds of either ensuring the simplicity of the standard formula or limited applicability, or possibly in some cases on political grounds, and could have been included if considered appropriate. This has been helpful for those insurers in Germany that had been selling interest rate volatility by investing in callable bonds to enhance yield and to United Kingdom with-profit funds with high equity backing ratios.
3.1.3.2. Other risks
-
∙ Risk of change in the legal, fiscal or regulatory environment.
-
∙ Liquidity risk.
-
∙ Contagion risk.
-
∙ Risks from strategic decisions.
-
∙ Risks to the insurer’s reputation.
-
∙ Risk of change in terms of external contracts relevant to the evaluation of technical provisions, e.g., rebates received from external investment managers.
These risks are inappropriate for the standard formula, due to either the particular risk requiring a solution other than holding additional capital or the difficulty of providing a standard definition of capital required. Some of these risks should be managed through the general risk management systems operated by the insurer.
Nevertheless, insurers are required to consider all relevant risks in the ORSA, and must specifically consider whether there are risks not covered by the standard formula which require additional capital.
3.1.4. Correlation and diversification
The methodology used in the standard formula, which determines the capital required for each risk separately, at the same level (99.5% VaR/1 year) as the overall capital requirement, and then uses correlation matrices to allow for diversification between risks, has the advantage of conceptual, operational and mathematical simplicity. The impact of diversification on the SCR can be highly material, particularly where there is no single dominant risk. For example, Aviva (2017, page 30) reported total diversification benefit at end-2016 of £5.2bn (about 30% of pre-diversification SCR). Although this relates to an internal model rather than the standard formula, it illustrates the significance of diversification to Solvency II results.
However, it is subject to a number of valid criticisms:
-
∙ The methodology makes no allowance for the combined impacts of risks. This can operate either to increase or decrease overall capital required: e.g., the combined impact of a mass lapse stress with most other stresses would result in an overall reduction in required capital compared with both considered separately; on the other hand, for an insurer subject to guaranteed annuity options, the combined impact of an interest rate down stress and a longevity stress is likely to be higher than with both considered separately.
-
∙ There are alternative methodologies which allow for the combination of risks, but these significantly increase the complexity of the modelling required to determine the results.
-
∙ The capital requirement is based on extreme downside risks, and as a result the diversification approach should consider correlations between risks in extreme downside circumstances (“tail dependency” and “asymmetry”), which might be expected to differ from correlations observed in normal circumstances. This makes it very difficult to evaluate the correlation factors, as available data might not be considered relevant to the circumstances. A significant degree of judgement was therefore used in defining the factors. This has resulted in a broad approach, with simply determined factors; e.g., each specified correlation factor used in the standard formula is one of 1, 0.75, 0.5, 0.25, 0 or −0.25.
Nevertheless, the methodology used appears to result in a reduction for diversification which subjectively appears to be reasonable in many cases. It may therefore be considered that the advantage of standardising on a relatively simple method outweighs these criticisms.
3.1.5. Assessment of the appropriateness of the standard formula in the ORSA
Insurers using the standard formula are required to carry out an assessment of whether the assumptions used in the standard formula are appropriate, allowing for the specific risk profile of the insurer.
This must consider risks not covered by the standard formula as well as risks where the standard formula assumptions and parameters are not appropriate for the insurer’s risk profile.
In the event of there being significant deviations between the risk profile and the standard formula, insurers are expected to consider how this situation can be addressed. EIOPA guidance suggests developing a partial or full internal model, de-risking and aligning the risk profile with the standard formula as solutions to this. These solutions do not appear to recognise that they may be impractical where the problem lies primarily in the definition of the standard formula rather than with the insurer’s risk profile. For example, an insurer which is subject to higher longevity risk than covered by the standard formula, due to having a long liability profile, cannot readily de-risk or re-align its liabilities.
The regulator is permitted to require a capital add-on where the risk profile is significantly different, though this is intended to be temporary until the situation has been addressed. It is not clear what would happen if none of the above solutions work on a permanent basis.
Where elements of the standard formula understate the risk for an insurer, it is possible that other elements overstate the risk, and in these circumstances the insurer may wish to offset decreases in capital against increases. The Delegated Regulation relating to capital add-ons imposes strict conditions on data and methodology used to justify the reduction when applying such offsetting. Furthermore, at least one regulator has indicated that these conditions should also be applied in the case of the assessment within the ORSA.
Unless all elements of the standard formula are demonstrably appropriate for the insurer, this assessment appears to impose either additional capital requirements or a significant additional analytical burden on small and medium insurers, for whom internal models may not be appropriate.
3.1.6. Comments on the definition and calibration of individual stresses
This section includes commentary on the definitions of selected individual stresses used in the standard formula. For stresses where no comments are made, no implication is intended that the definition is considered to be fully appropriate.
3.1.6.1. Longevity risk
The scenario is a reduction of 20% in future assumed mortality rates. This was determined with regard to research mostly undertaken using data for annuities in payment.
Although the research had regard to changes in mortality trends, it was decided to express the stress as a level reduction in future mortality rates rather than an increase in the improvement trend, which might appear to be a more likely scenario; this was presumably on grounds of operational simplicity, even though amending the longevity trend assumption does not appear to be particularly challenging.
As the research had regard to annuities in payment, the determination of the stress as a level reduction rather than a trend increase might be considered inadequate for insurers exposed to longevity risk arising from deferred annuities at younger ages.
3.1.6.2. Lapse risk
The capital requirement is the most onerous of the following scenarios:
-
∙ 50% increase in assumed lapse rates for policies where lapsing increases technical provisions.
-
∙ 50% reduction in assumed lapse rates for policies where lapsing reduces technical provisions.
-
∙ mass lapse of 40% of all policies where lapsing increases technical provisions (70% for certain group pensions contracts).
The determination of whether lapsing increases or reduces technical provisions is required to be carried out at individual policy level. Whilst it clearly is sensible to allow for policyholder behaviour in evaluating lapse risk (e.g. where a policy provides a valuable guarantee, a reduction in lapse rates might be expected in extreme conditions), carrying out such calculations at individual policy level brings practical difficulties. Furthermore, such differential policyholder behaviour is unlikely to be exhibited where, e.g., lapsing increases technical provisions for larger policies and reduces technical provisions for smaller policies of the same type, due to the fixed nature of the expense provision.
It is thought that many insurers adopt a simplification, so that the determination of which scenario to apply is carried out at product class level rather than individual policy level. It is considered that the requirement could reasonably have been expressed to permit this without classification as a simplification.
On the other hand, as informed policyholders can be expected to be more likely to lapse where financially advantageous and less likely where disadvantageous, it might be considered more appropriate to include both the increase and decrease scenarios in the overall capital requirement (subject to a diversification calculation with negative correlation factor) rather than simply taking the higher of the two.
The mass lapse scenario is unusual, in that the scenario is defined in absolute terms rather than with reference to the insurer’s own assumptions. This scenario must consider the situation where there is a catastrophic change in the insurer’s public reputation or there are external factors affecting customer psychology, in particular where the concept and security of life insurance is publicly discredited, or both.
It is clear that there is limited actual data relevant to the assessment of such situations – EIOPA (2014) has stated that the empirical basis to calibrate the mass lapse event is scarce. It appears that the 40% rate was determined largely subjectively, perhaps influenced by those who take the view that the inclusion of value of future profits within technical provisions should have been limited under Solvency II. It should be considered inappropriate to use the same mass lapse assumption for all insurers irrespective of the product type, the stability of the markets in which the insurers operate and the insurers’ actual lapse experience. It is therefore likely that the 40% rate is too high for many insurers. The prospect of a market in mass lapse risk transfer has been suggested (Horley and Gingell, Reference Horley and Gingell2016). Were such a market to develop, it would provide a means of mitigating the Solvency II capital requirement, and may indeed demonstrate that the capital requirement is over-prudent.
Furthermore, there are varied interpretations of the treatment of future expenses under this scenario.
3.1.6.3. Life catastrophe risk
The capital requirement is based on the assumption of a catastrophe causing additional deaths of 1.5 pro mille during the next year.
This can be considered to be very modest in comparison to the impact of historical pandemics, e.g., the 1918 influenza pandemic, and indeed wars. However, this may be justifiable on the grounds that public authorities’ understanding and control of the spread of pandemics has substantially and permanently improved since the time when pandemics were more common and severe, particularly in areas like the EU. One can only hope that this remains so.
At a more technical level, there is an inconsistency between the definitions of the standard formula for life catastrophe risk and for health catastrophe risk – this is also required for life insurers who write income protection and critical illness policies.
Whereas life catastrophe only includes an unspecified risk which can be regarded as covering risk of pandemics and wars, health catastrophe includes specific elements for mass accident risk (e.g. stadium disasters) and accident concentration risk for writers of group income protection insurance as well as pandemic risk. It is not clear why these additional risks are not also specifically included within life catastrophe – in particular accident concentration risk is relevant to insurers of group life business.
3.1.6.4. Interest rate risk
The two scenarios to be considered are upwards and downwards changes to the yield curve, defined as percentages of the yield at each duration, the percentages reducing with increasing duration. The upwards changes are subject to a minimum of 1 percentage point at each duration, which applies throughout the curve in current conditions. There is no corresponding minimum change on downwards changes, and in current low-rate conditions, the stresses are very low.
As the base yield curve moves to the UFR at long durations, it is not clear why the scenario effectively includes stresses to this rate, which was defined with regard to considerations that were considered relatively stable in the long term, though the EIOPA review (see Appendix 2) may amend this.
There are many possibilities for changes to the shape of the yield curve, and other potential scenarios might be more onerous for individual insurers. Clearly, the standard formula must limit the number of scenarios to be investigated, but additional scenarios such as twists (increases at short durations and decreases at long durations and vice versa) might have been appropriate.
3.1.6.5. Equity risk
The basic scenario is a 39% reduction in value for equities listed in EEA or OECD countries and a 49% reduction for other equities.
This is subject to a “symmetric adjustment” of up to 10 percentage points in either direction, based on the relative value of an equity index in comparison with a 3-year average. This is justified on the grounds that equities have historically demonstrated an element of mean reversion. The symmetric adjustment can work well in immunising the solvency ratio against short-term fluctuations in equity values, though the fixed nature of the 10% limit may give problems in practice after an equity crash where an insurer is concerned about maintaining solvency following a further reduction. Perhaps a removal of the limit could be considered to reduce pro-cyclicality risk during rapid and extreme market falls.
3.1.6.6. Spread risk
The requirements to determine capital for spread risk are very complicated, covering 12 pages of the Delegated Regulation. The capital required is based on type of instrument, with many sub-classes and exceptions, and for each class the stress depends on the rating and duration of each instrument. Unlike most other modules, these requirements are defined in the style of capital charges for each asset type rather than being scenario-based.
A particularly noteworthy feature is that EU government bonds denominated in the domestic currency are regarded as risk-free, notwithstanding the crisis affecting certain Eurozone members.
The Delegated Regulation was amended in 2016 to reduce capital requirements in respect of spread risk arising from infrastructure investments, reflecting the European Commission’s Investment Plan for Europe.
3.1.6.7. Currency risk
The capital requirement in respect of each foreign currency other than the insurer’s local currency is the higher of the impact of an increase of 25% or a decrease of 25% against the local currency. All currencies are assumed to move against the insurer at the same time without making allowance for diversification between them.
The increase scenario applies where liabilities exceed assets in the currency, and the decrease scenario where assets exceed liabilities.
An unsatisfactory feature of this requirement is where an insurer backs the exposure of the SCR and/or risk margin to a foreign currency with assets in the same currency, in order to minimise currency risk. This generates an additional capital requirement, because the scenario does not amend the value of the SCR or risk margin.
3.1.6.8. Counterparty default risk
Like spread risk, the requirements are also very complicated, and cover 13 pages of the Delegated Regulation, which include a number of mathematical formulae. This complexity is probably necessary given the number of different types of arrangement that must be covered, as for a few insurers these risks are significant.
For most insurers, these risks are not material, and although it is helpful that EIOPA have provided worksheets which produce the results, a simpler approach relevant to most insurers would have been welcome.
3.1.6.9. Operational risk
A very simple factor-based approach has been adopted, on the overall assumption that a standardised level of risk management is present, and therefore operational risk can be defined in terms of standard metrics reflecting the size of the insurer.
The approach is completely different between traditional business, where the metrics used are premiums or reserves, and unit-linked business, where the metric used is renewal expenses.
Although the overall assumption of a standardised level of risk management is unlikely to be true in practice, it is difficult to see how a different approach could be adopted in practice for the standard formula, unless some judgemental discretion is given to the regulator in relation to the assessment of the quality of risk management.
This module (and in particular its application to unit-linked business) is specifically required to be covered by a review of the standard formula to be carried out by the European Commission.
3.2. Internal Model
3.2.1. Original aims
Recital 68 of the Solvency II Directive states:
“In accordance with the risk-oriented approach to the Solvency Capital Requirement, it should be possible, in specific circumstances, to use partial or full internal models for the calculation of that requirement rather than the standard formula. In order to provide policy holders and beneficiaries with an equivalent level of protection, such internal models should be subject to prior supervisory approval on the basis of harmonised processes and standards”.
The recital implies that a feature of a risk-oriented approach to regulation is to allow insurers to use a risk based internal model to determine its regulatory capital requirements, subject to supervisory approval.
The working party’s interpretation is that one of the aims of the internal model framework under Solvency II was to encourage insurers to develop their own capital models which provide a better assessment of the insurer’s own risk profile, and enable insurers to use those models to determine their regulatory capital.
Internal models as part of a regulatory capital framework were not a completely new innovation that came with Solvency II. Both the SST insurance regime and the Basel II banking regime included internal model frameworks. Furthermore, in the United Kingdom, internal models were effectively being used for Pillar 2 risk management under the “ICAS” regime. In designing Solvency II, policymakers would have taken insights from the experience of these regulatory developments which pre-dated Solvency II.
3.2.2. Overview of EU regulatory framework
The Solvency II Directive sets out the main overarching requirements for Internal Models in Articles 120–126, which include the “6 tests” that an insurer’s internal model must satisfy in order for it to be approved for use in determining Pillar 1 capital requirements.
The key features of the Directive requirements are summarised below:
-
∙ Scope: Solo entities and/or groups can apply for a “Full” or “Partial” internal model if their risk profile deviates significantly from the assumptions of the standard formula. This can be at the initiation of the insurer, but the national regulator also has the powers to request that an insurer uses an internal model.
-
∙ Approval process: Firms submit a formal application to their supervisor according to a prescribed list of contents. Upon receipt of the application, the supervisor must review the application against the Directive requirements and respond with the approval decision within 6 months of the application date. However, national supervisors were also permitted to have in place an extended “pre-approval” process ahead of the Directive going live, which in practice provides additional time for supervisory review. The internal model can be approved with or without conditions or declined.
-
∙ Groups: In the case of multinational group applications, a college of supervisors from different jurisdictions may be involved in the review of the application.
-
∙ Criteria for approval: The key criteria are set out in the “6 tests” of the Directive, namely: use test, statistical quality, calibration, documentation, data, and use of external models. These high-level requirements are then supplemented with much more detailed requirements set out in the delegated acts, EIOPA guidance and requirements of the national supervisor.
-
∙ Ongoing change control: After an internal model is formally approved, the insurer must follow a regulatory process for making changes to the internal model. This change control process is intended to be principles based, with insurers developing their own model change policies (which must be approved by the supervisor) and making formal application for supervisory approval of any changes which the insurer deems to be a “major change”.
-
∙ Disclosures: There are certain disclosures (e.g. specific Quantitative Reporting Templates (QRTs)) which relate specifically to internal models.
In the opinion of the working party, while there is a large amount of prescriptive regulation around internal models, the subject matter is inherently subjective and therefore there is considerable scope for discretion to be exercised by the national supervisors.
3.2.3. Local UK regulatory requirements
The working party’s opinion is that in the United Kingdom, the PRA was supportive of the development of internal models and therefore educated insurers and encouraged the preparatory work. The PRA initiated a “pre-application” process which allowed both the supervisor and insurers a significant period of time in advance of Solvency II go-live to prepare for the formal application process.
The PRA also introduced the concept of “quantitative indicators” which are tools used by the supervisor to benchmark and challenge insurers’ internal model calibrations. The use of these quantitative indicators (most notably for credit and longevity risk) gained a mixed reception amongst insurers involved in the IMAP.
The PRA also provided overriding guidance in certain areas, e.g., the requirement to hold capital against gilt-swap spread risk and the prohibition of a dynamic VA. Arguably, these are contrary to the logic of an “internal” model and weaken the logic of the “use test” if the insurer had a different opinion on these issues.
The PRA certainly appears to have been an enthusiastic adopter of the internal models (evidenced by the number of models approved in United Kingdom) and indeed provided a lot of additional guidance and local regulation to UK insurers on top of the EU regulatory instruments. However, the working party could not find clear evidence that any of this “national overlay” by the PRA amounted to anything contrary to or against the spirit of the Directive requirements. If anything, this “national overlay” appears to have provided additional guidance and support to insurers who wanted to get their internal models approved.
3.2.4. Benchmarking
Table 1 in section 3.1 provides a breakdown of the number of full and partial internal models across the EEA market. The evidence suggests that internal models are not a majority practice.
In December 2015, the PRA announced that it had approved the use of full or partial internal models for 19 firms, effective from 1 January 2016 (PRA, 2015d). As the firms listed mostly comprised insurance groups including several insurers, it is clear that the number of UK insurers using full or partial internal models is a significant proportion of the EEA totals of 86 insurers using full internal models and 83 insurers using partial internal models given in Table 1.
3.2.5. Critique of internal models
The working party was generally of the opinion that the use of internal models in Solvency II is a positive aspect of the framework, with several advantages. It enables firms to more accurately model its risk profile compared to a one size fits all standard formula.
The more accurate modelling of the risk profile should provide greater protection to policyholders.
Firms can use the internal model as a tool which is integrated into the management of their businesses and used for decision-making purposes.
It encourages firms to take more ownership and responsibility for managing their risks.
It removes some of the incentives for gaming that might otherwise result from firms attempting to manage their business to the standard formula.
As part of its field work, the working party debated (both internally and with stakeholders) the effectiveness of the Solvency II framework for internal models in achieving the original aims. A wide range of views were expressed on this subject. Below we have listed some opinions which were expressed and some working party observations.
-
∙ Burdensome documentation requirements: Some stakeholders held the view that the extensive documentation requirements for achieving internal model approval were extremely burdensome and costly, with application packs containing enormous libraries of detailed documents. It is unclear whether the extent of the documentation was disproportionate to the aim of meeting the Article 125 requirements.
-
∙ Herding: The use of benchmarking calibrations by supervisors arguably encourages herding. To maximise the chances of internal model approval, a possible strategy would be to select a calibration which is in line with the average of other insurers’ (assuming that data are somehow available), as opposed to selecting the calibration which the insurer’s experts believe to be most appropriate.
-
∙ Supervisory overlay to calibrations: Anecdotal evidence on the approvals process included accounts of the supervisors exerting influence over the level of calibrations and/or methodology. This could in theory create challenging questions over expert judgement for the actuaries signing off such calibrations.
-
∙ Burdensome governance requirements: In order to obtain approval, the internal model must have a governance framework around it which also evidences the use of the model in the system of governance. Anecdotal evidence suggests some insurers have had to develop complex and burdensome governance processes around the model in order to meet the expectations of supervisors, therefore leading to additional cost.
-
∙ Non-level playing field versus standard formula: The standard formula is far less costly to implement than an internal model, putting standard formula insurers at a competitive advantage in terms of cost. Furthermore, the treatment of certain risks is inconsistent and could lead to lower capital requirements for standard formula insurers. Examples where this could arise include:
-
a) application of a transitional reduction in the equity risk SCR in the standard formula;
-
b) no risk capital required for implied volatility in the standard formula;
-
c) no risk capital required for sovereign risk in the standard formula.
-
-
∙ Complexity of models: There was a view expressed by some stakeholders that internal models had become extremely complicated as a result of Solvency II and it was unclear whether the additional complexity was adding value proportionate with the cost.
Within our working party we question whether internal models are too complex and too detailed for the purposes that they serve. The votes cast at the Life Conference suggested a broader range of views than those of our working party (see Figure 6).
Figure 6 Internal models are too complex. Conference workshop: Votes 51, average 3.8, SD 1.3.
3.3. Economic Capital Models
3.3.1. Economic capital models outside Solvency II
In recent years, many insurers have developed economic capital models, with a variety of uses, e.g.:
-
∙ Determination of embedded value
-
∙ Measurement of use of capital
-
∙ Planning and forecasting
-
∙ Risk management
-
∙ In the United Kingdom, the ICA required by the regulator under Solvency I
Many insurers have used the results from economic capital models in public disclosures, in particular embedded value.
In most cases, the methodology and assumptions used in such models has reflected the insurer’s own views, with limited external prescription. Although parts of the ICA were prescribed by the regulator, there was significant freedom over many assumptions.
3.3.2. Comparison with Solvency II economic capital model
Pillar 1 of Solvency II is based on the output of an economic capital model, details of which are prescribed by regulation.
Although Solvency II permits an insurer to use an approved internal model, this only permits the use of own methodology and assumptions in determining the capital requirement. Solvency II is prescriptive in relation to the calculation of Own Funds (including the valuation of assets and Technical Provisions) and in many other areas. Furthermore, the calculation of capital requirements in the internal model may also diverge from the insurer’s own view where the regulator has taken a different view in the approval process, e.g., due to industry benchmarking.
This prescription is likely to have resulted in a number of differences between the Solvency II economic capital model and the model previously in use, or any model reflecting the insurer’s own “view of the world”. The PRA has added to this by publishing national guidance on certain aspects, such as the supervisory statement SS30/15 on the treatment of gilt-swap spread risk (PRA, 2015c).
Examples of such potential differences are:
3.3.2.1 Risk margin
Solvency II requires insurers to hold a risk margin within technical provisions, as described in section 2.2.
The inclusion of the risk margin in an economic model can be questioned, though as stated in section 2.2.2, Cost of non-hedgeable risks was a similar item included within the Market Consistent Embedded Value (MCEV).
Furthermore, the ICA regime did not include a risk margin under its definition of economic liabilities, though it should be noted that the ICA sat alongside Solvency I, which included significant prudence in technical provisions.
Insurers’ pre-Solvency II economic capital models were therefore likely to have excluded the risk margin or have included a lower value. In future use of an economic capital model, an insurer may prefer either no risk margin or a lower margin determined using alternative methodology and assumptions.
3.3.2.2. Contract boundaries
Solvency II has strict rules on contract boundaries, which exclude the value of certain items which insurers may normally consider to be included within economic capital, e.g., profits relating to future unit-linked premiums.
3.3.2.3. Risk-free curve
Solvency II requires use of a swap curve, adjusted for credit risk, and subject to the UFR. A number of alternative economic modelling approaches may be preferred by insurers, e.g., government bond yields.
3.3.2.4. Liquidity premium
The Solvency II requirements for use of the MA and VA are more prescriptive and restricting than those an insurer may wish to use, e.g., in the definition of matching assets.
3.3.2.5. Valuation of assets
Most assets are valued at market value, both in Solvency II and other economic capital models. However, there are a few exceptions in Solvency II, e.g., financial services subsidiaries, goodwill and intangible assets. Insurers may prefer to include these at market value in economic models.
3.3.2.6. Miscellaneous Solvency II restrictions
These include restrictions on credit for intra-group diversification where capital is not fungible and for certain forms of risk mitigation arrangements. The insurer may prefer to avoid restrictions in its model.
3.3.2.7. Time horizon and risk quantile
Insurers may prefer to define required risk capital using a different time horizon and quantile to the 99.5% VaR over a 1-year period that is prescribed for Solvency II.
3.3.2.8. Transitional measures
Transitional measures create a distortion in Solvency II results, as indicated in section 2.2. The overall results are therefore not consistent with the economic capital model.
However, insurers making use of transitional measures must also produce results ignoring these, and so are in a position to use these results as the basis of their economic capital model.
3.3.3. Practical use of alternative economic capital models
In practice, there may be advantages for an insurer with an established economic capital model and/or a different view of methodology or assumptions from those required by Solvency II to use an alternative model alongside its Solvency II model, in order to maintain continuity and a consistent internal view.
A disadvantage is added complexity, although where the differences between models relate to exclusion of specific items or to changes in assumptions within the same modelling framework, the technical challenges of using two models alongside each other may not be significant.
A further disadvantage is the potential for confusion in reporting and using results. This can potentially be overcome by combining the results of the models, so that any reduction in Own Funds required by Solvency II compared with the insurer’s own view could be described as “economic capital excluded from regulatory Own Funds” and any increase in capital required as “additional regulatory capital requirement”.
A condition of approval of an internal model under Solvency II is that the internal model should be used as part of the system of governance. It would therefore be necessary for an insurer using an alternative economic capital model to ensure compliance with this requirement.
As the insurer must in any event comply with the Solvency II requirements for determination of Own Funds and capital required, many insurers and groups may take the view that use of an alternative economic capital model (demonstrating the existence of more capital held or lower capital requirements than under Solvency II) is of little practical value.
As an indication of this, a number of insurers have ceased reporting embedded value following the introduction of Solvency II.
Furthermore, as a consequence of Solvency II, the European Insurance CFO Forum has amended both their MCEV and EEV Principles and Guidance to permit, but not require, the use of projection methods and assumptions applied for market consistent solvency regimes (CFO Forum, 2016a, 2016b). This is likely to result in further convergence in economic capital modelling.
3.3.4. Use of alternative economic capital models by rating agencies
Although rating agencies are expected to use Solvency II results in assessing insurers in the EU, they are expected to continue to place more weight on internally developed economic capital models, which they continue to regard as being appropriate for purpose.
For example, the Fitch rating agency has stated (Fitch Ratings, 2017):
“Fitch will typically consider Prism FBM [Fitch’s Factor-Based Capital Model] as the primary focus for assessing capital adequacy but will also consider other measures such as regulatory capital ratios, leverage metrics and, in selected cases, insurers’ own in-house capital models”.
4. Impact on behaviour
4.1. Asset Liability Management (ALM)
4.1.1. Situation under Solvency I
Asset allocation for insurance companies is influenced or even driven by the regulatory regime the insurer is working in.
For many years, the United Kingdom has operated a realistic balance sheet approach to with-profits funds and an ICA alongside the Solvency I framework. Outside of the United Kingdom, many of the Scandinavian countries and the Netherlands had also moved to regimes that recognised a market consistent approach to capital management. For these countries Solvency II has been evolutionary rather than revolutionary.
By contrast for those European member states whose regulatory regime has been based around historic book prices/amortised value of bonds and technical provisions discounted at a prescribed discount rate, Solvency II has proved a sea change for many of its insurance companies. The impact on ALM practices for many of the insurers in these member states is correspondingly greater.
4.1.2. With-profits funds
In the United Kingdom, these funds are now deconstructed into their constituent parts of asset share, cost of guarantees, smoothing account, free assets, etc. Many are now run on the basis of duration matching of maturity guarantees, hedging the interest rate risk of guaranteed annuity options (where these exist) and delta hedging, or hedging with options, the equity risk associated with maturity guarantees.
Solvency II has motivated little more than a refinement in the way that with-profits funds are run. The main ALM change as a result of Solvency II has been a move to a swaps-based discount rate. For those insurers that had been running their funds assuming a gilt discount rate it has been necessary for them to review their ALM practices. This might have given rise to a change in asset allocation or hedging, through the use of spread locks, of the basis risk between gilt and swap rates.
The Danish pension companies reacted to the risk of falling interest rates on their with-profits contracts by buying swaps, swaptions and constant maturity swap (CMS) floors as a means to hedge the cost of guaranteed minimum growth rates (Ladekarl et al., Reference Ladekarl, Ladekarl, Andersen and Vittas2007).
By contrast German insurers have, as a generality, not hedged themselves in this way. German accounting standards and the way in which bonuses are determined by reference to revenue account profits have acted as a constraint to hedging the Solvency II position. In addition, increasing duration in the current low interest rate environment removes the prospect of reinvesting at a higher rate and there has been a reluctance to effectively lock in long-term interest rates at current low levels.
The need to hedge has been reduced in part by the construction of the risk free curve which is extrapolated from the 20-year point and which reduces the interest rate volatility of very long-term liabilities. Some German insurers, however, have seen the need for or benefit of extending the duration of their assets by buying “forward bonds”, from investment banks. These are agreements to buy government bonds at a fixed price on a fixed point in time in the future, e.g., 5 years, so as to reduce the duration mismatch with their liabilities.
4.1.3. MA
Within UK non-profit funds, and for annuity business in particular, there has long been a recognition of duration risk with a punitive reinvestment rate applying under Solvency I to investment portfolios that had a shorter duration than the corresponding liabilities. The MA, however, has had a huge impact on ALM behaviour.
In order to accommodate the MA in an otherwise market consistent framework, it has been necessary to define eligibility rules to ring-fence the assets backing these liabilities from the rest of the balance sheet’s assets.
The rules as set out in Omnibus II suggest that active approaches to trading bonds are not permissible, presumably to give time for the illiquidity premium to emerge. Hence it is not possible to allow an insurer to actively substitute one bond for a similar, but cheaper bond.
It would be preferable if the regulations were to allow such trading as the insurer could, if need be, choose to hold the bond to maturity and so meet its payment obligations. It would also allow cash flow matching to be refined at the short end as annuity portfolios run off.
Allowing low-risk profit taking in this way increases the profitability of annuity business and ought to result in added competition for the benefit of consumers. It would also contribute to the efficiency of bond markets.
The impact of this change has driven the demand for high-quality illiquid assets and introduces an incentive to bias annuity portfolios towards such assets and away from more traditional allocations to corporate and government bonds (Non-traditional Investments Working Party, 2015). In part, this has also been driven by the search for yield as a result of low rates and falling credit spreads.
Currently illiquid assets back 25% of annuities but the PRA has received indications to say that this could increase to as much as 40%. These trends are welcomed both by the PRA and politically as they may have wider economic benefits (Rule, Reference Rule2017); e.g., greater investment in public infrastructure and social housing.
These rules have given rise to other behavioural changes. On the positive side, the risks and characteristics of callable bonds are properly recognised and these do not qualify for MA treatment. Less positive are the costs and resources that have been invested into the construction of SPVs that invest in MA ineligible assets such as equity release mortgages, where the SPV issues fixed interest bonds that do qualify for MA eligibility (Robertson & Mee, Reference Robertson and Mee2016).
The rules have been accompanied by strict parameters within which annuity liability cash flows must be matched. These rules add to the burden of efficiently running an annuity portfolio (PRA, 2015a).
These rules also require that MA portfolios retain within them sufficient liquidity for margin calls for any derivatives held. This liquidity requirement results in retaining cash or government bonds (that can be repo’d to provide cash) with a consequent reduction in the portfolio’s discount rate. It is not clear why this requirement is necessary when there may be the ability to provide collateral from elsewhere on the balance sheet. It is another factor that reduces the ability to lower the price of annuities.
4.1.4. Unit-linked
There is no requirement within Solvency II for unit-linked liabilities to match the face value of the unit liability with the underlying assets (although other rules within member states may require this).
Commonly unit-linked policies have management charges that are linked to the value of units. The BEL recognises these charges including any profit element as a deduction to the unit liability.
Under Solvency II, following the Solvency I approach of close matching of the unit liability results in an insurer holding more unit related assets than the BEL. The net balance represents an addition to market risk attracting a SCR.
To mitigate this risk insurers can look to hold less than the total face value of units. There are practical considerations (Turnbull & Burger, Reference Turnbull and Burger2015). These may dissuade the wide scale adoption of this approach and as there may be some unease at an insurer investing in less than the full face value (or at least the surrender value) of its unit liability from a public perception point of view. The approach has variously been called actuarial funding, unit shorting and unit matching. However, it is entirely logical and could slowly become more widely adopted.
4.1.5. Own funds
The face value of units in excess of the best estimate liabilities form part of Own Funds and unit shorting represents the de-risking of risk within Own Funds.
Where long-term guaranteed business is written, market risk represents a large proportion of an “insurer’s total SCR”. Consequently there is an awareness of the need to invest in those assets that provide the greatest expected return on an assets relative to their SCR for market risk.
If investment strategy is allowed to drive asset allocation this can lead to a less diversified asset allocation than one where asset allocation is capital aware. A capital aware investment strategy will still be driven by economic considerations but with some adjustment that tilts the asset allocation away from capital inefficient assets to capital efficient assets. This adjustment would be constrained to the extent that the portfolio manager would consider it acceptable.
SCRs constrain the way that asset managers build strategic asset allocation models. An asset manager may look at a range of scenarios and derive a strategy that best fits rather than one based on expected returns and risk measured by reference to market volatilities and correlations. A Solvency II optimisation based on tail risks and tail risk correlations will produce a portfolio that relies less on diversification benefits between asset classes (Blamont & Rae, Reference Blamont and Rae2016).
4.1.6. Staff pension funds
The staff pension fund of an insurer has an impact on the SCR (PRA, 2016a).
The defined benefit fund liabilities of, typically older, traditional insurers, can be significant. These schemes can contain significant, long dated, inflation and interest rate risk as well as market risk associated with their growth assets, e.g., equity and property risk. The capital benefits of hedging these risks does encourage insurance companies that sponsor these defined benefit pension schemes to negotiate risk reducing investment strategies. Hedging these risks outside the scheme tends not to be viable. Hedging in this way can give rise to the need for an insurer to post collateral under the hedging instrument whilst the increase in the value of the hedged asset sits inside the pension scheme.
4.2. Pro-cyclicality
4.2.1. Capital drivers of pro-cyclicality
For all the benefits of a market consistent framework, Solvency II has received some criticism for its pro-cyclicality in respect of its treatment of market risk. Solvency II represents a shift from the Solvency I approach of reserving through what are hoped to be prudent margins.
The 1-year VaR approach of Solvency II requires insurers to find additional capital if their best estimates prove wrong, or to take actions within a short time period to reduce risk on the balance sheet. If markets fall then insurers can become sellers of assets; potentially driving prices down further.
Ultimately, if many insurers become forced sellers, this could create a solvency crisis for the insurance industry and the financial services industry as a whole. Implicit within the VaR approach is the assumption that market volatility is a good measure of risk when this is not always the case (Haldane et al., Reference Haldane2014).
Through a tighter, more harmonised regulation, Solvency II has imposed a standardised framework across the entire EU insurance industry that manages around EUR10 trillion of assets, increasing the risk that insurers will act in tandem (IFoA, 2016).
One of the strengths of Solvency II though is that it does reward sound management of market risk if options and guarantees are matched with appropriate assets. The trend across Europe is to manage market risk in this way although the very low interest rate environment encourages insurers that have not already hedged themselves to do so at what could be an expensive point in time.
4.2.2. Pro-cyclicality within UK with-profits funds
In the United Kingdom, with-profits funds have been run on an economic basis since 2003 when the realistic balance sheet was introduced. These funds have since mostly moved to one where interest rate risk is managed through the matching of assets and liabilities and where equity risk is managed, at least in part, through management actions such as delta hedging or the purchase of equity put options.
Delta hedging by with-profits funds, or the investment banks that have written their equity puts, is in itself pro-cyclical. As equity markets fall so delta hedging involves selling equities and moving into cash. An asset manager’s approach might be to buy assets that appear cheap in a falling market.
Certainly there is plenty of academic evidence of market momentum (Carhart Reference Carhart1997) that demonstrates the ability of equity markets to over-react to changes in market conditions. However, increasing risk positions in this way should require additional capital to allow for the possibility that the markets could continue to fall.
The concept of buying all the way down a market fall requires considerable capital, as evidenced by the fall in equities during 2000, 2001 and 2002. Hence the requirement for additional capital is entirely logical.
The debate therefore around the pro-cyclical nature of the regulatory regime is not that regulation should not be pro-cyclical but more the degree to which it is pro-cyclical or the extent to which it buffers short-term market fluctuations.
4.2.3. Management of pro-cyclicality
Consequently it is necessary to look for those areas where pro-cyclicality can be better managed. The VaR measure for capital requirements is used by both banks and insurers. As both work off of a 1-year VaR measure it potentially requires both to find extra capital and to reduce risk at the same time.
This logic is sound where a liability is due in the near future as with most banking and non-life liabilities. For long-term liabilities, short-term volatility is less important than the volatility of long-term returns. For assets backing long-tail liabilities the concept of giving time to allow the orderly sale of risky assets rather than a rapid fire sale would mitigate pro-cyclicality within the market.
The equity dampener introduces a contra-cyclical capital requirement. Its effect is to temporarily reduce the capital requirement (to mitigate the reduction in actual capital held) for falls of up to 20%, although it offers no further relief during the periods of the worst crashes when the risk of pro-cyclical behaviour is at its greatest.
The dampener provides breathing space for insurers to manage the timing of any asset disposals and may reduce the need to sell if the markets recover in the interim. Certainly there are many instances where markets recover sharply after a shock fall given their tendency to build momentum.
There is an argument that this type of relief could be extended to all market risks.
For credit risk the 1-year VaR measure results in capital being allocated to spread risk rather than default risk. This is perhaps the clearest example of where it is long-term returns rather than short-term asset values that are relevant to honouring long-term obligations.
This argument was finally accepted in Omnibus II in the restricted form of the MA where, for annuity business, assets are typically held for their cash flow matching characteristics rather than for making short-term trading gains.
This adjustment results in a BEL that more closely matches the value of the bonds backing it, and the capital requirement is commensurately less to reflect the reduced volatility of the Solvency II balance sheet. The capital requirement would be better if based on the increased risk of default, unless the lower SCR calculated for spread risk on MA portfolios represents a good approximation to this.
4.2.4. Interest rate risk for non-MA fixed interest portfolios
Outside of the MA the risk-free rate is based on a swap rate, making the matching risk-free asset a swap together with cash on deposit (with a default free deposit taker) earning a LIBOR-based deposit rate. The cash both matches the payment obligations under the floating rate leg under the swap and is available to post as collateral to a central clearer.
However, common risk-free assets favoured by insurers are government bonds. For UK insurers it is not unreasonable to consider these risk-free as the UK’s government is ultimately free to print money to meet its debt obligations (with any resultant inflation eroding policyholders’ benefits in real terms).
As stated in section 3.1.5.6, the standard formula pragmatically does not penalise insurers for holding EU government debt in the domestic currency; however, internal models have been required to recognise the basis risk between swaps and gilts.
Were the basis between gilts and swaps to become more volatile, then insurers may look to reduce their holdings of government bonds. From a forced sale perspective this would represent a “right way risk” as during times of market volatility it can be expected that gilt prices would be high as the trend would be a flight to quality as investors sell risky assets to buy gilts.
There is an additional protection as there is scope to apply to the regulator to use the VA that will give some regard to the assets typically held by insurers. The risk of pro-cyclicality would appear low, although any switching out of gilts and into cash plus swaps would increase the insurance industry’s exposure to the banking sector. A prudent person may prefer to hold gilts.
4.2.5. Spread risk for non-MA fixed interest portfolios
For liabilities that do not meet the strict definition of the MA (and where the VA could apply) there is a greater exposure to spread risk and, with it, pro-cyclicality. The corporate bond markets are far from liquid and much of the price movement during periods of illiquidity can be ascribed to the credit markets becoming illiquid.
A dampener for credit spread risk could also be seen not only as beneficial for insurers but also as desirable for regulators if limiting pro-cyclicality were a key concern. The same argument as for the MA can be applied, namely that spread risk is irrelevant for longer dated cash flows. It is actual defaults that matter.
4.2.6. The overall issues with discounting
The MA, VA and 20-year point from which the euro swap rate is extrapolated represent a number of compromises to the discount rates and capital requirements that make the overall regulatory regime acceptable to a number of EU member states.
These measures amend the, otherwise, market consistent framework and were a pragmatic response to the need to weaken the Solvency II regime for long-term guaranteed business. Harmonising as many of these concessions into a more homogeneous approach could result in a regime that has fewer discontinuities and a reduced number of fixes.
One such approach might be to recognise that an insurer’s liabilities are also bond like and to discount these at a uniform bond rate for all insurers, e.g., at an investment grade bond rate, e.g., commensurate with a 1 in 200 year solvency standard or a higher level such as AA rated bond. It might also avoid the need for eligibility requirements. It might also remove the need for the MA and VA.
Other suggestions exist. One is a “minimum cost” liability valuation based on the higher of gilts or swaps (Foroughi, Reference Foroughi2010). Such alternative frameworks as those above are of course open to criticism. An insurer that chooses to hold safer and lower yielding assets than the risk discount rate would not be able to meet its cash flow liabilities. An additional reserve to cover this shortfall would be necessary but would benefit from a reduced capital requirement.
4.2.7. Dealing with short-term volatility
In respect of the capital requirements, it seems entirely reasonable to recognise that short-term market volatility does not necessarily imply that additional capital is required by an insurer to meet its long-term liabilities.
However, there is a balance to be had between a capital regime that buffers sharp market corrections and insurers being required to hold capital against further falls. A dampener for all market risks could be an answer that allows an insurer to de-risk or recapitalise and avoid over-reacting to market shocks. It would also avoid asset disposals at a time when banks and insurers with short tail business are selling assets to reduce risk.
The symmetric adjustment for equities described in section 3.1.6.5 is a good example. The formula implicitly recognises that half of the fall might be due to short-term market volatility. Its ability to reduce pro-cyclicality is limited to a maximum reduction in the stress of 10%. Possibly there is potential to provide short term relief in excess of 10% in the event of a sharp market fall.
Extending the use of counter-cyclical capital requirements would take risk out of the financial system during short, severe, market downturns. The benefits of lower capital requirements could result in an acceptable trade-off between lower charges for consumers and risk where the increased chance of policyholders’ obligations not being met takes this type of market behaviour into account. It is reasonable that symmetry applies as the symmetrical adjustment for equity risk suggests. In this way insurers will hold additional capital when markets are strong. Indeed, in banking, counter-cyclical buffers means building up extra buffers in good times for release in the bad times.
In our workshop at the Life Conference there was agreement that a capital regime that provides time for insurers to formulate a measured response would be desirable (see Figure 7).
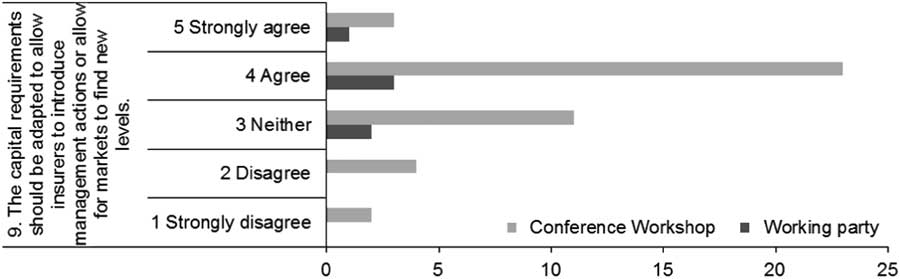
Figure 7 The capital requirements should be adapted to allow insurers to introduce management actions or allow for markets to find new levels. Conference workshop: Votes 43, average 3.5, SD 0.95.
4.2.8. Risk appetite and target coverage ratio
Insurers’ and groups’ risk appetites include a target for the solvency coverage ratio. The target is normally defined as a percentage of the SCR or a range of percentages. As reported by Honour (Reference Honour2016) and summarised in Appendix 3, a few groups have published target ranges, e.g., Aviva’s range is between 150% and 180% of SCR.
The target aims to ensure that the SCR will continue to be covered following an adverse event. This event may be defined in terms of VaR over a 1-year period, e.g., 90% or 95% VaR would correspond to a one in 10 or one in 20 year event, respectively.
Although the Solvency II regime allows for a recovery period to restore SCR, which may in certain circumstances be extended as described in section 4.2.9, it seems unlikely that commercially insurers would wish to be in breach of their SCR at all, let alone for a significant period. The size of the target coverage ratio will depend on the extent of the insurer’s risk aversion to breach of SCR, balanced against the desire to minimise capital.
EIOPA has expressed concern about analysts’ and investors’ lack of understanding of SCR, and insurers having too high targets.
In a conference in September 2015 Gabriel Bernardino, chairman of EIOPA (Risk.net, 2015), stated:
“[analysts are making arguments] as if a company that had a solvency ratio of 100% would be insolvent. That is definitely not true and [shows] a lack of understanding of how the regime works”.
“Of course [SCR] will fluctuate more than the capital requirement we have now, because it is risk-based and based on market consistent valuation. You don’t penalise companies from a market perspective just because you have a ratio that will become more volatile. [Insurers] should also not be penalised because they are more transparent and publishing numbers that are more risk-based”.
Bernardino also said that firms were contributing to the market’s overly cautious view by targeting a solvency level far in excess of the SCR.
Ludovic Antony, Director, Financial Institutions Advisory at Societe Generale Corporate & Investment Banking stated (Solvency II Wire, 2012):
“What is likely to be of much more significance is not a breach of the SCR, but simply the ‘derivative’ of the solvency ratio, i.e. its propensity to move away from one position to the next depending on the change in the state of the economy, and the ability of insurers to move on after a shock has occurred”.
However, Tom Wilson, Chief Risk Officer, Allianz, stated (Solvency II Wire, 2012):
“Even with a substantial educational effort, it is likely that a breach of a 100% SCR ratio will be negatively viewed by the analyst community if the SCR remains the focal point of Pillar III public disclosures”.
The Dutch supervisor, De Nederlandsche Bank (DNB), has stated that it expects insurers’ target solvency ratios to be closer to 100% than under Solvency I, since Solvency II is a better measure of an insurer’s risk profile. It notes that insurers are setting internal standards over 100% to ensure continuous compliance following adverse events (DNB, 2016).
There are indications that some supervisors have too high expectations for solvency ratios, though they are not shared by EIOPA. Karel Van Hulle, chair of the Insurance and Reinsurance Stakeholder Group at EIOPA, stated (Risk.net, 2015):
“Some supervisors expect insurers not to conform with the SCR but with a number 100% higher than the SCR, which is ridiculous. Nowhere in Solvency II does it say you need to be 100% or even 20% above the SCR. Where is it going to stop?”.
It seems to be standard that insurers’ risk appetites define target solvency ratios by reference to SCR. However, if it became more accepted that breach of SCR was to be expected from time to time, it may be seen as more logical to define targets with reference to MCR. This may also have the benefit of reducing volatility, at least for insurers where the MCR is not subject to the minimum or maximum proportion of SCR.
4.2.9. Extension of recovery period
Under stressed market conditions, regulators are allowed to extend the recovery period by a maximum of 7 years, if an exceptional situation is declared by EIOPA. This is characterised by one or more of the following:
-
∙ a fall in markets which is unforeseen, sharp and steep
-
∙ a persistent low interest environment
-
∙ a high impact catastrophic event
Under normal market conditions the recovery period is 6 months. This extension aims to reduce pro-cyclicality as insurers are not forced to sell assets at the same time during adverse market conditions.
However, as indicated in section 4.2.8, insurers are likely to be averse to an extended period in recovery, and therefore their behaviour could still be to sell their risky assets.
Under the current low interest rate environment, one wonders how low and how long interest rates need to remain for an exceptional market condition to be declared.
This flexibility, however, does not extend to breaches in the MCR, where the limit is 3 months.
4.2.10. Use of regulatory flexibility
In the past, during periods of stressed market conditions, Solvency I allowed regulators a degree of flexibility not available in Solvency II (Haldane et al., Reference Haldane2014). Such measures allowed for relaxation of rules for valuation of liabilities and capital requirements and the duration of any proposed plans to restore solvency.
Table 2 (Haldane et al., Reference Haldane2014) illustrates when such flexibility has been used in the past as a means to address pro-cyclicality in the market. These measures have been applied to prevent the technical insolvency of insurers. Avoiding technical insolvency has probably assisted consumer confidence. Whilst such flexibility has been advantageous, it is also criticised for penalising insurers that take management actions before the regulatory regime is relaxed.
Table 2 Summary of Use of Regulatory Flexibility for Insurers in Various Countries

Solvency II pays regard to this and some recognition to flexibility as, in the event of exceptional falls in financial markets, the regulator has the ability to extend the period by which insurers must have restored solvency in the event of a breach of the SCR. The impact of such a breach may have an impact on consumers and their actions.
Past practice in the United Kingdom has been that regulatory forbearance has prevented life insurers from publicly becoming technically insolvent. This has served policyholders well whilst longer-term solutions for troubled insurers have been found; often by merger or acquisition. Under Solvency II it looks as though insurers will go technically insolvent before any forbearance is possible.
The market reaction and the effect on policyholder actions in such an event are hard to imagine. In the United Kingdom the unprecedented consequences of such an event makes the outcome for policyholders hard to predict.
4.3. Product Design and Consumer Protection
4.3.1. Focus on capital
The preparation for and introduction of Solvency II would be expected to have an impact on product design, pricing and strategy as a consequence of its increased focus on risk capital, use of capital and capital steering via the use test. This increased focus provides strong incentives for insurers to price and manage risks appropriately. As a result some risks become uneconomic to run, e.g., unrewarded ALM risk. In this particular case we do see that many insurance companies have made efforts to more closely match assets to liabilities for their traditional businesses.
4.3.2. New business margin (NBM) and capital intensity
Current NBM does not allow fully for costs of holding risk capital to cover product risks obligations. The European CFO Forum NBM methodology only allows for frictional tax and expense costs of holding risk capital with an ad hoc charge for non-financial risks on top (CFO Forum, 2016a). In order to allow for the full costs of holding risk capital we have to consider the capital intensity for each product over its full term, i.e., the present value of risk capital. Considering a profitability measure based on the value of new business in relation to the capital intensity provides a measure of how efficient capital is employed per unit of new business profitability. Clearly the lower the capital intensity for a given profitability, the better. Such a measure (profitability over capital intensity) should correlate over time to a company’s return on equity, and should also correlate to share price and company performance.
4.3.3. Improving profitability
So, how can insurers improve profitability over capital intensity?
-
∙ By redesigning products to accelerate the emergence of profits over time. Early profitability is less “at risk” to shocks compared with later-emerging profitability, so move to front-end-loaded products compared with back-end-loaded products, where allowed by regulation and supported by market practice.
-
∙ By reducing capital intensity of the business by moving from traditional savings to hybrid and unit-linked products, and within traditional savings by lowering and shortening guarantees and thus reducing interest rate exposure and duration. For example, move to rolling guarantees or guarantees that only vest on maturity (non-cliquet) rather than every year. Some markets have even moved from guaranteed returns or payouts towards softer guarantees or aspirations, where the payout is often described as “protected” rather than “guaranteed”.
-
∙ Introduce weaker guarantees overall on all guaranteed products, e.g., out-of-the-money guarantees. Introduce ratchets on hybrid products to provide some positive performance to customers from rising markets. In some markets such as the UK, LTG have all but disappeared, and the hot product idea of the 2000s, the variable annuity, is becoming less viable.
-
∙ Further flexibility can be introduced by increasing the possibility for management action or other levers that allow management to alter product parameters as conditions change. This improves capital efficiency. For example, move away from guaranteed surrender values unless required by regulation and introduce market value adjustors where possible.
-
∙ By promoting protection business. Selling protection is often more capital efficient compared with savings products, as it brings diversification benefits, which reduce capital intensity. There is arguably negative diversification within protection business, e.g., between longevity and mortality, and little correlation between protection business (biometric risks) and the dominating market and credit risks (which highly correlate with market risk).
-
∙ Protection business can also be strengthened by adding riders to base savings-type products.
-
∙ Increase interest in health insurance to further boost protection presence. Strong preference for annually renewable/annually reviewable premiums over long-term guaranteed rates as this results in lower capital intensity under Solvency II.
-
∙ Increase presence in corporate/group business, especially protection. This will further diversify business lines away from savings and longer-term retail business.
4.3.4. Impact on products
All of this is happening in practice: we see this shift in product strategy for many large European insurers. Despite all of this strategic movement on the product side, there are other important considerations that need to be balanced against a slavish devotion to capital efficiency, including regulation and the customer value proposition.
For example, front-end loaded unit-linked products are some of the most capital efficient products but they offer poor customer outcomes for the many policyholders that surrender their policies early. Consequently they have been effectively banned by many regulators, such as in the United Kingdom.
Furthermore, non-market consistent UFRs introduce a distortion into pricing in certain markets, such as in Germany, which favour long-dated policies over others, and there is some uncertainty over whether investment management can perform in practice at this level.
Finally the introduction of Solvency II contract boundary rules has had a significant negative impact on NBMs for products with future reviewable premiums, and margins are in fact pushed to future periods. Some companies have considered reducing this premium reviewability in order to recognise the future profits embedded in these products (Risk.net, 2014).
It is important to note that Solvency II is not solely responsible for these changes. Solvency II has increased focus on capital management and aligned pricing, risk management and capital management compared with the risk-insensitive Solvency I. However, the move away from LTG is in large a consequence of the current very low interest rates in Europe in particular, although again, Solvency II may have increased and brought forward focus on this.
There have been a lot of new regulatory initiatives from the European Union that aim to improve consumer protection in the insurance sector and harmonise the national rules. Some of these include the Insurance Distribution Directive and the Packaged Retail and Insurance-Based Investment Products regulation (PRIIPS).
PRIIPS mandates that insurance companies selling typical savings and investment products will have to provide Key Information Documents to customers before sale, which include information on the riskiness of the product, potential future performance and the costs and charges within the product (including disclosing the Reduction in Yield).
This increases pressure on companies to take a more customer focussed view, and ideally one would hope that the introduction of these regulations would have a material positive impact on conduct risk and help reduce reputational risk and future mis-selling. It remains to be seen how insurance companies will factor all of this into the Solvency II calculation of risk capital.
5. Pillars 2 and 3: ORSA, Liquidity and Disclosures
5.1. Introduction
Our view and that of those voting at our Life Conference working party was that Pillar 2 has been a major success of Solvency II adding to financial stability (see Figure 8).

Figure 8 The Pillar 2 requirements – governance/Own Risk and Solvency Assessment (ORSA)/Board responsibility/Prudent Person Principle (PPP) – add to financial stability. Conference workshop: Votes 54, average 4.2, SD 0.75.
Pillar 3 has introduced greater transparency across Europe in terms of reporting and greater public disclosure. From a UK perspective, though, there is a loss of some of the granularity of detail that we are used to seeing in the outgoing PRA returns. In that respect there is less transparency.
In the working party’s opinion, certain parts of the detailed reporting do not appear to justify the costs. The whole process of looking through to the assets within funds layered within funds requires huge amounts of processing with its associated costs and resourcing, without it being clear how the information benefits regulators or analysts. This view is also reflected in the votes cast at the Life Conference (see Figure 9).
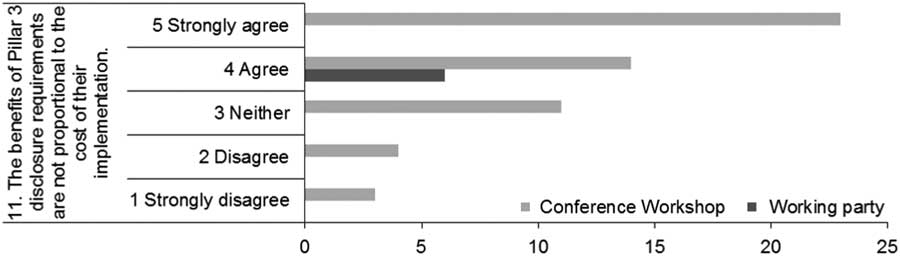
Figure 9 The benefits of Pillar 3 disclosure requirements are not proportional to the cost of their implementation. Conference workshop: Votes 55, average 3.9, SD 1.2.
5.2. ORSA
5.2.1. Summary of requirements
The Solvency II Directive states that every insurer should conduct an ORSA which should include at least the following:
-
a) the overall solvency needs taking into account the specific risk profile, approved risk tolerance limits and the business strategy of the insurer;
-
b) the compliance, on a continuous basis, with the SCRs, and with the requirements regarding technical provisions;
-
c) the significance with which the risk profile of the undertaking concerned deviates from the assumptions underlying the SCR, calculated with the standard formula.
The Directive also states that the ORSA should be an integral part of the business strategy and should be taken into account in the ongoing strategic decisions of the insurer.
EIOPA has published a set of guidelines setting out further detail in relation to the ORSA. These state that the ORSA should be performed at least annually. The Board should take an active part in the ORSA, including steering how the assessment is to be performed and challenging the results.
The EIOPA guidelines also state that insurers should have the following ORSA documentation in place:
-
a) the policy for the ORSA;
-
b) a record of each ORSA;
-
c) an internal report on each ORSA;
-
d) a supervisory report of the ORSA.
The insurer should take into account the results of the ORSA and the insights gained during the process of this assessment in at least:
-
a) its capital management;
-
b) its business planning;
-
c) its product development and design.
5.2.2. Public disclosure
The contents of the public Solvency and Financial Condition Report (SFCR) are set out in detail in Articles 290–303 of the Delegated Regulation. This includes the following information on the ORSA:
-
a) a description of the process undertaken by the undertaking to fulfil its obligation to conduct an ORSA as part of its risk management system including how the ORSA is integrated into the organisational structure and decision making processes of the undertaking;
-
b) a statement detailing how often the ORSA is reviewed and approved by the undertaking’s administrative, management or supervisory body;
-
c) a statement explaining how the undertaking has determined its own solvency needs given its risk profile and how its capital management activities and its risk management system interact with each other.
This suggests that the results of the ORSA process do not need to be made public.
Other contents of the SFCR include:
-
∙ qualitative and quantitative information regarding the risk profile of the undertaking for each category of risk,
-
∙ a description of the material risks, the material risk concentrations and the techniques for mitigating risks,
-
∙ a description of the methods used, the assumptions made and the outcome of stress testing and sensitivity analysis for material risks and events.
It remains to be seen how much detail companies will publicly disclose in relation to results of the ORSA process. Of the four first publicly available SFCRs (Solvency II Wire, 2017), three of the four just discuss the ORSA process that is followed. One of the four gave some information on the stresses conducted and which were the most significant (without quoting any figures). It seems unlikely that ORSA results will be made public.
5.2.3. ORSA review
In the United Kingdom, the ICA process was already in place prior to the implementation of Solvency II, however the ORSA is broader than the ICA, with consideration of qualitative risks rather than just the risk of failing to meet capital requirements. Another key difference between the ICA and the ORSA is the role of the Board. It is clear that the Board has a significant role in the ORSA process, which may be a cultural change for many companies.
In June 2015 the PRA published feedback on the ORSA (PRA, 2015b) stating that in general reports were of a reasonable quality but it noted some weaknesses. In November 2016 the PRA set out a supervisory statement of its expectations of the ORSA (PRA, 2016b).
Many other European supervisors have produced feedback on the ORSA produced during the Solvency II preparatory phase (referred to as the Forward Looking Assessment of Own Risks “FLAOR”) or have commented on their expectations in relation to the future ORSA supervisory reports.
In general, good progress seems to have been made in implementing the ORSA process and embedding this risk management tool into organisations. There is still some work to be done to fully meet the expectations of supervisors.
In June 2015, Gabriel Bernardino (chairman of EIOPA), in a speech to the European Insurance Conference (Bernardino, Reference Bernardino2015c) stated that “I always say that the Own Risk and Solvency Assessment (ORSA) is the heart of the Solvency II regime”.
In general, the ORSA, although an onerous process, is seen as a useful risk management tool and a best practice approach to embedding a strong risk culture.
5.3. Liquidity
Regulatory change has resulted in liquidity becoming a bigger issue for insurance companies than it had been prior to the financial crisis. The PRA became concerned about collateral upgrade transactions whereby insurers traded their lack of need for liquidity with banks, who in the period after the crisis, were finding sources of liquidity harder to access. As a consequence the PRA issued Supervisory Statement LSS2/13 in 2013 in response to their concerns (PRA 2013).
Within MA portfolios there is a growing demand for illiquid assets and the illiquidity premium that can be earned from them. The introduction of central clearing has introduced the requirement for insurers using derivatives to post variation margin in the form of cash. Liquidity has consequently become a more important risk factor for insurers.
Article 44 of the Directive states that insurers shall have in place an effective risk-management system that must cover inter alia liquidity. It is the wide-ranging nature of Article 44 that requires due regard to be given to liquidity.
Article 260 of the Delegated Regulation sets out clear requirements that firms must have in place a liquidity risk management policy that covers actions taken by the firm to manage short and long-term liquidity risk, appropriateness of assets in terms of nature, duration and liquidity, and contingency plans to deal with changes in expected cash flows.
Article 376 of the Delegated Regulation requires groups to consider any material concentrations of risk that could affect the liquidity position of a group.
The Pillar 3 disclosure requirements under Solvency II require firms to publish a detailed narrative on their liquidity risk exposures and the manner in which those are managed.
There is also reference that insurers need to have regard to liquidity in respect of their assets, particularly those covering their capital requirements (SCR and MCR), under the Prudent Person principle.
There is no requirement to hold capital against liquidity risk under Solvency II. The standard formula includes no model in respect of liquidity risk. The working party was of the opinion that it seems sensible that liquidity risk is addressed by risk management discipline, as opposed to holding additional capital.
The working party is of the opinion that Solvency II deals with liquidity risk in a mainly qualitative and principles-based manner, primarily through Pillar 2. In particular, it requires a firm to have a system of governance to manage liquidity risk, and requires firms to provide analysis of liquidity risk in both the ORSA and the SFCR. While there is not a great deal of prescription in the Directive itself on liquidity risk per se, the working party was of the opinion that Solvency II encourages firms to better manage liquidity risk (particularly through the system of governance requirements and risk management discipline).
Recognition of liquidity risk has been a positive feature of Solvency II. The life insurance industry has matured and evolved since Solvency I was introduced. A feature of the UK life insurance market is that most with-profits funds are in run-off and many of them are at the point where they will pay out more in claims than they receive in the form of investment income or premiums. Liquidity planning is important. For annuity portfolios of UK insurers, cash flow modelling and matching has been a long-standing practice.
There are more specific requirements under the duration-based equity risk sub-module where it is necessary to demonstrate that sufficient liquidity exists to ensure that the equity holding can be maintained for sufficiently long to justify its application. In a similar vein, Solvency II requires a liquidity plan where the MA or VA is applied and also in relation to Expected Profits in Future Premiums. Here the requirement is for a projection of asset and liability cash flows.
There are references in Solvency II to the need for the regulatory authorities to be able to provide information to various bodies such as central banks as part of their oversight or in times of an emergency.
The existence of a MA in Solvency II arguably allows insurers with long-term predictable cash flows to hold illiquid assets, recognising that the insurer is effectively “long liquidity”. Notwithstanding some of the practical issues with the MA rules discussed in other sections, the high level principle is a positive element of the framework, allowing long-term insurers to take advantage of excess (or “long”) liquidity position that they have.
However, the use of a 1-year VaR capital requirement under Solvency II arguably does not recognise the advantageous liquidity position of a long-term insurer. Under this approach, firms are required to hold sufficient capital to be able to transfer the liabilities to a third party in an arm’s-length transaction immediately after a 1-in-200 stress event. It could be argued that given that a long-term insurer’s liabilities are long dated, it would not in practice be forced to settle those liabilities by transferring them immediately following (say) a market stress. The use of 1-year VaR in this context arguably does not recognise that insurance liabilities are not short dated and less exposed to a mass lapse than other financial institutions such as banks.
The impact of Solvency II on insurers’ behaviour (particularly investment strategy) could in theory have wider knock on effects on market liquidity. To the extent that Solvency II causes pro-cyclical behaviour during periods of market stress, this could impact market liquidity. Given the short period during which Solvency II has been in force, there is limited data to assess whether the regime has had this effect. However, the working party could envisage scenarios where the Solvency II requirements might encourage insurers to switch out of certain asset classes en masse in order to avoid higher capital requirements, leading to impacts on liquidity of those assets.
Solvency II does not include prescriptive liquidity ratios or other quantitative liquidity requirements in the same way as banking regulations. The working party was generally of the opinion that this is appropriate in the context of long-term insurers, given that liabilities are illiquid and long duration.
Although the working party would not advocate more prescription in respect of liquidity, we note that the extent to which liquidity is covered is far less prescriptive than other technical aspects of Solvency II. This could give rise to variations in rigour and practice across Europe.
5.4. Pillar 3: Disclosures
5.4.1. Requirements
Solvency II sets out the qualitative and quantitative information to be provided to supervisors and the qualitative and quantitative information to be made public.
The quantitative information is published in QRTs. There are potentially 112 annual QRTs to be completed, although several templates will not be applicable for all insurers. There are templates for solo undertakings and group undertakings and for third country branches. For a solo undertaking with no ring-fenced funds there are 68 potential annual QRTs. In total, 13 QRTs are required quarterly. Some QRTs are publicly available (see below). Larger companies and groups are also required to complete “financial stability” versions of the QRTs (where total assets exceed €12 billion). Some supervisors, including the PRA, also require additional National Specific Templates (NSTs) to be completed.
A summary of the 68 QRTs required for solo undertakings with no ring-fenced funds is shown in Table 3.
Table 3 Number of Quantitative Reporting Templates (QRTs) Required
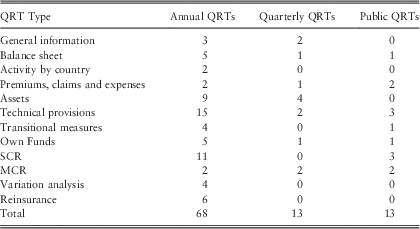
SCR, solvency capital requirement; MCR, minimum capital requirement.
The qualitative information required is contained in the public SFCR and the private Regular Supervisory Report (RSR). Where an undertaking owns a website it is required to publish the SFCR annually on the website. The full RSR should be submitted to the supervisor at least every three years and a summary is required annually. The content required for these reports is set out in detail. The RSR follows the same structure as the SFCR but more detail is required. Both reports contain the relevant QRTs.
As reported in Solvency II Wire (2016b), EIOPA has also stated that external audit of the Solvency II balance sheet can be a “powerful tool”. It also reports that countries planning to apply external audit include the United Kingdom, Ireland, Austria, Belgium, Cyprus, Germany, Hungary, the Netherlands, Poland, Portugal, Slovenia and Spain. Countries that will not be applying external audit to the Solvency II balance sheet include: Croatia, Czech Republic, Denmark, Estonia, Finland, France, Greece, Lithuania, Latvia, Norway, Sweden and Slovakia. Internal models are not generally included in the scope of external audits.
5.4.2. Issues
There are several common issues identified in relation to Pillar 3 disclosures. The following changes could be considered for the UK post-Brexit:
-
∙ Granularity of reporting, e.g., asset data reporting.
-
∙ The extent that the current volumes of data are necessary for the PRA to fulfil its role as regulator.
-
∙ Frequency of reporting, e.g., under Solvency I, quarterly reporting was not generally required in the United Kingdom. Even if quarterly reporting is retained, there could be an increase in insurers who are waived from quarterly requirements.
-
∙ Speed of reporting, e.g., extending the 5 week deadline for solo reporting.
-
∙ An increase in the number of QRTs that are publicly disclosed.
5.4.3. Public disclosures
Public disclosure is an important aspect of Solvency II. It is a key aspect of enabling the public to scrutinise an insurer’s financial strength and risk profile.
Informed persons (investment analysts, financial intermediaries and other interested parties) have the ability to analyse, compare and inform the broader public of an insurer’s strength. This provides market discipline in respect of solvency and risk management.
Prior to Solvency II, local regulators set reporting standards. The United Kingdom has benefitted from high levels of public disclosure whilst in other regimes the public disclosure has been more limited.
As such Solvency II scores highly in respect of harmonising a common reporting standard across Europe. Another huge step forward is the solvency reporting both at national level and at insurer level.
A principle of Solvency I disclosure in the United Kingdom was that the disclosures would be enough to allow a third party to approximately replicate the calculation of the technical provisions. The disclosures under Solvency II are much more “black box”. They are a statement of results produced by a calculation engine. The scope of audit under Solvency II varies by country. In the United Kingdom, the publicly disclosed QRTs are subject to external audit. However, this is not the case in many European countries.
Much of the disclosure is similar to that already enjoyed in the United Kingdom. Table 4 compares required disclosure under Solvency II with the Solvency I regime in the United Kingdom.
Table 4 Disclosure Comparison Between Solvency II and Solvency I
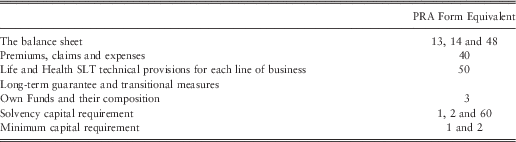
It could be said that the publicly disclosed data represents the bare minimum.
The public disclosures show the impact of the LTG and transitional measures. These measures had the effect of moving Solvency II further away from a market consistent framework and this disclosure enables the public to see the capital benefit that the company or group has received as a result. It also enables the financial strength of the insurer to be assessed without these benefits. If these adjustments are significant then there would be a question mark over the quality of the capital that these reliefs provide.
The public disclosures however do not go far enough in enabling the public to determine the market consistent framework of Solvency II prior to the LTG package as there is no disclosure of the impact of the UFR on the technical provisions. Analysts are well aware of this, and it is interesting to note that the capital markets are looking for insurers to disclose voluntarily the impact of a change in the UFR to the balance sheet.
A summary of voluntary Solvency II disclosures as at 31 December 2015 is given in Appendix 3.
EIOPA also carried out a stress testing exercise as at 1 January 2016, and a high-level summary of the results is given in Appendix 4.
6. Harmonisation
Solvency II introduced an EU wide insurance regulatory regime. Harmonisation was one of the key objectives of Solvency II and the concept of harmonisation is referred to several times in the recitals of the Solvency II Directive:
“Capital requirements should be harmonised throughout the Community”.
“The principles and actuarial and statistical methodologies underlying the calculation of those technical provisions should be harmonised throughout the Community in order to achieve better comparability and transparency”.
“Internal models should be subject to prior supervisory approval on the basis of harmonised processes and standards”.
However, there are several areas where full harmonisation has not been achieved. These can be summarised into three groups as follows:
-
∙ Where the Directive allows supervisors to exercise discretion in implementing certain areas.
-
∙ Where supervisors have introduced additional requirements beyond those specified in Solvency II or retained requirements from existing legislation (“gold-plating”).
-
∙ Where different interpretations of the same rules exist.
6.1. Discretion
The Solvency II Directive allows supervisors to exercise discretion in some areas. Some examples of this are:
Reporting
-
∙ Exemptions may be provided from quarterly reporting on the basis of proportionality. Exemptions are provided in the United Kingdom, Ireland, Germany, France and Spain.
-
∙ Exemptions may be provided from item by item reporting on the basis of proportionality.
-
∙ Additional NSTs may be required due to specificities of local markets. These are required in the United Kingdom, Ireland, France, Spain and the Netherlands.
VA
-
∙ Member states may require prior approval by the supervisor to apply a VA. This is required in the United Kingdom, Ireland, Germany and Portugal. It is not required in France, Spain or the Netherlands. The process for approval also varies considerably.
Unit-linked assets
-
∙ Member states may restrict the type of assets to which policy benefits may be linked (as long as these are no more restrictive than the UCITS Directive). Permitted links rules have continued to apply in the United Kingdom.
Capital add-ons
-
∙ Member states may determine whether the amount of a capital add on need be disclosed during a transitional period ending on 31 December 2020.
Authorisations
Member states may allow insurers authorised for non-life insurance activities to pursue life insurance activities and vice versa.
6.2. Gold plating
A European Insurance and reinsurance federation published a survey (Insurance Europe, 2015) in November 2015, which indicated that 68% of respondents stated that Solvency II has been gold plated in their market.
The general view of those voting at our Working Party’s workshop at the 2016 Life Conference was that Solvency II has been gold-plated in the United Kingdom (see Figure 10).
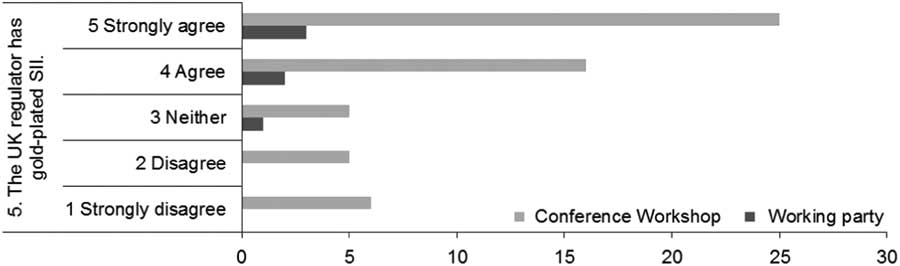
Figure 10 The UK regulator has gold-plated Solvency II. Conference workshop: Votes 57, average 3.9, SD 1.36.
Having said this, it is difficult to find concrete evidence of gold-plating and these views could represent differences in interpretation between the insurance industry and those of the regulators concerned. Insurers would tend to challenge such aspects in private.
6.3. Interpretation
The Insurance Europe survey in November 2015 indicated that 47% of respondents stated that their supervisor was interpreting Solvency II in a conservative way.
Some areas where different interpretations are possible include:
-
∙ internal model approvals;
-
∙ the ORSA; and
-
∙ required solvency ratios.
Some examples of different interpretations in these areas are discussed below.
6.3.1. Internal model approvals
MEPs raised concerns over the consistency of Solvency II across Europe at the meeting of the Economic and Monetary Affairs committee in September 2015. At the meeting Gabriel Bernardino, chairman of EIOPA, said:
“In April 2015, EIOPA issued a supervisory opinion on internal models covering some key areas where we found inconsistencies in approaches, for example risks related to sovereign exposures and the absence of formal decisions on equivalence. We provided relevant guidance to NCAs [national supervisors] and plan to engage with them in a follow-up exercise” (Bernardino, Reference Bernardino2015a).
It is not clear how EIOPA could address different interpretations by supervisors if rules are being communicated privately as part of the model approval process.
The publicly available data (and also private anecdotal evidence from practitioners that the working party spoke to as part of its field work), suggests that the national implementation of internal models varies quite widely across EU member states.
In the United Kingdom, originally around 100 insurers were initially encouraged to participate in the “pre-application” process prior to Solvency II going live. During this extended pre-application process (which arguably ran for 5 years due to the delays in the Solvency II go-live date) several UK insurers dropped out of the process due to the requirements being too onerous. In December 2015, PRA announced that internal models were approved for a total of 19 undertakings.
The number of approved internal models outside of United Kingdom varies widely between member states, depending on local market practice and the attitudes of the national supervisor. For example, the use of internal models appears to be far less common in France and Germany.
Data on the use of internal models across EU is given in Table 1 in section 3.1. The table illustrates that use of an internal model is not a widespread practice and is reserved for a handful of insurers that have the resources to meet the requirements.
The working party struggled to find conclusive data on whether the approval process in the United Kingdom was more difficult to pass than approvals processes conducted by EU regulators. This question is a highly subjective one which is difficult to assess based on any data.
6.3.2. ORSA
Some supervisors have set out templates or deadlines for the submission of ORSA reports. For example, the Italian supervisor, IVASS, has required insurers to submit the ORSA by 31 May 2016 and has specified a format for the ORSA report. In addition, some supervisors have set out their expectations as to what should be included in the ORSA report. For example, the French supervisor, Autorité de Contrôle Prudentiel et de Résolution (ACPR), set out some specific scenarios to consider in the 2015 FLAOR and its findings from this exercise suggest that it expects insurers to continue considering these scenarios in the ORSA (in particular a prolonged period of low interest rates or a rapid increase in rates). In addition, the Dutch supervisor, DNB, has stated that it expects insurers to consider the impact of the UFR in its ORSA.
6.3.3. Required solvency ratios
EIOPA has expressed concerns that supervisors have different expectations regarding solvency ratios. See section 4.2.8.
7. Impact of Brexit
The immediate impact of the Brexit vote is that the UK’s ability to influence the outcome of the EIOPA review of Solvency II will have been severely curtailed. On the other hand, Brexit gives the UK added flexibility to adapt Solvency II to better meet the needs of the UK industry. With this in mind the TSC instigated its inquiry into EU Insurance regulation and the working party was able to feed its views into the IFoA’s response. In this respect the working party agrees with the IFoA’s response in that a “revision to the current structure” is preferable to a “root and branch replacement”.
The form that Brexit takes will have an impact on the UK’s ability to evolve Solvency II. A soft Brexit could involve the UK accepting Solvency II even though the United Kingdom would be excluded from influencing changes made to it. A concern here has to be that Solvency II is adapted in a way that is unfavourable to the United Kingdom. An example of this could be the EU member states deciding to remove the MA.
A goal of a soft Brexit would be to retain both passporting and equivalence.
Passporting, which allows insurance business to be written by an insurance company in another member state, is mostly a benefit for reinsurers and non-life companies. For life insurance groups the norm still is to operate a life company within the State where the business is written. Hence UK insurance groups will already have an EU registered presence from which it can write European business. Passporting may not be achieved under a hard Brexit.
Equivalence avoids duplication and promotes open international markets, whilst ensuring that policyholders are protected globally. EU insurers with business in a country with equivalence may use local rules to report on operations there, while an insurer from outside the EU may operate in the EU without fully complying with Solvency II.
The loss of equivalence would be an issue for European groups writing business in the United Kingdom as well as UK groups reinsuring European companies. There is a risk that if the UK regulation were to move too far away from Solvency II, it could be deemed as not equivalent. The European Commission may decide that the solvency regime in non-EU countries is equivalent to that in the EU.
Omnibus II allowed for temporary and provisional equivalence to be granted to countries. These decisions are pragmatic and political. Japan was granted temporary equivalence (in respect of reinsurance) and provisional equivalence (in respect of group supervision) in November 2015. Provisional equivalence was granted to Australia, Brazil, Canada, Mexico and the United States of America in June 2015. Full equivalence has been granted to Switzerland (June 2015) and Bermuda (November 2015).
Consideration would need to be given to the impact on existing business. This could be branch business or where passporting has been used.
Solvency II involves regulation through a college of regulators. Brexit would result in a regulatory monopoly for the PRA, which has its plusses and minuses for the insurance industry. The ability for a UK insurer to move the base for its business out of the UK could, depending on the outcome of the Brexit, be lost.
Acknowledgements
Working party members give up a lot of personal time when contributing to papers and our sessional paper has been no exception. The Chair of the working party is truly grateful for the commitment and sacrifice made by the members of our working party given the competing pressures from their work and home commitments. As a consequence he would also like to extend his thanks for the patience of their families and significant others. At the start of our research the authors held a workshop in London and one in Edinburgh as we formulated our ideas about the scope of our paper. Thanks are due both to those who shared their views at one or other of those meetings and those of you who participated in our workshop at last year’s Life Conference. The authors are also grateful to Chris Barnard of the Life Research Committee who was assigned to shadow our working party and who provided invaluable help to guide us through the process. Within our working party, Andy Pelkiewicz took on the considerable additional task of editing and merging the various contributions for which special thanks are due. The peer reviewers also provided extremely helpful comments and guidance as well as encouragement. Our working party is grateful to them for their wisdom and time. The authors are also grateful to Mairi Russell and Vanessa Bennett of the IFoA, who provided the support and organisational skills that we needed as a working party. Finally the authors would like to thank the past efforts of all those authors and members of the profession who informed and influenced this paper.
Appendix 1: How has Solvency II fared against the objectives?
Key: 1=strongly disagree, 3=neither agree nor disagree, 5=strongly agree.
As part of the working party’s research, a survey was conducted during our presentation at the 2016 Life Conference in Edinburgh. The questions and responses are summarised in Table A1, alongside the opinions of the working party members.
Table A1 Results From a Survey Carried Out at the Life Conference 2016

At the Life Conference, on average 55 participants voted (response rates ranged between 43 and 65), and the standard deviation gives an indication of the variation in opinions. Question 1 was not presented at the conference but the working party members have expressed their opinions.
On the whole, people tended to agree with each other, and generally there is consensus between the participants at the Life Conference and the working party members.
For question 8, there is a wider standard deviation for both the Life Conference attendees as well as the working party members. However, for questions 4, 5, 6 and 11, even though on average they all scored 4 stars, the Life Conference attendees had more of a divergence in opinion compared to the working party members.
For the following questions we explore in more detail the differences in opinion between the members of the working party.
Question 2: In a UK context, SII may not have led to a higher level of protection for consumers and this can be seen from the results at the Life Conference; however, for other countries in Europe, SII may have achieved this to some degree.
Question 5: Most agree that the UK regulator has gold-plated SII and it has also been reported in the media, however, it is difficult to find hard evidence to corroborate the claim.
Question 7: There is a range of opinions on whether SII places enough emphasis on liquidity, and that issues around liquidity are being addressed piecemeal instead of having a holistic approach.
Question 8: Most are fairly comfortable with the non-market consistent parts of SII as pragmatic solutions to specific issues and that they should not be removed, however, some feel more strongly towards this topic.
Question 13: Most feel that harmonisation has not been achieved across Europe; however, we should acknowledge that it is an improvement from the previous existing solvency regimes across the continent.
Appendix 2: History of the UK insurance market and evolution of Solvency II
1. The past
Some key events in the UK insurance market in the last 20 years are shown in Table A2.
Table A2 Key Events in the UK Insurance Market in the Last 20 Years

Common features of many of the crises listed in Table A2 include:
-
∙ Autocratic management.
-
∙ A failure of governance.
-
∙ Poor risk management.
-
∙ Product complexity.
-
∙ A failure of prudential supervision.
The various crises listed above have highlighted the need for an improved Solvency regime, and have also been reflected in the design of the solution.
Table A.3 gives an overview of the evolution of Solvency II.
Table A3 Overview of the Evolution of Solvency II
The development of Solvency II was subject to severe delays, caused by the need to agree political compromises to ensure that the regime was acceptable in each country. Many of the problems relate to the low interest rate environment which has persisted since the financial crisis of 2008, which has placed particular strains on insurance companies subject to LTG.
As a result, a long-term guarantee assessment was carried out by EIOPA, and significant changes to the original Solvency II Directive were enacted in a new Directive referred to as Omnibus II, including an agreed package of measures covering LTG.
2. The future
This section sets out how the Solvency II regime may be revised by the European Commission, European Parliament or EIOPA in the future.
2.1. Review of SCR
The Omnibus II Directive includes a review clause (recital 60) inviting the European Commission to review the methods, assumptions and standard parameters used when calculating the SCR with the standard formula. Recital 150 of the Delegated Regulation states that this review should be performed before December 2018. The review should make use of the experience gained in the first year of application of Solvency II.
In July 2016 the European Commission sent a request to EIOPA for technical advice on the review of specific items in the Solvency II Delegated Regulation (European Commission, 2016). This references the 30 September 2015 call for evidence by the Commission and notes the following areas as meriting reflection:
-
∙ Proportionality and simplifications, in particular existing simplifications, the look-through approach, the non-life catastrophe risk sub-module and the counterparty default module.
-
∙ Technical inconsistencies including assessing credit risk (and removing reliance on external credit ratings), standard parameters used in mortality and longevity risk and non-life premium and reserve risk, assumptions used in the market risk concentration sub-module and risk mitigation techniques in particular embedded derivatives and longevity risk transfer.
-
∙ Removal of unjustified constraints to financing, particularly in relation to long-term investment. The Solvency II Delegated Regulation has already been amended in 2015 to support investments in infrastructure projects and European long-term investment funds. This review provides an opportunity to consider additional initiatives in the context of the Capital Markets Union.
The Commission has requested EIOPA to provide its advice by 31 October 2017. EIOPA has since agreed that the final technical advice will be submitted at the latest on 28 February 2018 (EIOPA, 2016c). This timetable suggests any changes to the standard formula will probably occur in 2018 or beyond. EIOPA published a discussion paper in December 2016 to engage in a dialogue with stakeholders on possible changes to the SCR standard formula.
In addition, EIOPA chairman Gabriel Bernardino has stated the need to revisit the calibration of different asset classes under Solvency II by 2018, and this should include sovereign bonds. “The recent financial crisis has demonstrated to all of us that sovereign bonds are not always risk-free. So, a risk-based regulatory framework should take this into account” (Bernardino, Reference Bernardino2015b). However, this has not been covered in the EIOPA discussion paper issued in December 2016.
2.2. Review of LTG package
Article 77f of the Directive states that EIOPA will report annually to the European Parliament, the Council and the Commission by the end of 2020 on the impact of the LTG package. The assessment will include the availability of LTG in insurance products, the behaviour of insurance and reinsurance undertakings as long-term investors and, more generally, financial stability.
Based on the EIOPA opinion, the European Commission will submit a report to the European Parliament and to the Council by 1 January 2021 accompanied by legislative proposals and focussing on:
-
∙ policyholder protection;
-
∙ the functioning and stability of European insurance markets;
-
∙ the internal market and in particular the competition and the level playing field in European insurance markets;
-
∙ the extent to which insurance and reinsurance undertakings continue to operate as long-term investors;
-
∙ the availability and pricing of annuity products;
-
∙ the availability and pricing of competing products;
-
∙ long-term investment strategies by insurance undertakings in relation to products to which Articles 77b and 77c (in relation to the MA) are applied, such as UK annuities, relative to those in relation to other LTG;
-
∙ consumer choice and consumer awareness of risk;
-
∙ the degree of diversification in the insurance business and asset portfolio of insurance and reinsurance undertakings;
-
∙ financial stability.
2.3. Legislative powers
Article 301b of the Solvency II Directive gives power to the European Commission to adopt Regulatory Technical Standards to adjust certain technical aspects of the Delegated Regulation.
In addition, EIOPA can also issue guidelines with a view to establishing consistent, efficient and effective supervisory practices, and to ensuring the common, uniform and consistent application of EU law. Such guidelines are addressed to supervisors and undertakings and are not legally binding, but addressees not complying with them will have to explain their reasons. EIOPA has published 29 sets of Solvency II guidelines (EIOPA, n.d.).
2.4. Technical information
The European Commission is publishing quarterly implementing regulations on the technical information to be used by insurance companies to determine the risk-free rate, the VA and the MA.
As of January 2016, EIOPA publishes on a monthly basis the risk-free rate term structures to be applied in the calculation of technical provisions and the symmetric adjustment to the equity capital charge.
2.5. UFR
The UFR is used to extrapolate the risk-free interest rate term structures to long durations. It is described in section 2.1.1.
EIOPA is currently reviewing the methodology to derive the UFRs. A UFR calculated with the changed methodology today would be 3.7%. EIOPA Chairman, Gabriel Bernardino, stated “We don’t believe it’s prudentially sound to wait until 2019, 2020 to make any kind of adjustments on this” (Jones, Reference Jones2016). Any cut would be introduced slowly, capped at the rate of 20 basis points a year. However, Nathalie Berger, the European Commission’s head of insurance and pensions, has suggested that it is too soon after the implementation of Solvency II to introduce any changes.
The German regulator BaFin and insurers oppose the change and say a 4.2% UFR is part of the political compromise made when Solvency II was negotiated between EU member states, and that the considerations used in its definition still apply. BaFin has also stated that the pro-cyclical effects of a change in the UFR would be a major concern. German insurers are particularly affected by the UFR because of their large back-books of LTG, which are up to 4% p.a., and mean they rely on asset yields picking up in the future. In contrast, the Dutch supervisor, DNB has stated its support for a reduction in the UFR. Dutch life insurers are likely to see the biggest impact on solvency ratios from a cut to the UFR and German firms probably face the biggest impact on new business according to Fitch Ratings (2016).
2.6. EIOPA priorities
The chairman of EIOPA, Gabriel Bernardino, set out the strategic priorities for EIOPA in a speech at the annual EIOPA conference on 18 November 2015 (Bernardino, Reference Bernardino2015b). The three main strategic priorities for EIOPA are:
-
∙ Enhance supervisory convergence
-
∙ Reinforce preventive consumer protection
-
∙ Preserve financial stability (EIOPA will continue to run stress tests – see Appendix 4)
A Gabriel Bernardino speech at the Italian Insurance Supervisor Conference in March 2016 on “Solvency II implementation – beyond compliance” (Bernardino, Reference Bernardino2016) again stated the EIOPA priority to increase supervisory convergence using the following tools:
-
∙ A comprehensive information system based on the data collected under the new harmonised Solvency II reporting templates;
-
∙ A Supervisory Handbook setting out good risk-based supervisory practices on different areas of Solvency II including risk assessments, how to supervise board responsibility within the Solvency II governance system, business model analysis, supervision of technical provisions, prudent person principle in investment policies and monitoring of internal models;
-
∙ A focus on the development and testing of sound on-going appropriateness indicators and benchmarking for internal models.
Going forward, peer reviews will continue to be used to compare and assess the quality of implementation of Solvency II and corresponding supervisory practices, followed by concrete recommendations to address the issues identified. EIOPA’s oversight team will continue the bilateral engagement with supervisors, providing independent and challenging feedback on supervisory practices, facilitating cross-border discussions and supporting improvements in local supervision. A review was conducted in Romania in 2015 and one was conducted in Bulgaria in 2016.
Appendix 3: Solvency II disclosures
Solvency II disclosures
Voluntary disclosures to the market at 31 December 2015 were reported in Honour (Reference Honour2016), based on a number of major European and UK groups. The companies analysed are summarised in Table A.4.
Table A4 Summary of Solvency II disclosures at 31 December 2015
Highlights of the Solvency II coverage ratio disclosures (Honour, Reference Honour2016):
-
∙ European groups analysed tend to have a coverage ratio of above 200%, except for AEGON and Delta Lloyd who have coverage ratios of 160% and 131%, respectively. Munich Re has the highest coverage ratio of 302%.
-
∙ The UK groups analysed tend to have a coverage ratio of around 160% to 170% after allowing for the impact on Own Funds and SCR of the Solvency II treatment of the with-profits business and pension scheme.
-
∙ A number of groups disclosed target coverage ratios. These vary considerably between Munich Re (175%–220%) and Old Mutual (120% minimum), with Aviva typical (150%–180%).
-
∙ The disclosed coverage ratios of Prudential and Aviva represent a “shareholder view”, which excludes the contribution from the with-profits funds and staff pension schemes. Phoenix disclose both (130% Solvency II view, 154% shareholder view). Standard Life state that the Solvency II treatment dilutes its ratio by 16%.
-
∙ Only four insurers disclose an economic capital ratio different to Solvency II.
In Ireland, a Milliman survey (2016) indicated that the average Solvency II ratio at year end 2015 for participating life insurance companies (36 of 44 with head offices in Ireland) was 195% compared with 247% under Solvency I. The Solvency II ratios ranged from 129% to 634%.
Appendix 4: EIOPA stress testing exercise
In December 2016, EIOPA published the results of their EU wide insurance stress testing exercise (see EIOPA, 2016b). EIOPA conducts these exercises every 2 years (in accordance with the regulation) and the purpose is to collect data and investigate potential vulnerabilities in the EU insurance market to a combination of market risk adverse scenarios. Key points to note from this exercise were:
-
∙ The exercise tested the resilience of EU insurers’ Solvency II balance sheets in response to two scenarios: (i) “Low for Long” a scenario of prolonged low interest rates and (ii) “Double Hit” a financial market shock combined with low interest rates.
-
∙ The sample for the exercise included 236 EU firms (solo entities), accounting for >70% of Solvency II technical provisions. In the base position (as of end Dec 2015), the average SCR coverage ratio was 196%, but there was a wide variation between different EU countries. The overall SCR coverage ratio would fall to 136% if LTG and transitional measures were excluded, demonstrating the high impact and importance of these provisions.
-
∙ Under the stress scenarios, EIOPA interpreted the results as highlighting vulnerability of the insurance sector to prolonged low interest rates. In the “Low for Long” scenario, more than 25% of the sample lost more than one third of surplus assets, and in the “Double Hit”, more than 40% of the sample lost more than one third of surplus assets.
-
∙ EIOPA has set out a number of follow up recommendations to national supervisors, including business model viability testing and inclusion of Low for Long scenarios in firms’ ORSAs. However, the recommendations do not include any proposed changes to Solvency II in light of the results.
Overall, firms are well capitalised under Solvency II given the average base SCR ratio of 196% and only two firms had a SCR ratio below 100%. For the United Kingdom, the average SCR ratio is lower and strongly impacted by the LTGs and transitional measures, given a 51% reduction in ratios in the absence of these provisions.
Appendix 5: Eligibility criteria for the MA
To manage risk a set of eligibility rules have been introduced, some of which make perfect sense whilst others less so.
In terms of the liabilities the MA is restricted to can be used for life and non-life liabilities provided
-
∙ No future premiums are payable.
-
∙ Only underwriting risks are longevity, expenses, revision and immaterial mortality risk.
-
∙ If mortality risk is included the BEL does not increase by more than 5% under the SCR mortality shock.
-
∙ Only option for policyholders is to surrender and the surrender value may not exceed the value of the assets supporting the liability at the time.
-
∙ Every insurance liability has to be taken in its entirety and not split into components which qualify and components which do not.
In respect of assets:
-
∙ Assets are to be maintained over the lifetime of the liabilities, except where cash flows have materially changed for matching purposes.
-
∙ Assets covering liabilities on the MA portfolio cannot be used to cover losses arising from other activities.
-
∙ Replication of liability cash flows in the same currency. This is technically correct for projecting cash flows and requires non-sterling assets to enter into a cross currency swap. Cross currency swaps have a high bid/offer spread and will be subject to a collateralisation arrangement that has to be met from assets within the MA portfolio. The complications and impact on returns from managing a collateral pool within the MA portfolio are a deterrent to using derivatives for efficient portfolio management.
-
∙ Any mismatches do not give rise to material risks in the MA portfolio. Their projected cash flows net of defaults need to match the liability cash flows with a high degree of precision. If there were the ability to buy and sell assets to refine the cash flow matching over time this degree of precision might not be entirely necessary.
-
∙ Asset cash flows are fixed and cannot be changed, although cash flows linked to inflation qualify if backing liabilities which are similarly inflation-linked. Non-life annuity liabilities in respect of long term disabled motor accident casualties (made under PPOs) are linked to a health care index. The absence of any similarly linked assets means that the MA cannot apply to PPO liabilities.
-
∙ If the cash flows of an asset can be changed in a way where the investor receives sufficient compensation to allow the same cash flows to be obtained via reinvestment, the right to change the cash flows will not disqualify the asset.


 Open access