


Introduction
Habitat loss and fragmentation are major threats to rainforest biodiversity (Terborgh Reference Terborgh1992, Lawton et al. Reference Lawton, Bignell, Bolton, Bloemers, Eggleton, Hammond, Hodda, Holt, Larsen, Mawdsley, Stork, Srivastava and Watt1998, Curran et al. Reference Curran, Trigg, McDonald, Astiani, Hardiono, Siregar, Caniago and Kasischke2004, Huang et al. Reference Huang, Kim, Altstatt, Townshend, Davis, Song, Tucker, Rodas, Yanosky, Clay and Musinsky2007), including birds (Fjeldså Reference Fjeldså1999, Sodhi and Smith Reference Sodhi and Smith2007). For 50% of all threatened bird species in the Americas, it is the only threat that needs to be managed and prevented (Collar et al. Reference Collar, Wege and Long1997). Habitat loss in the tropics is of particular concern given that 70% of all threatened bird species occur in tropical forests (Sodhi and Smith Reference Sodhi and Smith2007).
Mesoamerica with its character as a melting pot for northern and southern American species was ranked as one of the 25 primary biodiversity hotspots by Myers et al. (Reference Myers, Mittermeier, Mittermeier, da Fonseca and Kent2000). It houses a high percentage of endemic vertebrates and plants. A total of 9% (29) of the 327 threatened bird species in the Americas have a distribution restricted to Central America, which only represents a small proportion of the whole continent. In terms of range-restricted birds, Costa Rica and Panama have the most diverse species assemblages in the Neotropics (Collar et al. Reference Collar, Wege and Long1997) and they belong among the 15 countries with the most restricted-range bird species in the world (García-Moreno et al. Reference García-Moreno, Clay and Ríos-Muñoz2007). One of the region’s endemic birds, the Black-cheeked Ant-tanager Habia atrimaxillaris (Dwight et al. Reference Dwight, Griscom and Smith1924), has a particularly small distribution range. It only occurs in the lowlands of the Golfo Dulce Region in the south-western part of Costa Rica (Slud Reference Slud1964, Stiles and Skutch Reference Stiles and Skutch1989, Garrigues and Dean Reference Garrigues and Dean2007). Due to its extremely small distribution range of only c.500 km2 the species is classified as ‘Endangered’ (Aubrecht Reference Aubrecht, Weissenhofer, Huber, Mayer, Pamperl, Weber and Aubrecht2008, BirdLife International 2014). The poor knowledge on the species’ biology is emphasised by the fact that the first nests of Black-cheeked Ant-tanager were found and described only recently (Huber et al. Reference Huber, Weissenhofer and Aubrecht2008, Sandoval and Gallo Reference Sandoval and Gallo2009). Furthermore, information on the species’ actual conservation status and its habitat preferences is very limited (Aubrecht Reference Aubrecht, Weissenhofer, Huber, Mayer, Pamperl, Weber and Aubrecht2008, Aubrecht and Schulze Reference Aubrecht, Schulze, Weissenhofer, Huber, Mayer, Pamperl, Weber and Aubrecht2008, Sandoval and Gallo Reference Sandoval and Gallo2009).
Negative effects of human disturbance on forest birds have been reported for many tropical regions (Thiollay Reference Thiollay1992, Schulze et al. Reference Schulze, Waltert, Kessler, Pitopang, Veddeler, Mühlenberg, Gradstein, Leuschner, Steffan-Dewenter and Tscharntke2004, Waltert et al. Reference Waltert, Bobo, Sainge, Fermon and Mühlenberg2005, Gray et al. Reference Gray, Baldauf, Mayhew and Hill2007, Maas et al. Reference Maas, Putra, Waltert, Clough, Tscharntke and Schulze2009, Mordecai et al. Reference Mordecai, Cooper and Justicia2009). Range-restricted understorey birds are particularly sensitive to anthropogenic forest disturbance (Gray et al. Reference Gray, Baldauf, Mayhew and Hill2007). Therefore, we expect that with ongoing fragmentation of the Pacific lowland forest, remaining populations of the endemic Black-cheeked Ant-tanager will further decline in the next few years. Even well-protected areas such as Corcovado National Park are still strongly affected by deforestation close to their boundaries (Sánchez Azofeifa et al. 2003), which is increasing their isolation from other remaining forest fragments, a phenomenon found to negatively affect most tropical protected areas (Laurance et al. Reference Laurance, Useche, Rendeiro, Kalka, Bradshaw, Sloan, Laurance, Campbell, Abernethy, Alvarez, Arroyo-Rodriguez, Ashton, Benítez-Malvido, Blom, Bobo, Cannon, Cao, Carroll, Chapman and Coates2012). The range of the Black-cheeked Ant-tanager has declined by approximately 50% since 1960 (BirdLife International 2014). The only remaining populations are found in Corcovado National Park and in the vicinity of Golfito, particularly in the Esquinas Forest (Piedras Blancas National Park) and the Golfito Faunal Refuge (Schulze and Riedl Reference Schulze, Riedl, Weissenhofer, Huber, Mayer, Pamperl, Weber and Aubrecht2008, Seaman and Schulze Reference Seaman and Schulze2010, BirdLife International 2014).
Published information on habitat preferences of the Black-cheeked Ant-tanager indicates that the species is restricted to the understorey of dense lowland rainforest (Stiles and Skutch Reference Stiles and Skutch1989), where it occurs in undisturbed, older secondary and selectively logged forest areas (e.g. Aubrecht Reference Aubrecht, Weissenhofer, Huber, Mayer, Pamperl, Weber and Aubrecht2008). In contrast to other Habia species (e.g. H. gutturalis and H. fuscicauda), the Black-cheeked Ant-tanager forages higher up in the undergrowth and prefers more mature forest (Willis Reference Willis1966). However, so far no studies have quantitatively analysed the species’ habitat preferences, using a standardised survey design. In this study we tried to identify important habitats and forest vegetation structures preferred by the Black-cheeked Ant-tanager. In particular, we addressed the following questions: (1) Does Black-cheeked Ant-tanager prefer mature and old-growth secondary forest, although it can occasionally be observed in other habitats (e.g. beachfront scrub, palms adjacent to forest) (Stiles and Skutch Reference Stiles and Skutch1989, Capper et al. Reference Capper, Clay and Lowen1998, Aubrecht Reference Aubrecht, Weissenhofer, Huber, Mayer, Pamperl, Weber and Aubrecht2008)? Slud (Reference Slud1964) noted that they live more in tall secondary growth and broken forests than in the interior of unbroken forests. (2) Does the species avoid forest edges? and (3) to what extent is the species’ occurrence related to forest structure (tree density, canopy closure and understorey density)?
Depending on the information used for estimating the species’ current population size, the total number of birds is between c.10,000 and 20,000 individuals (BirdLife International 2014). In this study, two different methods – territory mapping and distance sampling – are used to estimate population density in part of the Esquinas Forest. So far such data are missing for this forest reserve. Furthermore, these are the first precise population density estimates, which we use to estimate the species’ current total population size.
Methods
Study area
The study area is situated in the Golfo Dulce region in the south-western part of Costa Rica. The remaining lowland forests in this region are relatively well protected by the Corcovado National Park (established in 1975) located on the Osa Peninsula and the Piedras Blancas National Park (established in 1994) on the eastern side of Golfo Dulce. These two protected areas are connected through the Golfo Dulce Forest Reserve (established in 1979). Furthermore, a corridor project to improve connectivity between these two National Parks and other protected areas in the vicinity is in progress as part of the project for a Mesoamerican Biological corridor.
Our study sites were located near La Gamba village (8°42′30″N, 83°11′0″W) and the La Gamba Tropical Research Station (8°42′61”N, 83°12′97”W; Figure 1). Here, most areas of flat terrain are covered by human-dominated habitats (pastures, annual cultivation, oil palm plantations, settlements) and secondary forest. On hilly terrain, large parts of the study area are still covered with almost pristine forest (Figure 1; for a more detailed description of habitat types see Höbinger et al. Reference Höbinger, Schindler, Seaman, Wrbka and Weissenhofer2011).

Figure 1. Maps indicating the location of our study area (inset) and the location of census points used for conducting bird surveys in eight different habitats: FI ─ interior of old-growth forest, FM ─ margin of old-growth forest, YSF ─ young secondary forest, GC ─ gallery forest strips connected to closed forest, GI ─ gallery forest strips isolated from closed forest, PP ─ oil palm plantations, FA ─ fallows, PA ─ pastures. Different shading indicates old-growth forest (dark grey), human-dominated habitats (pale grey) and rivers and streams (white). The Tropical Research Station La Gamba is marked by a white triangle. Furthermore, points are indicated at which Black-cheeked Ant-tanagers were recorded. The black square marks the area for which distance sampling was used to quantify population density using a dense trail system (compare Figure 2).
The forest area in the immediate vicinity of the Tropical Research Station La Gamba is located between elevations of 75 and 350 m and belongs to the Piedras Blancas National Park. It is easily accessible via an existing trail system (Figure 2) with a total length of 9.2 km. The trails are mainly situated in primary forest (76% of total trail length). The rest of the trails are situated in old-growth secondary forest (with canopy trees > 15 m high and single emergent trees > 25 m high) logged > 30 years ago. The classification of forest types is based on Weissenhofer et al. (Reference Weissenhofer, Huber, Koukal, Immitzer, Schembera, Sontag, Zamora, Weber, Weissenhofer, Huber, Mayer, Pamperl, Weber and Aubrecht2008).
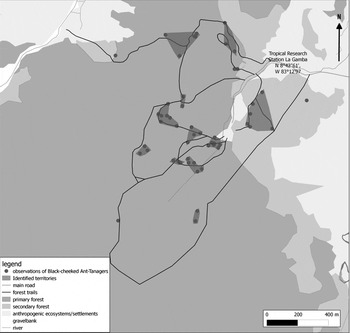
Figure 2. Trail system used for distance sampling and observations of Black-cheeked Ant-tanagers as well as their affiliation to identified territories in the vicinity of the Tropical Research Station La Gamba in 2010/2011.
The study area has a mean daily temperature of 28.5°C; the annual precipitation is about 6,000 mm. The rainy season lasts from August to November; a drier period usually lasts from January to March (Weissenhofer and Huber Reference Weissenhofer, Huber, Weissenhofer, Huber, Mayer, Pamperl, Weber and Aubrecht2008).
Knowledge of the avifauna of the Golfo Dulce region is summarised in an annotated up-to-date checklist (Tebb Reference Tebb, Weissenhofer, Huber, Mayer, Pamperl, Weber and Aubrecht2008).
Point counts
We established point count locations in eight different habitats: forest interior (FI) and forest margin (FM) of old-growth forest, young secondary forest (YSF), gallery forest connected to closed forest (GC) and isolated (GI), oil palm plantations (PP), fallows (FA) and pastures (PA). For forest types, 10 (FI) and 11 replicate sites (FM, GC, GI) were selected for standardised bird counts (Figure 1). All FI sites were located > 50 m from forest edges within the large forest block of Piedras Blancas National Park. FM sites were located within the transition zone between c.50 m inside the forest and (semi-)open human-dominated habitats. This distance was chosen because edge effects quantified by abiotic parameters (e.g. air temperature, light) and various vegetation features (e.g. tree stem density, canopy closure, understorey density) mostly do not penetrate further into the forest (reviewed by Murcia Reference Murcia1995). In addition, many forest birds apparently do not respond to edge effects at distances > 50 m from the forest edge (e.g. examples in Restrepo & Gómez Reference Restrepo and Gómez1998).
Gallery forests were defined as strips of trees along streams crossing open areas. When in direct contact to closed forest, they were classified as “connected“ (GC), otherwise they were defined as “isolated” (GI). The mean length and width (± SD) of forest strips was 923 (± 1,154.37) m and 62.05 (± 40.33) m for GC sites and 1,974.55 (± 1568.10) m and 21.77 (± 40.33) m for GI sites, respectively. The mean distance (± SD) to the forest margin was 173.73 (± 154.70) m for GC sites and 543.00 (± 141.13) m for GI sites. For all other habitat types (YSF, PP, FA, PA) five replicate sites were selected (Figure 1). All sites were selected based on a vegetation map of the study area (Weissenhofer et al. Reference Weissenhofer, Huber, Koukal, Immitzer, Schembera, Sontag, Zamora, Weber, Weissenhofer, Huber, Mayer, Pamperl, Weber and Aubrecht2008).
Field work was conducted by IR between 1 November 2008 and 4 October 2010. At each study site, 10-min point counts were performed from dawn (05h00) until 10h00 (e.g. Blake Reference Blake1992) using 8 x 40 binoculars. All Black-cheeked Ant-tanagers seen or heard within a radius of c.25 m around the census point were recorded. Each day, bird counts were carried out at 8–12 census points. To avoid temporal bias in detection rates of birds with time of day, census points were visited in a rotating order (Blake Reference Blake1992). Each census point was visited 10–12 times in October–February 2008/2009 and 2009/2010 (both dry season) and in June-September 2009 and 2010 (both rainy season).
Habitat variables
To evaluate the importance of edge effects on the occurrence of Black-cheeked Ant-tanager in old-growth forest sites, forest cover at all FI, FM and YSF sites was quantified within a radius of 200 m around census points. We used a digital vegetation map of the study area (Weissenhofer et al. Reference Weissenhofer, Huber, Koukal, Immitzer, Schembera, Sontag, Zamora, Weber, Weissenhofer, Huber, Mayer, Pamperl, Weber and Aubrecht2008) which was updated using aerial photographs from 2009 (OpenLayers plugin of Quantum GIS 1.7.2) and ground surveys to calculate the percentage of old-growth forest within the 200 m radius around the census points using the software package ArcMap 9.0 (ESRI). We prefer to use the term “old-growth forest” (classified as primary forest in Weissenhofer et al. Reference Weissenhofer, Huber, Koukal, Immitzer, Schembera, Sontag, Zamora, Weber, Weissenhofer, Huber, Mayer, Pamperl, Weber and Aubrecht2008) because it cannot be excluded that individual trees were selectively extracted at some of our sites some decades ago.
To describe vegetation structure at FI, FM and YSF census points, we measured or estimated tree density, canopy closure and understorey density. Tree density was measured as the number of trees (with diameter at breast height > 10 cm) within a radius of 25 m around the census point. To estimate canopy closure, four photographs were taken of the canopy in four different directions from the census point at the margin of the 25 m radius. Canopy closure was estimated for each photograph to an accuracy of 10% and then quantified for every census point as the mean of the four estimates. To estimate understorey density, a photograph was taken from breast height towards the ground at eight randomly selected points within the radius of 25 m around census points. For each of the eight points, understorey density was estimated as the percentage (to an accuracy of 10%) of the photograph covered by vegetation. Understorey density at census points was then quantified as the mean of the eight values.
Distance sampling
We used distance sampling to estimate the population density of Black-cheeked Ant-tanager within old-growth forest. In contrast to traditional bird survey methods, distance sampling is a rather simple approach to estimate population density in a defined area (Thomas et al. Reference Thomas, Buckland, Rexstad, Laake, Strindberg, Hedley, Bishop, Marques and Burnham2010). We recorded birds along line transects and measured the perpendicular distance between the transect line and all birds detected visually and acoustically with a rangefinder (Nikon Laser 800 S). There are three main assumptions that have to be fulfilled to achieve reliable density estimates: (1) objects on the transect line are detected with certainty, (2) objects are detected before moving and (3) distance measurements are exact (Thomas et al. Reference Thomas, Buckland, Rexstad, Laake, Strindberg, Hedley, Bishop, Marques and Burnham2010).
Transects for distance sampling should be random and straight and distance sampling is based on the assumption that the location of detected animals is independent of the positions of the transect lines, which becomes critical if transects are placed along trails (Thomas et al. Reference Thomas, Buckland, Rexstad, Laake, Strindberg, Hedley, Bishop, Marques and Burnham2010). We had to use the network of narrow (c.1 m) trails (Figure 2) for the bird survey due to the steep terrain in our study area (Hiby and Krishna Reference Hiby and Krishna2001, Gale and Thongaree Reference Gale and Thongaree2006). When conducting distance sampling along transect lines, usually 5% of the measured distances are truncated, because they contribute little to the abundance estimate (Buckland et al. Reference Buckland, Anderson, Burnham, Laake, Borchers and Thomas2001). We truncated our distance measurements of detected birds at 60 m. In fact, only seven (4.5%) of all detections of all detections during the two survey periods were beyond 60 m.
There were two surveys to estimate the population density of Black-cheeked Ant-tanagers in the study area. The first survey was conducted from February to April 2009 by JF and MK, the second survey from November 2010 to January 2011 by JSC. The whole trail network was divided in subunits which were each surveyed 9–28 times in 2009 and 8–12 times in 2010/2011. This resulted in a total of 168 km transects walked in 2009 and 95 km in 2010/2011. Surveys were done between dawn (05h30) and 12h00 and between 15h00 and dusk (18h00).
Territory mapping
For all Black-cheeked Ant-tanagers detected during transect walks between November 2010 and January 2011, location was determined with a GPS device. Quantum GIS map (Quantum GIS 1.7.3; Quantum GIS Development Team 2011) was then used to visualise the spatial distribution of records and define territories based on spatially clustered observations. When clustered observations were over 50 m apart from each other and/or individuals were detected on the same transect at approximately the same time in different locations, observations were assigned to two different territories. Single observations of solitary birds were not classified as territories. They may represent juvenile birds still searching for new territories or non-breeding “floaters” rather than birds occupying a territory. However, although we additionally considered behaviour indicating a territory border (e.g. where birds stopped moving in their initial direction), a partly arbitrary interpretation of the spatial distribution of territories cannot be avoided when using such an approach without marking the birds (e.g. by colour rings).
Data analysis
To compare preferences of Black-cheeked Ant-tanager for different habitats (FI, FM, YSF, GC, GI, PP, FA, PA), we compared the mean number of birds detected per point between all habitats. Abundance per point was quantified as the mean number of birds recorded per 10-min count. Because birds were only recorded at FI and FM sites (see Results), a t-test calculated with the software Statistica 7.1 (Statsoft Inc. 2005) was used to test for differences in abundance only between these two forest types.
To test for effects of forest cover, tree density, canopy closure and understorey density on the presence of Black-cheeked Ant-tanager, univariate logistic regressions were calculated with the software Statistica 7.1. Subsequently, generalised linear models (GLMs) with binomial error distribution and logit-link function were used to evaluate effects of habitat variables on the species’ occurrence at points. Variables were first tested for multicollinearity. In case of significant correlations between habitat variables only the variables that proved to have a stronger effect on Black-checked Ant-tanager occurrence were considered in univariate logistic regressions. Then GLMs including all remaining variables (standardised) and possible subsets, their corrected Akaike information criterion (AICc) values, Δ AICc values and AICc weights (a relative measure of support for a model) were calculated with the software R (Barton Reference Barton2013, R Development Core Team 2013). A higher AICc weight indicates a higher relative likelihood of a model compared to alternative models (Wagenmakers and Farrell Reference Wagenmakers and Farrell2004). Subsequently, a model averaging was calculated for the `top model set` (models with Δ AICc < 4). We did not consider the small gallery forest strips (GC, GI) and all non-forest habitats (PP, FA, PA), where we never recorded Black-cheeked Ant-tanagers, to avoid zero inflation in our models.
Based on the measured perpendicular distances between detected birds and the transect lines, the population density of the Black-cheeked Ant-tanager was estimated by the software Distance 6.0, which fits a detection function to the observed distances (Bibby et al. Reference Bibby, Jones and Marsden1998, Thomas et al. Reference Thomas, Buckland, Burnham, Anderson, Laake, Borchers, Strindberg, El-Shaarawi and Piegorsch2002). The analysis started with a truncation of the data at a distance of 60 m from the transect line. Due to the topography and the dense forest understorey, visual and acoustical detections are very unlikely at distances > 60 m and resulting distance measurements are too inaccurate.
We used four of the models provided by Distance 6.0 (uniform key with cosine adjustments, half-normal key with cosine adjustments, half-normal key with Hermite polynomial adjustments, hazard-rate key with simple polynomial adjustments) which perform best in many studies (Thomas et al. Reference Thomas, Buckland, Rexstad, Laake, Strindberg, Hedley, Bishop, Marques and Burnham2010). To select the two models that best fit our data, quantil-quantil plots were used by comparing the detection functions of the models with the actual distribution of our distance data (Thomas et al. Reference Thomas, Buckland, Rexstad, Laake, Strindberg, Hedley, Bishop, Marques and Burnham2010). Selected models showed the best fit of the data points with the detection function based on a visual evaluation. This model selection was additionally cross-checked using the ranking of models according to the Akaike information criterion (Thomas et al. Reference Thomas, Buckland, Rexstad, Laake, Strindberg, Hedley, Bishop, Marques and Burnham2010). The population density was estimated separately for the two survey periods 2009 and 2010/2011, and by combining data from both survey periods. Because differences in the size of Black-cheeked Ant-tanager groups between both survey periods could potentially result in a difference in detectability, we tested if the number of birds per observation differed between both survey periods using a Mann-Whitney U-test, calculated with Statistica 7.1 (Statsoft Inc. 2005).
Results
Habitat preferences
Our point census data from different habitats ranging from forest interior towards highly modified land-use systems clearly demonstrate that the Black-cheeked Ant-tanager is restricted to the interior and the margin of old-growth forest. No birds were detected at YSF, GC, GI, PP, FA and PA sites. Although the mean number of birds counted per census point was nearly twice as high at FI (mean number of birds per 10 min count ± SD = 0.32 ± 0.28 birds) than at FM sites (0.19 ± 0.19 birds), it did not differ significantly between habitats (t = 1.26, df = 19, P = 0.223).
Effects of forest cover and vegetation structure at old-growth forest sites
Calculated logistic regressions indicate that the likelihood of Black-cheeked Ant-tanager occurrence at forest census points increased significantly with increasing forest cover (χ 2 = 6.23, P = 0.013; Figure 3a), increasing tree density (χ 2 = 7.16, P = 0.007; Figure 3b) and increasing canopy closure (χ 2 = 5.46, P = 0.019; Figure 3c). Only understorey density did not affect the species’ occurrence (χ 2 = 2.28, P = 0.131).

Figure 3. Univariate logistic regressions showing effects of (a) forest cover, (b) tree density and (c) canopy closure on the occurrence of Black-cheeked Ant-tanager at forest census points (FI and FM sites).
Because tree density and canopy closure were highly correlated (r = 0.75, P < 0.001), canopy closure was excluded from the subsequent GLMs due to its weaker effect on the occurrence of Black-cheeked Ant-tanager according to univariate logistic regressions. GLMs calculated with the three remaining habitat parameters and all possible subsets indicate a prominent effect of forest cover on Black-cheeked Ant-tanager occurrence. This variable remained in all three best models (Table 1) and was the variable with the highest explanatory power according to the model averaging approach (Table 2).
Table 1. Results of GLMs (with binomial error distribution and logit-link function) calculated to evaluate effects of forest cover, tree density and understorey density (all standardised) on the occurrence of Black-checked Ant-tanagers at forest census points (FI, FM and YSF sites). GLMs were calculated including all predictor variables and all possible subsets and then ranked according to their corrected Akaike values (AICc). Furthermore, the Δ AICc values and the AICc weights are provided for each model.
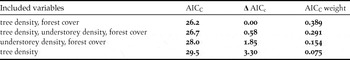
Table 2. Results of model averaging to quantify effects of each variable on the occurrence of Black-cheeked Ant-tanagers at census points.
Estimating Black-cheeked Ant-tanager density by distance sampling
During distance sampling, Black-cheeked Ant-tanagers were detected 101 times with 185 birds in 2009 and 53 times with 102 birds in 2010/2011. The mean group sizes of 1.85 (SD ± 0.96) birds in 2009 and 1.93 (± 0.83) birds in 2010/2011 did not differ significantly (Mann-Whitney U-test: U = 2433.50, P = 0.407) between the two survey periods.
The two distance sampling models pre-selected through the quantil-quantil plots and the Akaike information criterion (AIC) are the hazard rate simple polynomial model and the half normal cosine model; only the difference between AIC values of both models for the 2009 survey was > 2 (Table 3). Some of the resulting detection probability curves underestimated the number of observed birds close to the transect line and overestimated the number of detected birds in the next distance band (Figure 4a-b, e-f). Only the distribution of the detection distances of the 2010/2011 survey is predicted very precisely by the calculated detection probability curves (Figure 4c-d).
Table 3. Akaike information criterion (AIC) values for two different models used to estimate the population density (birds/km2) of Black-cheeked Ant-tanager for the survey periods 2009 and 2010/2010 and for both survey periods combined.
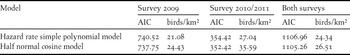
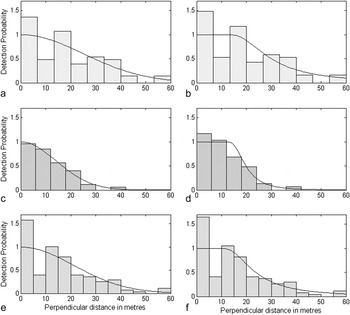
Figure 4. Histograms of detection distances for the transect surveys conducted in (a-b) 2009 and (c-d) 2010/2011 and (e-f) for a combination of both survey periods. Also shown are the corresponding fits of models predicting the detection probability with increasing distance from the transect line using a truncation at 60 m distance from the transect line. Detection curves in graphs on the left side are predicted by hazard rate simple polynomial model and on the right side by half normal cosine model.
Predicted densities were 22.0% (hazard rate simple polynomial model) and 31.4% (half normal cosine model) higher for 2010/2011 than 2009. When data from both survey periods were combined, population densities reached values intermediate between the densities estimated for the first and second survey periods. Five of the six models estimated Black-cheeked Ant-tanager densities between c.21 and 27 individuals per km2. A much higher density of c.35.6 birds per km2 was estimated for 2010/2011 by the half normal cosine model (Table 3).
Estimating Black-cheeked Ant-tanager density by territory mapping
In total 12 territories were identified in our study area. Three single observations were not assigned to a territory (Figure 2). Assuming that territories are occupied by a pair or a pair and at least one juvenile bird, population densities of 17 and 25 birds per km2, respectively, were estimated by territory mapping for our study area of 1.45 km² (100 m buffer zone on both sides of the transects). Only one territory and one single observation were located in old-growth secondary forest, all other observations of Black-cheeked Ant-tanager were from the interior of old-growth forest or its margin (Figure 2).
Discussion
The Black-cheeked Ant-tanager – a forest interior species
As emphasised earlier (Aubrecht Reference Aubrecht, Weissenhofer, Huber, Mayer, Pamperl, Weber and Aubrecht2008, BirdLife International 2014), our study clearly showed that the occurrence of the Black-cheeked Ant-tanager is restricted to the interior and margin of primary and old-growth secondary forest. The species does not move into younger secondary forests and gallery forest strips, even when they are connected to closed forest. Although the Black-cheeked Ant-tanager can be frequently found close to the forest margin (this study; Seaman and Schulze Reference Seaman and Schulze2010), our data showed that its occurrence at forest census points was positively related to the percentage of forest cover within a radius of 200 m. This indicates that the species tends to avoid forest edges. The species’ preference for old-growth, largely undisturbed forest is further emphasised by our finding that its likelihood of occurrence increased with increasing canopy closure. However, a preference for forest sites with a higher density of trees (> 10 cm dbh), typical for forest areas or sites disturbed some decades ago, could indicate a weak preference for slightly disturbed sites. This would be partly in accordance with Slud (Reference Slud1964) who noted that the species prefers tall secondary growth and broken forests to the interior of unbroken forests. In our study at least one territory could be located in old secondary forest. If occasional observations of birds in beachfront scrub and palms adjacent to Corcovado National Park (Capper et al. Reference Capper, Clay and Lowen1998) or in other disturbed habitats at the margin of closed forests (e.g. the botanical garden of the Tropical Research Station La Gamba; pers. obs.) refer to territorial birds. More likely such records may refer to dispersing birds or individuals only occasionally exploiting attractive resources in habitats at the forest margin, which otherwise may be unsuitable for the species.
Population density estimates using distance sampling
Distance sampling is a method widely used to estimate the population density of species in challenging field conditions (Thomas et al. Reference Thomas, Buckland, Rexstad, Laake, Strindberg, Hedley, Bishop, Marques and Burnham2010). It is frequently applied to estimate the population density of endangered low density species (e.g. Heydon and Bulloh Reference Heydon and Bulloh1997, Morrogh-Bernard et al. Reference Morrogh-Bernard, Husson, Page and Rieley2003, Hoekman et al. Reference Hoekman, Moynahan, Lindberg, Sharman and Johnson2011) including understorey forest birds (e.g. Jiménez et al. Reference Jiménez, Londoño and Cadena2003, Shankar Raman Reference Shankar Raman2003). During both of our survey periods the number of Black-cheeked Ant-tanager observations was higher than the minimum number of 50 detections recommended for estimating population densities with the software Distance (Buckland et al. Reference Buckland, Anderson, Burnham and Laake1993; but see Oostra et al. Reference Oostra, Gomes and Nijman2008).
Our distance sampling data from the survey period 2010/2011 do not indicate that the number of detected birds in the first distance band was affected by the forest trails which were used as transect lines. Additionally, the trail did not obviously act as a barrier to bird movements. Frequently, Black-cheeked Ant-tanagers were observed crossing the small paths (pers. obs.). In contrast, the distribution of measured detection distances from the survey in 2009 (and in consequence the data combining distances sampled in 2009 and 2010/2011) is characterised by an overrepresentation of records in the first distance band and fewer birds observed than expected in the second distance band. However, we do not believe that the unexpectedly high number of Black-cheeked Ant-tanagers detected in the first distance band during the 2009 distance sampling is caused by using forest trails as transect lines. Rather, it may be a result of territorial behaviour during the breeding season which lasts from mid-January to May (Sandoval and Gallo Reference Sandoval and Gallo2009), the time period of our 2009 survey (February-April). During the breeding season, birds may approach an observer entering their territory more frequently and, therefore, may move more often towards the transect line before detection. The difference between the two surveys cannot be explained by a higher number of singing birds detected close to the transect line during the breeding season. In fact, only nine detections (of 101) during the breeding season in 2009 refer to singing birds only detected acoustically. Furthermore, all of these birds were detected at distances of more than 10 m from the transect line. However, the number of acoustically detected singing birds was obviously too small to affect the shape of the detection curve. The 2010/2011 detection curves had a high detection rate from the zero line up to over 10 m and then decreased rapidly. The resulting relatively broad shoulder is a feature essential for the accuracy of population density estimation (Buckland et al. Reference Buckland, Anderson, Burnham and Laake1993). For this reason, the population density estimated by distance sampling for the 2010/2011 survey may be more reliable. However, in fact, both estimates for 2010/2011 and 2009 correspond well to the densities estimated by the number of territories identified in our study area in 2010/2011 (this study) and 2009 (Fricke and Katz unpubl. data).
Population density estimated by territory mapping
Based on territory mapping in 2010/2011, a total of 12 breeding pairs was estimated for our study area, which corresponds to 17–25 individuals in our 1.45 km2 study area when assuming 2–3 birds per family group (Aubrecht Reference Aubrecht, Weissenhofer, Huber, Mayer, Pamperl, Weber and Aubrecht2008). In 2009 the density predicted by distance sampling (21–24 birds) was similar to that achieved by territory mapping (eight territories ≈ 16–24 individuals; Fricke and Katz unpubl. data).
Other studies (e.g. Gale et al. Reference Gale, Round, Pierce, Nimnuan, Pattanavibool and Brockelman2009, Gottschalk and Huettmann Reference Gottschalk and Huettmann2011, Shankar Raman Reference Shankar Raman2003) comparing territory mapping with point or line distance sampling methods in tropical forests, as well as in forests and open landscapes in the temperate zone, showed that territory mapping produced similar results to the less labour-intensive line distance sampling (Gottschalk and Huettmann Reference Gottschalk and Huettmann2011, Shankar Raman Reference Shankar Raman2003).
The spatial distribution of territories identified in 2009 (Fricke and Katz unpubl. data) and 2010/2011 (this study) was remarkably similar. Several 2009 and 2010/2011 territories overlapped or were located close to each other. This could indicate a minor turnover of territory owners or that territory sites have to fulfill specific requirements. A low turnover of territory owners and a rather stable spatio-temporal pattern of territories was already recorded for other understorey rainforest birds (Greenberg and Gradwohl Reference Greenberg and Gradwohl1986, Stouffer Reference Stouffer2007).
Comparison with previous population size estimates
Based on the assessment of known records, descriptions of abundance and range size, the current population size estimated by IUCN for the Black-cheeked Ant-tanager is 10,000–19,999 individuals (BirdLife International 2014). However, on the distribution map the species is marked as possibly extinct in the area of the Piedras Blancas National Park (IUCN 2012). In fact, our study documented that the species appears to be still abundant in Piedras Blancas National Park. Therefore, when assuming that the species occurs in any old-growth forest in all three protected areas, Corcovado National Park, Golfito Faunal Refuge and Piedras Blancas National Park, the actual distribution range may cover an area of about 592 km2. Considering an average density of 24–27 individuals per km2 (as estimated by our distance sampling study), the current population size may be between 12,432 and 20,720 birds.
Conservation implications
The remaining distribution range of the Black-cheeked Ant-tanager is exclusively located within protected areas of Pacific lowland rainforest. Therefore, we do not expect an ongoing decline in range and population area (but see BirdLife International 2014). However, in particular the species’ actual status in the Golfito Faunal Reserve should be assessed (Wege and Long Reference Wege and Long1995). Further sites, which should be surveyed for remaining populations, include the forest area of the Golfo Dulce Forest reserve (IUCN protection category V). Although the species’ population size may be currently stable, its small distribution still justifies its current classification as ´Endangered` (BirdLife International 2014).
As documented by our study, Black-cheeked Ant-tanagers tend to avoid forest edges and do not appear to move into highly disturbed forests, but can occasionally be found in old secondary forest. This emphasises that any significant forest disturbance and fragmentation within its remaining distribution will most likely result in local extinctions which can hardly be compensated for by re-colonisation. Gallery forest strips connecting remaining forest fragments can improve landscape connectivity for several forest species (Seaman and Schulze Reference Seaman and Schulze2010). Although Black-cheeked Ant-tanagers were not recorded in these forest strips by our study, it remains to be proved whether they facilitate movements on a landscape scale. Even very rare movements of perhaps non-territorial dispersing birds, which may remain largely undetected in such matrix habitats, can facilitate the re-colonisation of small isolated forest patches as indicated for small rainforest fragments in Brazil (Stouffer et al. Reference Stouffer, Johnson, Bierregaard and Lovejoy2011).
However, full protection of the remaining lowland forest at the southern Pacific slope will remain the only way to successfully protect its unique avifauna. There are still opportunities to expand the existing protected forest areas in the Golfo Dulce Region (e.g. compare forested areas indicated on vegetation map in Weissenhofer et al. Reference Weissenhofer, Huber, Koukal, Immitzer, Schembera, Sontag, Zamora, Weber, Weissenhofer, Huber, Mayer, Pamperl, Weber and Aubrecht2008) and thereby improve the conservation status for the Black-cheeked Ant-tanager and other lowland forest birds. Costa Rica has a high reputation for preserving its biodiversity and is setting standards for conservation networks (13.74% of the country is strictly protected), which play an important role for the protection of threatened species (Sánchez et al. Reference Sánchez, Criado, Sánchez and Sandoval2009). Hopefully, the endemic Black-cheeked Ant-tanager will also benefit from this exemplary conservation policy. Considering that the Black-cheeked Ant-tanager apparently represents a key species in mixed species flocks, other bird species may benefit too, which would otherwise face the risk of local extinction as documented for Red-crowned Ant-tanager Habia rubica, a key species for maintaining cohesion and stability of mixed-species flocks in coastal Atlantic forest of southern Brazil (Develey and Peres Reference Develey and Peres2000). The disappearance of this species of ant-tanager seems to extirpate this type of association locally. Therefore, conservation plans for nuclear species (such as the Black-cheeked Ant-tanager) and their habitats should be a high priority (Maldonado-Coelho and Marini Reference Maldonado-Coelho and Marini2004).
Acknowledgements
We would like to thank Andres Felipe Reyes Paez for his encouragement in the field and the Tropical Research Station La Gamba and its team, particularly Maria Luisa Sánchez Porras and Roy Sánchez Jimenez, for facilitating our stay in Costa Rica. Research Permission was kindly granted by the Ministry of Environment and Energy (MINAE), Costa Rica. We would further like to thank Werner Huber, Anton Weissenhofer and Daniel Schaber for helping to apply for the research permit. Claudia Schütz kindly provided the data on the forest cover around bird census points. Field work of JC and IR was partly supported by KWA research scholarships of the University of Vienna. We also like to thank Philip Stouffer, an anonymous reviewer and the editor for their valuable comments, which significantly improved our manuscript.


