


Introduction
The European Commission (2011) published a 2020 biodiversity strategy, with a headline target of “halting the loss of biodiversity and the degradation of ecosystem services in the EU [European Union] by 2020, and restoring them in so far as feasible, while stepping up the EU contribution to averting global biodiversity loss”. It furthermore contained a vision for 2050 that “European Union biodiversity and the ecosystem services it provides – its natural capital – are protected, valued and appropriately restored for biodiversity's intrinsic value and for their essential contribution to human well-being and economic prosperity, and so that catastrophic changes caused by the loss of biodiversity are avoided”. Under the “Birds Directive” (latest revision: EU directive 2009/147/EC), native bird species in the European Union are protected. To achieve this, each EU member has designated a network of Special Protection Areas (SPAs). In the Netherlands, these SPAs are part of the Natura 2000 network of protected sites that may be designated for a particular species because they are important to that species during or outside its breeding season, or both. The network of SPAs is intended to ensure that most of the population of the species concerned is protected.
The nominate subspecies of the Black-tailed Godwit Limosa limosa breeds predominantly in Europe. As an estimated 50% of the European population of this subspecies breeds in the Netherlands (Beintema et al. Reference Beintema, Moedt and Ellinger1995, Rijksinstituut voor Volksgezondheid en Milieu 2004), the country has a major responsibility for its conservation. Substantial declines in the nominate subspecies reported from all over Europe since the 1990s prompted BirdLife International to classify the species as ‘Near-threatened’ on a world scale (Anonymous 2006). The trend for the subspecies L. l. melanuroides, which breeds in eastern Asia, is not clear. The only population reported to be increasing is the small population of the subspecies L. l. islandica, breeding mainly in Iceland (Prater Reference Prater1975, Gill et al. Reference Gill, Norris, Potts, Gunnarsson, Atkinson and Sutherland2001, Reference Gill, Langston, Alves, Atkinson, Bocker, Vieira, Crockford, Gélinaud, Groen, Gunnarsson, Hayhow, Hooijmeijer, Kentie, Kleijn, Lourenco, Masero, Meunier, Potts, Roodbergen, Schekkerman, Schröder, Wymenga and Piersma2007).
The Black-tailed Godwits breeding in the Netherlands belong to the flyway population of Western Europe and western Africa, which is among the four most threatened shorebird flyway populations in the Palearctic (Stroud et al. Reference Stroud, Baker, Blanco, Davidson, Delany, Ganter, Gill, González, Haanstra, Morrison, Piersma, Scott, Thorup, West, Wilson, Zöckler, Boere, Galbraith and Stroud2006). Interestingly, this flyway population breeds largely in agricultural grassland (i.e. meadows), alongside several other meadow bird species. Its decline is mainly the result of changes in meadow management and the associated loss of the open landscape, conversion to other land-uses and – important in the Netherlands – a lowering of the water table (Beintema et al. Reference Beintema, Moedt and Ellinger1995, Kleijn and van Zuijlen Reference Kleijn and van Zuijlen2004, Melman et al. 2008, van der Vliet et al. Reference van der Vliet, Schuller and Wassen2008). Modern agricultural management thus compromises this flyway population, resulting in a recruitment level that is too low to ensure a stable population (Kruk et al. Reference Kruk, Noordervliet and ter Keurs1997, Schekkerman and Müskens Reference Schekkerman and Müskens2000, Schekkerman et al. Reference Schekkerman, Teunissen and Oosterveld2008, Roodbergen et al. Reference Roodbergen, van der Werf and Hötker2012). In their review, Roodbergen et al. (Reference Roodbergen, van der Werf and Hötker2012) concluded that to ensure a stable population, each breeding godwit pair should fledge between 0.6 and 1.6 birds each year. They showed, however, that nowadays only between 0.36 and 0.40 birds fledge per breeding pair each year. Because of the observed population decline and the international importance of the Netherlands for this species, the Black-tailed Godwit has become the flagship species of Dutch research on meadow birds (Teunissen et al. Reference Teunissen, Altenburg and Sierdsema2005).
Despite the flagship status of the species, the Netherlands has not designated SPAs for the breeding period of the Black-tailed Godwit, with the result that most of the species’ breeding meadow habitat in the Netherlands is not protected under EU legislation (although several sites may have a provincial protection status). This paradox arises because the Black-tailed Godwit is listed in Annex II of the Birds Directive, which contains species that may be hunted within the EU (including most waterbird species). Only Annex I contains fully protected species. Under Dutch legislation, to formally qualify as an SPA for an Annex II species, a site in the Netherlands should harbour at least 1% of the relevant flyway population of a particular colony-breeding species, or all SPAs combined should contain at least 25% of the total Dutch breeding population of a species on the national Red List. Although the Black-tailed Godwit qualifies for the Red List (van Beusekom et al. Reference van Beusekom, Huigen, Hustings, de Pater and Thissen2005), no site in the Netherlands fulfils one of the other criteria; this is why the internationally important breeding population in the Netherlands has no formal protection through the network of SPAs. The only sites the Netherlands has designated as SPAs for species listed in the Birds Directive are areas that were already designated protected nature reserves and were at least 100 ha in size (Ministerie van Landbouw, Natuurbeheer and Visserij 2000). No SPAs have been designated for the breeding population of the Black-tailed Godwit outside nature reserves, despite the option to do so in the EU directive, because the Dutch meadows in which the species breeds are mostly privately owned.
In this paper, we analyse whether the conservation objectives set for Black-tailed Godwit in the Netherlands through the Europe 2020 strategy are feasible, given the current threats to the species’ breeding habitat. Taken together, the threats are likely to adversely affect the habitat required by Black-tailed Godwit and the landscape’s suitability for the species, as they often lead to changes in key landscape-level factors for Black-tailed Godwit (Rijksinstituut voor Volksgezondheid en Milieu 2004): groundwater level (which affects food availability), land-use (which indicates the suitability of a habitat to a species’ body morphology), and construction of buildings and roads (which impact on openness and visibility). Together, these three habitat requirements affect which fields the birds use for foraging and nesting and the overall survival rate of parents and nests (Beintema et al. Reference Beintema, Moedt and Ellinger1995, Rijksinstituut voor Volksgezondheid en Milieu 2004, Gill et al. Reference Gill, Langston, Alves, Atkinson, Bocker, Vieira, Crockford, Gélinaud, Groen, Gunnarsson, Hayhow, Hooijmeijer, Kentie, Kleijn, Lourenco, Masero, Meunier, Potts, Roodbergen, Schekkerman, Schröder, Wymenga and Piersma2007, van der Vliet Reference van der Vliet2013). We analyse the feasibility of set conservation objectives by identifying the breeding distribution of the Black-tailed Godwit and its current core breeding areas and the areas in which the highest numbers of breeding pairs may be expected in 2020. To identify the core breeding areas we used a regression model that relates relative breeding densities of Black-tailed Godwit to the three key habitat requirements. We conclude this paper by making policy recommendations for the breeding areas of this species. As such, this study aims at contributing to firmer and more efficient protection of this flagship species.
Methods
Relating habitat requirements to relative godwit densities in 2000
We applied an information-theoretic (IT) approach (Burnham and Anderson Reference Burnham and Anderson2002) to model the relative contribution of landscape openness, land-use and groundwater level to relative densities of Black-tailed Godwit, using large, high quality and spatially explicit datasets of bird densities and abiotic and landscape characteristics in the Netherlands. We used Generalized Linear Models (GLMs) with a Poisson error distribution and a log-link function in PASW Statistics 18 to fit models based on all possible combinations of these three explanatory variables to the relative godwit density data. Sovon Vogelonderzoek Nederland (2002) has defined relative density as the probability of recording a certain species within a certain period at a certain site.
We rescaled the habitat datasets that did not match the grid of 500 x 500 m cells of the bird data. Using GLMs, we assessed the variation of one habitat dataset explained by each of the two other habitat datasets (note that we were unable to calculate correlation coefficients because the land-use data were nominal and the openness data were ordinal). We found that the dependency between land-use and openness was c.30 %. The dependency is partly attributable to the fact that certain types of land-use (such as forest) inherently result in a more closed landscape. Dependency between groundwater and openness, however, was not large. We calculated a single best model after applying criteria set out by Anderson et al. (Reference Anderson, Link, Johnson and Burnham2001). The full model explained 32 % of the variance in godwit density. The variance explained by the three requirements was 8% for landscape openness, 12% for land-use and 5% for groundwater level (van der Vliet Reference van der Vliet2013).
Godwit density data in 2000
As input map we used the most recent nationwide relative density map from the most recent breeding bird surveys (Sovon Vogelonderzoek Nederland 2002), conducted during the breeding season (spring) when the Black-tailed Godwit is bold and thus easy to survey. Volunteers had collected the input data for these relative density maps between 1998 and 2000 per 5-km grid square, subdivided into 25 1-km grid squares. Per 5-km square, eight 1-km squares formed a fixed pattern in which the sampling was concentrated. The eight squares were surveyed twice during the breeding season for exactly one hour, using a standardised protocol for all bird species and individuals that showed behaviour indicative of breeding (van Turnhout and Vogel Reference van Turnhout and Vogel1997). To calculate the relative density for all 17 non-surveyed 1-km squares, Sovon Vogelonderzoek Nederland (2002) used kriging techniques: they interpolated the field data from the 12 nearest surveyed 1-km squares in the fixed grid with the same land-use (regardless of whether there was a record of the species in these squares). Sovon Vogelonderzoek Nederland (2002) set the upper limit for this kriging distance at 25 km, but in most cases the 12 squares were already available within 4 km. For Black-tailed Godwit, the match between kriged and actual data is positive (box 3 given in Foppen et al. Reference Foppen, van Kleunen, Loos, Nienhuis and Sierdsema2002), indicating the validity of the kriging method. For more details, see Van Turnhout and Vogel (1997) (for sampling) and Sovon Vogelonderzoek Nederland (2002) (for interpolation).
Habitat input data in 2000
Groundwater level input data were the average spring groundwater levels (ASG), defined as the annual average of three measurements of groundwater level in the period 14 March–14 April each year for a period of eight consecutive years, rounded to the nearest centimetre (van der Gaast et al. 2006). As part of Dutch polder management, throughout most of the country (the major exception being in the south-east, in South Limburg) there is a dense network of piezometers and other equipment for monitoring and controlling groundwater levels. Of the various groundwater levels routinely used in the Netherlands, the most relevant for our study is ASG, because Black-tailed Godwits establish their territories in March–April. No groundwater data were available for urban areas and the hilly area of South Limburg.
For land-use, we distinguished 10 categories from the Dutch land-cover database (LGN) from 1997 (Table 1). A nationwide map of landscape openness was available as a grid of 1-km squares (Dijkstra and van Lith-Kranendonk 2000). To calculate the openness in each grid cell, Dijkstra and van Lith-Kranendonk (2000) first determined the percentages of built-up area and of vegetation taller than 2 m (following Milsom et al. Reference Milsom, Holditch and Rochard1985) in that cell. Then, for each grid cell, they combined both values: this yielded nine classes of openness ranging from 1 (very open) to 9 (very closed).
Table 1. Groundwater level (depth below ground in cm) in relation to land-use category. Within the meadow category, dry meadows and wet meadows were assigned different groundwater levels.
Habitat requirement maps for 2020
Using the ArcGIS 10 software package (www.esri.com), we created one map for each habitat requirement for 2020. All three maps were primarily based on soil properties (we assumed these would remain unchanged in 2020) and land-use scenarios of landscape changes anticipated as a result of continuing urbanisation and other developments (agricultural and other) up to 2020 (Milieu- en Natuurplanbureau 2007). To derive relative Black-tailed Godwit density in 2020 we multiplied the values of each of the three habitat requirement maps by their regression coefficient obtained from our empirical regression model for 2000. We used a grid of 500 x 500 m cells for the entire country (the Netherlands has a land area of 35,054 km²). Figure 1 gives a brief overview of approach and input maps used (with their grid cell sizes). We detail the construction of these three habitat requirement maps separately below.

Figure 1. Flow diagram of process leading to calculated relative density map for Black-tailed Godwit in 2020. Each grey box indicates an input map which was reworked to give a derived input map. Derived input maps were used to create the final three habitat requirement maps. Figures right of the boxes indicate the side of the input map grid cell square in metres. Figures to two decimal places in and near the three arrows on the right are the regression coefficients (as determined for the year 2000) used to calculate the final relative godwit density map for 2020.
Groundwater level map
Future groundwater levels in the Netherlands are probably the most difficult to predict accurately, because in this largely man-made country, the policy is to actively control groundwater levels to meet agricultural requirements and thus the natural processes are mostly subservient to the human needs expressed in political and economic policy. We therefore calculated groundwater level for 2020 in two independent ways, creating two maps, and then averaged the results. We based one groundwater level map on land-use type, and derived the other from soil texture. Land-use type influences the height of the water table, as different vegetation types have different evapotranspiration and soil percolation rates (Dunn and Mackay Reference Dunn and Mackay1995). Soil texture determines soil pore size and thus the infiltration rate of water into the soil (Fetter Reference Fetter1994).
We calculated the first derived future groundwater level map using the land-use map for 2020 (see below). As input, we used the present-day relations between land-use in 1997 (van der Vliet Reference van der Vliet2013) and groundwater level at that location in the year 2000 (Table 1). This yielded a list of groundwater levels per land-use type. It was possible to assign the average value for groundwater level to arable fields, because for this land-use, groundwater level had a normal distribution. This was not the case for the other land-uses. Five land-use types (bulb fields, drift sand and open vegetation, roads and railways, forest and built-up areas) had a log-normal distribution, so for these we used the median groundwater level. For meadows, there were two distinct peaks, which corresponded with wet meadows (in the lower-lying west) and dry meadows (in the higher-lying undulating eastern part of the Netherlands). For both meadow types, we assigned the relevant groundwater level to the median in each peak. Finally, no clear pattern in frequency distribution emerged for three categories of land-use: bare soil, heathland and marsh/reed/bog. For these three land-use types with non-normal distribution of groundwater levels, we used the modal groundwater level. The result was a land-use/groundwater map.
We calculated the soil texture map from the contents of clay and organic matter in the topsoil. For clay content, we used the criteria of US Soil Survey Staff (1998), according to which a soil with more than 50% of clay is clayey, one with less than 10% clay is sandy and intermediate soils are loamy. We classified soils with over 50% of organic matter as peat (Inisheva Reference Inisheva2006) and those containing less than 20% organic matter as mineral; we considered soils with intermediate values to be organic. Combining the clay content and organic matter content maps map resulted in a soil texture map with seven soil classes: sandy, sandy-loam, sandy-clay, loamy, clayey-loam, clayey and peat. We assigned each of the seven classes a groundwater level on the basis of present-day relations between these two soil properties. To derive these relationships we compared the ASG (rounded to the nearest centimetre) from the 2000 groundwater level map and the soil texture map. We then calculated a mean groundwater level for each soil class and assigned it to that soil class (Table 2). This resulted in the soil texture/groundwater map.
Table 2. Groundwater level (depth below ground in cm) in relation to soil texture for the seven derived soil types.
Land-use map
In 2007, in a report entitled Nederland Later (the “Netherlands Later”), the then Netherlands Environmental Assessment Agency published a map of the country, depicting the land-use expected in 2020 given current and expected spatial planning (Milieu- en Natuurplanbureau 2007). We reclassified this map to conform with the 10 land-use types distinguished for 2000 (Table 1). “Bulb field” was not one of the land-use types in the “Netherlands Later” map, so we assumed that in 2020 the size and location of bulb fields would be the same as in 1997. On the published “Netherlands Later” map, Milieu- en Natuurplanbureau (2007) did not make a distinction between different natural habitats, such as marsh, bog or heath land. To correct for this, we used a more detailed unpublished map of nature areas in 2020, produced in 2009 by Planbureau van de Leefomgeving and kindly made available by them. A small minority of cells with designated land-use category “nature” remained without a value after this procedure. We filled them in, using an inverse distance weighted interpolation (IDW). For the interpolation we used the software package ArcView 3.2 (www.esri.com), with its default settings (i.e. 12 sample points and a power of 2).
Openness map
Taking the newly created land-use map for 2020 as a basis, we calculated the openness of the landscape for 2020, following Dijkstra and van Lith-Kranendonk (2000). In each grid cell we calculated openness by the procedure described above for 2000. We derived input data on buildings and vegetation taller than 2 m from the land-use map for 2020.
Core breeding areas for Black-tailed Godwit in 2000 and 2020
All our results are in the form of relative densities (Sovon Vogelonderzoek Nederland 2002). To derive the relative density of the Black-tailed Godwit in 2020, we multiplied the values of all three habitat maps for the three different habitat requirements in 2020 by the regression coefficient for the respective habitat requirement in 2000. For purposes of comparison, we recalculated the relative density of Black-tailed Godwit in 2000 by using the habitat input maps available for that year (van der Vliet Reference van der Vliet2013). Taking into account the uncertainties associated with forecasting and the methods applied here, we identified the core breeding areas for both 2000 and 2020 solely by selecting those cells that had the highest values for the combination of the three habitat requirements (resulting in the highest relative density values).
Results
Figure 2 presents the calculated relative density maps for the Black-tailed Godwit in the Netherlands in 2000 and 2020. In this paper, we focus on core areas, i.e. those with the highest relative densities. These are areas with an optimal combination of the three habitat requirements (groundwater level, land-use and landscape openness) for the Black-tailed Godwit. The five core areas are: 1. Zuidwest Friesland, 2. Waterland north of Amsterdam, 3. the IJssel delta area, 4. Arkemheen and Eem polders, and 5. Groene Hart. In addition, small pockets of suitable habitat occur scattered throughout the country. Comparing the situation in 2000 with that in 2020 reveals little change in the location and size of the core areas (Figure 2).
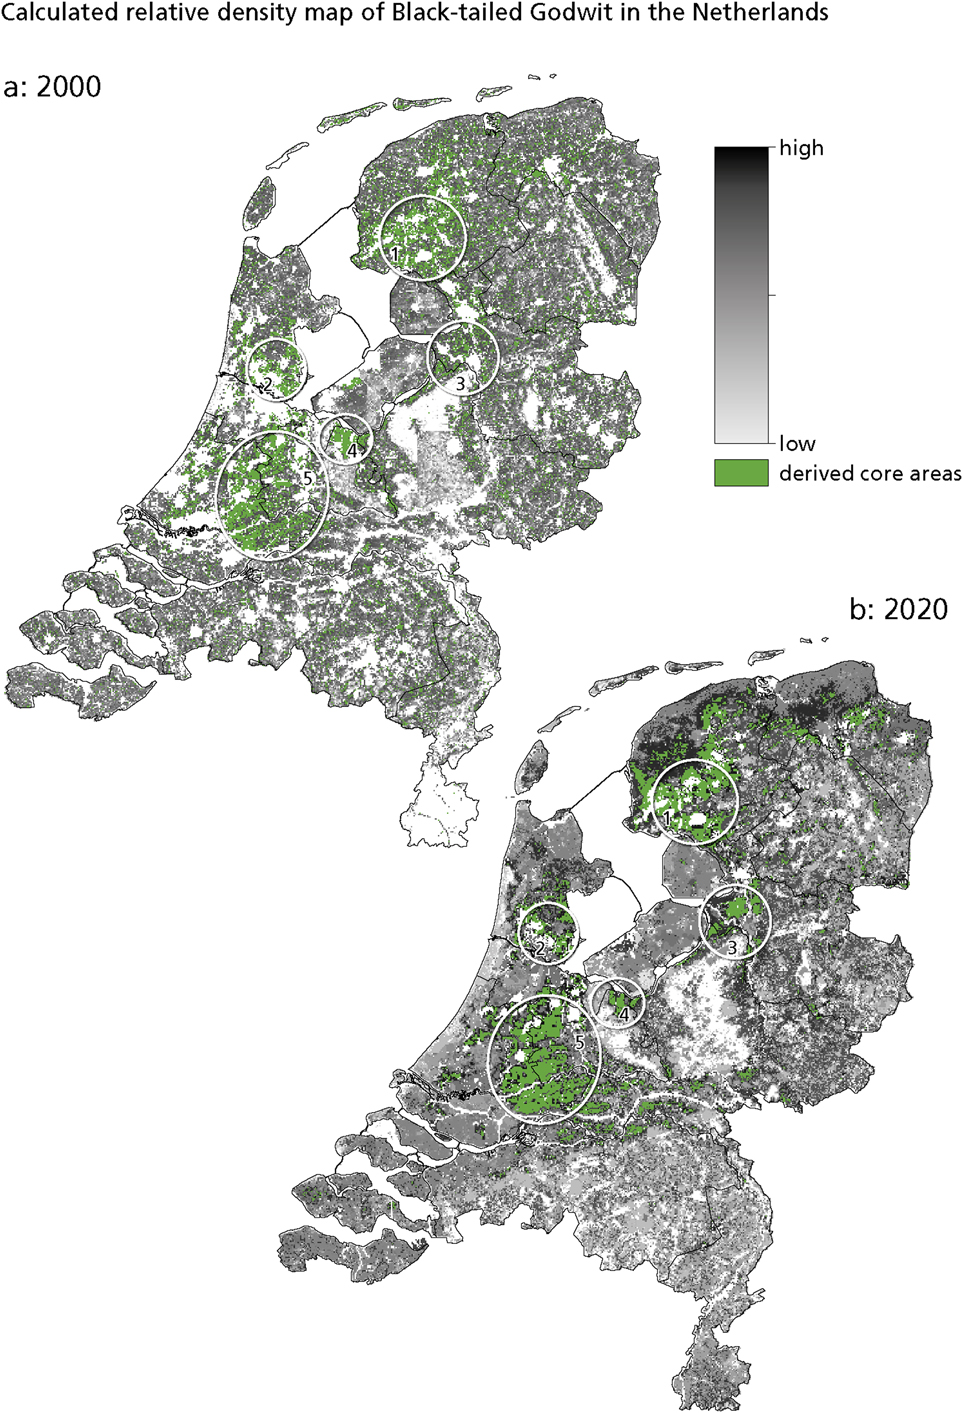
Figure 2. Calculated relative density of Black-tailed Godwit in the Netherlands: (a) in 2000, showing the five derived core areas in circles. 1. Zuidwest Friesland; 2. Waterland; 3. IJssel delta area; 4. Arkemheen and Eem polders; 5. Groene Hart. (b) in 2020. A high relative density means suitable circumstances, while a low value means the opposite.
The core breeding areas overlap scarcely or not at all with the 22 Dutch SPAs designated for the Black-tailed Godwit (Figure 3). All the SPAs designated for Black-tailed Godwit within the core areas are wetlands that function as staging areas for the species. None of these SPAs is designated for the breeding population of Black-tailed Godwit.
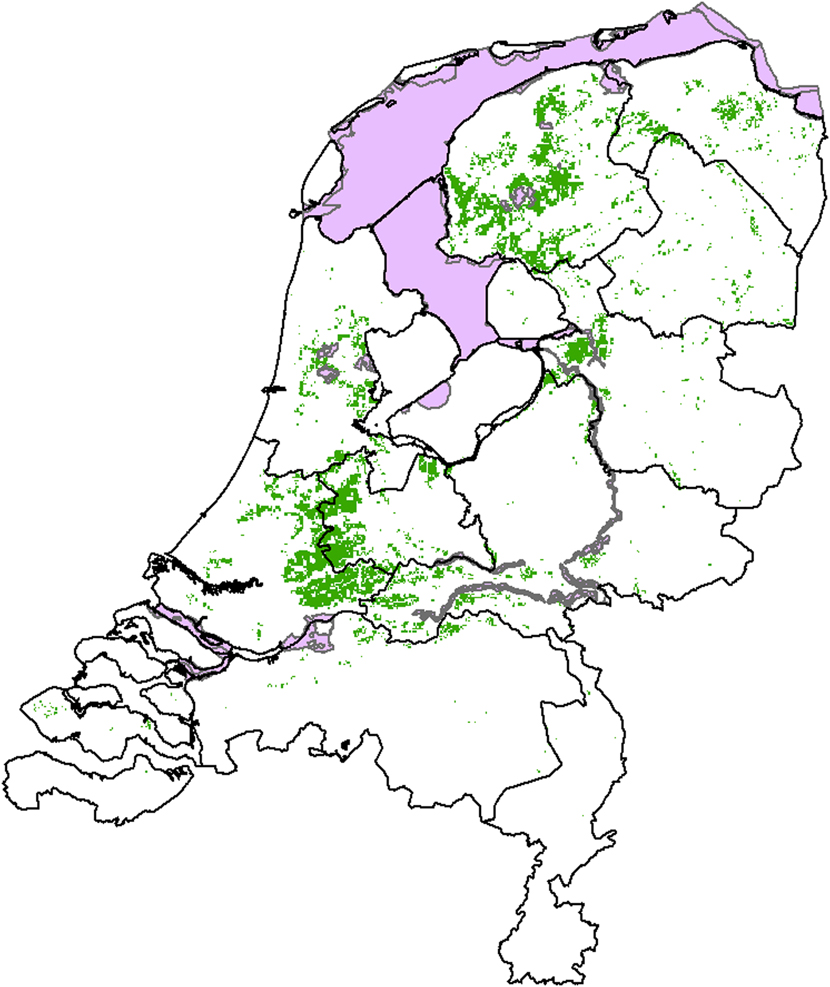
Figure 3. Calculated core areas (green) and designated Special Protection Areas (SPAs (pink)) for Black-tailed Godwit in the Netherlands in 2020. SPAs were taken from the most recent dataset of 30 September 2011 while core areas are taken from Figure 2.
Discussion
Model performance in identifying core areas
In this discussion we focus on the five core areas we identified in the Netherlands for 2020: Zuidwest Friesland, Waterland, the IJssel delta area, Arkemheen and Eem polders, and Groene Hart. All are flat, open landscapes in low-lying Netherlands, where grasslands with high groundwater levels occur. Their locations are similar to those of the core areas defined in a comparable study for Black-tailed Godwit using a model based on a much larger number of input variables (Melman et al. 2008, 2011, 2012, Teunissen et al. Reference Teunissen, Schotman, Bruinzeel, ten Holt, Oosterveld, Sierdsema, Wymenga, Schippers and Melman2012). Because of this similarity, we consider our method using only three habitat requirements sufficiently robust to adequately describe the general breeding habitat of Black-tailed Godwit. Our approach has a clear advantage for exploring future scenarios because it uses only three input variables that require extrapolation. Models needing much more data have the disadvantage that data for all future habitat requirements are much more difficult to obtain.
The drawback of our approach is that we may have overlooked other potentially important habitat variables. Most importantly, we did not take the topography into account, yet the undulations in the landscape may explain the disparities between the actual and calculated maps of the Black-tailed Godwit in the east and south of the Netherlands, where the landscape is hilly. Undulations may result in areas being insufficiently open and hence lead to them not being selected by the Black-tailed Godwit even if they are suitable in other respects. In the northern Pennines, UK, European Golden Plover Pluvialis apricaria was found to show a strong preference for nesting on flat ground rather than on slopes. Also, nests on flat ground had significantly higher rates of survival than those on slopes (Whittingham et al. Reference Whittingham, Percival and Brown2002). It is reasonable to assume that in the Netherlands, too, breeding birds require openness in order to see potential predators in time and be able to drive them off (Dyrcz et al. Reference Dyrcz, Witkowski and Okulewicz1981, Green et al. Reference Green, Hirons and Kirby1990, Kirby and Green Reference Kirby and Green1991, Johansson Reference Johansson2001). It is, however, unlikely that our failure to take topography into account significantly affected the calculated relative densities in the flat western part of the country, where the derived core areas are located.
Because of the uncertainties associated with our approach and with making predictions in general, we refrain from using our model to predict exact future relative densities, but instead focus our analysis on the location of core areas derived using a conservative approach.
Network performance
The Netherlands’ implementation of the Birds Directive and the designation of Natura 2000 sites met societal, legislative and procedural difficulties (Beunen Reference Beunen2006, Beunen and Hagens Reference Beunen and Hagens2009), but the ecological network should ultimately be evaluated on its ecological performance. There is a vast literature analysing the ecological performance of terrestrial nature networks, at scales ranging from global (Olson et al. Reference Olson, Dinerstein, Wikramanayake, Burgess, Powell, Underwood, D'amico, Itoua, Strand, Morrison, Loucks, Allnutt, Ricketts, Kura, Lamoreux, Wettengel, Hedao and Kassem2001), and continental (e.g. Africa: Brooks et al. Reference Brooks, Balmford, Burgess, Fjeldså, Hansen, Moore, Rahbek and Williams2001; North America: Scott et al. Reference Scott, Davis, McGhie, Wright, Groves and Estes2001), to national (e.g. Canada: Wiersma and Nudds Reference Wiersma and Nudds2009; UK: Jackson et al. Reference Jackson, Kershaw and Gaston2004, Baker and Stroud Reference Baker, Stroud, Boere, Galbraith and Stroud2006) and regional (e.g. Meghalaya state, India: Khan et al. Reference Khan, Menon and Bawa1997; Québec, Canada: Sarakinos et al. Reference Sarakinos, Nicholls, Tubert, Aggarwal, Margules and Sarkar2001). In their review of this literature, Jackson et al. (Reference Jackson, Kershaw and Gaston2004) concluded that most studies reported that the largest problems were insufficient coverage, sub-optimal species/habitat representation and inadequate selection methods. For the Black-tailed Godwit in the Netherlands, selection of SPAs seems to have been inadequate for the important breeding population due to the criteria applied. For a better procedure for selecting SPAs, Jackson et al. (Reference Jackson, Kershaw and Gaston2004) recommended further developing site-selection criteria, drafting species-specific targets and, especially, finding ways in which the latter targets can be incorporated into the entire selection process. Our approach of identifying core areas based on actual breeding distribution and habitat characteristics during the breeding season may contribute to a better and species-specific selection of relevant SPAs that will protect the species during the life-cycle phase in which the population is under highest pressure.
There have been few studies in the Netherlands to evaluate network performance and this paper is the first to evaluate the adequacy of the current Natura 2000 network for a breeding population of a wader species in the Netherlands. It is generally agreed that meadow birds, including Black-tailed Godwit, are now declining in the Netherlands because of the effects agricultural intensification has on conditions during the breeding season (Beintema et al. Reference Beintema, Moedt and Ellinger1995, Melman et al. 2008, Gill et al. Reference Gill, Langston, Alves, Atkinson, Bocker, Vieira, Crockford, Gélinaud, Groen, Gunnarsson, Hayhow, Hooijmeijer, Kentie, Kleijn, Lourenco, Masero, Meunier, Potts, Roodbergen, Schekkerman, Schröder, Wymenga and Piersma2007). Yet despite this consensus, the Netherlands has not designated SPAs for the breeding season. In contrast, conservation objectives for a total of 22 SPAs have been set for Black-tailed Godwit outside the breeding season. All these SPAs act as important staging and moulting areas (Mulder Reference Mulder1972, van Dijk Reference van Dijk1980, Gerritsen Reference Gerritsen1990), primarily in the post-breeding season. Most of the SPAs designated for Black-tailed Godwit have long been known as staging areas for the species (Mulder Reference Mulder1972, Gerritsen Reference Gerritsen1990). This site fidelity shows that staging areas are very important in the life-cycle of the Black-tailed Godwit (van Dijk Reference van Dijk1980, Gerritsen Reference Gerritsen1990). Paradoxically, Dutch breeding Black-tailed Godwits are thus strongly protected outside the breeding season (through the network of SPAs) yet remain unprotected during the breeding season. Although the protection of the non-breeding population may at first seem secure, the source of these birds is a declining breeding godwit population and thus ultimately the conservation objectives for the non-breeding population for each of the 22 SPAs may not be met. We therefore conclude that the breeding population of Black-tailed Godwit in the Netherlands is not being adequately protected through the Natura 2000 network. This agrees with Bouwma et al. (Reference Bouwma, Janssen, Hennekens, Kuipers, Paulissen, Niemeijer, Wallis de Vries, Pouwels, Sanders and Epe2009), who more generally concluded that in order to achieve national conservation objectives, 50% of Dutch bird species need additional protection outside Natura 2000 sites.
Policy recommendations for meadow bird core areas
Given the limited financial resources available for nature conservation, we recommend that conservation policy for Black-tailed Godwit in the Netherlands should focus on the five core areas identified in this paper (Zuidwest Friesland, Waterland, the IJssel delta area, Arkemheen and Eem polders, and Groene Hart). The properties of these core breeding areas of Black-tailed Godwit make these landscapes exceptional at world scale. To maintain (or improve) conditions in these areas, the focus should be on the three main habitat requirements for the species. Groundwater levels should be sufficiently high (Kleijn and van Zuijlen Reference Kleijn and van Zuijlen2004) to ensure soil penetrability that is optimal for the birds’ bills (Green Reference Green1988, Schekkerman Reference Schekkerman1997), in turn resulting in optimal access to food resources (Burges and Raw Reference Burges and Raw1967, Gerard Reference Gerard1967, Schekkerman Reference Schekkerman1997, Peach et al. Reference Peach, Denny, Cotton, Hill, Gruar, Barritt, Impey and Mallord2004, Rhymer et al. Reference Rhymer, Robinson, Smart and Whittingham2010). For Black-tailed Godwit breeding in areas with a peaty soil, for instance, optimal groundwater levels are at depths between 20 and 40 cm (van ‘t Veer et al. Reference van ’t Veer, Sierdsema, Musters, Groen and Teunissen2008). In the core areas identified in this paper, groundwater levels were always much shallower than average groundwater levels elsewhere in the Netherlands. Land-use should be considered at landscape level, with a focus on mosaic management to create an optimal mix of fields with high and low sward for the species (Terwan et al. Reference Terwan, Oosterveld, de Ruiter and Guldemond2003, Melman et al. 2008, Schekkerman et al. Reference Schekkerman, Teunissen and Oosterveld2008). The land-use over extensive areas in the five core areas is predominantly meadow. Outside the five core breeding areas for Black-tailed Godwit, for instance in the north-east and the south-west of the country, arable fields are more common, resulting in less suitable breeding habitat for the species.
As the landscape in the five core areas is already very open, they are well suited for supporting a meadow bird population in the future. Openness may, however, be the most difficult habitat requirement to maintain, because spatial planners rarely take it into consideration. To be safeguarded, the preservation of landscape openness must be explicitly incorporated in policy. Because landscape protection policy in the Netherlands is developed at provincial level, there is a danger that policy may not be consistent in areas shared by several provinces and that therefore a landscape may degrade. A good example is the Groene Hart area, one of the five core areas for breeding Black-tailed Godwit, which is under the jurisdiction of the provinces of Noord-Holland, Utrecht and Zuid-Holland as well as several municipalities (Janssen et al. Reference Janssen, Arciniegas and Verhoeven2013). Although the protection of the unique values of the Groene Hart area is enshrined in various policy documents, building schemes on the outskirts of the small villages are nevertheless eroding meadow habitat. A possible solution is to make local governments responsible for the protection of the breeding grounds of Black-tailed Godwit; specific EU legislation could be developed to help the managers of such areas to achieve this.
Outlook for the Black-tailed Godwit flyway population of Western Europe and western Africa
The EU biodiversity strategy is intended to ensure that species populations are stable by 2020. However, this may be difficult to achieve for the Black-tailed Godwit flyway population of Western Europe and western Africa, for several reasons. First, the species’ breeding areas are currently not protected, so therefore changing agricultural use and further encroachment may cause the population to decline rapidly. Secondly, SPAs assigned for the Black-tailed Godwit were based on the relevant flyway population estimate by Rose and Scott (Reference Rose and Scott1997) of 350,000 individuals (resulting in a 1% threshold of 3,500 individuals). This estimate has, however, since been revised by Stroud et al. (Reference Stroud, Davidson, West, Scott, Haanstra, Thorup, Ganter and Delany2004) to 170,000 individuals (equivalent to a 1% threshold of 1,700 individuals, or 850 breeding pairs). This revision should thus result in even more SPAs being assigned to the Black-tailed Godwit, because other staging areas that have so far remain unassigned may be assumed to contain numbers that are above this new threshold. These sites are currently wholly or only partly protected. Unless these issues are effectively addressed, in 2020 the projected decline of the Dutch Black-tailed Godwit population by 34,000 breeding pairs relative to 2000 (based on figures in Melman et al. 2012) will have occurred. This is equivalent to a 40% loss of the Western European/African flyway population, and to c.10% of the world population of the species (based on Stroud et al. Reference Stroud, Davidson, West, Scott, Haanstra, Thorup, Ganter and Delany2004, Wetlands International 2013). Bouwma et al. (Reference Bouwma, Janssen, Hennekens, Kuipers, Paulissen, Niemeijer, Wallis de Vries, Pouwels, Sanders and Epe2009) reached the conclusion that under current policy even the Dutch non-breeding conservation objective for this species may not be achieved. They predict that the Black-tailed Godwit is one of the few priority species in the Netherlands whose decline will continue. If these scenarios come about, the Netherlands will have breached various policy commitments, such as the Agreement on the Conservation of African-Eurasian Migratory Waterbirds (AEWA) (Boere and Piersma Reference Boere and Piersma2012). It may also be justification for upgrading the species’ present worldwide threatened status of Near-threatened to a higher threat category.
Acknowledgements
Bas van Bemmel, Mariette van Esbroek and Arjen van Hinsberg (all formerly of Milieu- en Natuurplanbureau) helped us acquire the “Netherlands Later” datasets. Ton Markus and Margot Stoete (both from the faculty of Geosciences, Utrecht University, the Netherlands) prepared the final versions of the figures that accompany the text. Joy Burrough was the professional language editor of a near-final draft of the paper.


