


Introduction
Financial incentives appear to be a promising public policy tool to promote behavior change for the most prominent causes of chronic, non-communicable disease (WHO, 2009), such as tobacco use, poor diet and physical inactivity (for systematic reviews, see Mitchell et al., Reference Mitchell, Goodman, Alter, John, Oh, Pakosh and Faulkner2013; Strohacker et al., Reference Strohacker, Galarraga and Williams2013; Giles et al., Reference Giles, Robalino, McColl, Sniehotta and Adams2014; Mantzari et al., Reference Mantzari, Vogt, Shemilt, Wei, Higgins and Marteau2015). Many different financial incentive schemes are used, which differ for example in terms of the size, timing or certainty of payment (Adams et al., Reference Adams, Giles, McColl and Sniehotta2014). Often, insights from behavioral economics are used to motivate or design the financial incentives used. For example, financial incentives have been used that capitalize on behavioral insights such as loss aversion (e.g., deposit/commitment contracts: Bryan et al., Reference Bryan, Karlan and Nelson2010; Giné et al., Reference Giné, Karlan and Zinman2010; Bhattacharya et al., Reference Bhattacharya, Garber and Goldhaber-Fiebert2015; Volpp et al., Reference Volpp, John, Troxel, Norton, Fassbender and Loewenstein2008) or probability weighting (e.g., lottery incentives: Volpp et al., Reference Volpp, John, Troxel, Norton, Fassbender and Loewenstein2008; Haisley et al., Reference Haisley, Volpp, Pellathy and Loewenstein2012; Kimmel et al., Reference Kimmel, Troxel, Loewenstein, Brensinger, Jaskowiak, Doshi, Laskin and Volpp2012; van der Swaluw et al., Reference van der Swaluw, Lambooij, Mathijssen, Schipper, Zeelenberg, Berkhout, Polder and Prast2018). The effectiveness of such financial incentives, which Galizzi (Reference Galizzi2014) refers to as behaviorally inspired incentives, is hypothesized to be amplified by deviations from traditional rationality.
However, no conclusive evidence exists to support policymakers in the choice between different (behaviorally inspired) financial incentive schemes. Several randomized controlled trials (e.g., Haisley et al., Reference Haisley, Volpp, Pellathy and Loewenstein2012; Patel et al., Reference Patel, Asch, Rosin, Small, Bellamy, Heuer, Sproat, Hyson, Haff and Lee2016) have systematically compared different incentive schemes directly against each other (e.g., lottery versus commitment incentives) or against fixed incentives (Halpern et al., Reference Halpern, Kohn, Dornbrand-Lo, Metkus, Asch and Volpp2011). However, given the costly nature of studying financial incentives, such studies far from exhaust all possible comparisons between behaviorally inspired incentives. The use of incentive schemes that mix behavioral components of different designs is even rarer (e.g., van der Swaluw et al., Reference van der Swaluw, Lambooij, Mathijssen, Schipper, Zeelenberg, Berkhout, Polder and Prast2018). As a result, it is unclear who responds to financial incentives and why (Paloyo et al., Reference Paloyo, Reichert, Reuss-Borst and Tauchmann2015), which may explain why a one-size-fits-all approach is often applied, offering all respondents the same type of financial incentives (often motivated by a single behavioral insight, if any at all). The main motivation of this paper is to move beyond such one-size-fits-all approaches and instead to provide incentives tailored to individuals’ preferences. This extends earlier work on incentives in two domains.
First, existing work mostly compared behaviorally inspired incentives by means of random assignment (e.g., Volpp et al., Reference Volpp, John, Troxel, Norton, Fassbender and Loewenstein2008; Kullgren et al., Reference Kullgren, Troxel, Loewenstein, Norton, Gatto, Tao, Zhu, Schofield, Shea and Asch2016), rather than exploring which types of financial rewards individuals prefer themselves. However, scarce evidence suggests that preferences for behaviorally inspired incentives are heterogeneous. For example, Halpern and colleagues (Reference Halpern, French, Small, Saulsgiver, Harhay, Audrain-McGovern, Loewenstein, Brennan, Asch and Volpp2015) find that only 14% voluntarily accept deposit contracts, while Vashistha and colleagues (Reference Vashistha, Cutrell and Thies2015) find a small majority prefers lotteries over fixed incentives (in a non-health context). Allowing individuals full autonomy in selecting those incentives they prefer (i.e., tailoring incentives) could increase individuals’ motivation to engage in healthy behavior (see the work on self-determination theory by Deci & Ryan, Reference Deci and Ryan2008). Hence, in this study, a newly developed tool is implemented that allows individuals to tailor their own incentives (i.e., each individual could select a unique combination of different incentive design elements). This tool was tested in a lab experiment in which individuals were asked to self-select (hypothetical) tailored incentives to promote exercise.
Second, even though large heterogeneity exists in the economic preferences that motivate behaviorally inspired incentive designs, the importance of these individual differences has rarely been explored in the context of financial incentives. For example, a plethora of work in experimental economics has shown large differences in, for example, probability weighting and loss aversion, both for money (e.g., Kahneman & Tversky, Reference Kahneman and Tversky1979; Tversky & Kahneman, Reference Tversky and Kahneman1992; Abdellaoui et al., Reference Abdellaoui, Bleichrodt and Paraschiv2007, Reference Abdellaoui, Bleichrodt, L'Haridon and Van Dolder2016; Bruhin et al., Reference Bruhin, Fehr-Duda and Epper2010; Bleichrodt et al., Reference Bleichrodt, Gao and Rohde2016) and for health (e.g., Attema & Lipman, Reference Attema and Lipman2018; Kemel & Paraschiv, Reference Kemel and Paraschiv2018; Lipman et al., Reference Lipman, Brouwer and Attema2019a, Reference Lipman, Brouwer and Attema2019b). This large heterogeneity in economic preferences raises several issues. For example, it is unknown whether those who show preferences consistent with a behavioral insight (e.g., are loss averse) are to a larger extent affected by financial incentives designed with this behavioral insight in mind (e.g., deposit contracts) than those who are not. To date, only a small amount of evidence exists for lottery incentives for secondary prevention (Björkman Nyqvist et al., Reference Björkman Nyqvist, Corno, De Walque and & Svensson2018) and financial incentives for exercise procrastination (Woerner, Reference Woerner2018). Furthermore, it is unknown whether these economic preferences may explain the heterogeneity in uptake of behaviorally inspired incentives (i.e., if those who are loss averse would be more or less likely to sign up for deposit contracts). This study addresses the latter issue by measuring a set of economic preferences for each respondent that are often used to motivate particular incentive design choices. To further explore who responds to financial incentives and why, the association between these economic preferences and tailored incentives is investigated.
Experiment
Sample and setting
The sample consisted of 182Footnote 1 Business Administration students (63 females, average age = 19.17 years, SD = 1.47) who were rewarded course credits for their participation. Sessions lasted 30 minutes and were run in adjacent cubicles with an instructor present to answer any questions.
Tool for tailored incentives
Students were presented with a (hypothetical) scenario in which their employer was facilitating their achievement of a weight-loss goal by offering a financial incentive for visiting the gym at least twice every week for a 10-week period. The reward had a fixed expected value of $100 over this 10-week period. The tool for tailored incentivesFootnote 2 allowed individuals to interactively design their own incentive scheme while keeping the expected value of the incentives constant. The following instruction was used:
Your employer is quite flexible, and besides the expected payout has no preference in how your financial reward is structured. Obviously, you yourself know best what kind of payout structure would motivate you to go to the gym and reach your goal of losing weight. Therefore, we ask you to indicate how you would like your payout(s) to be structured.
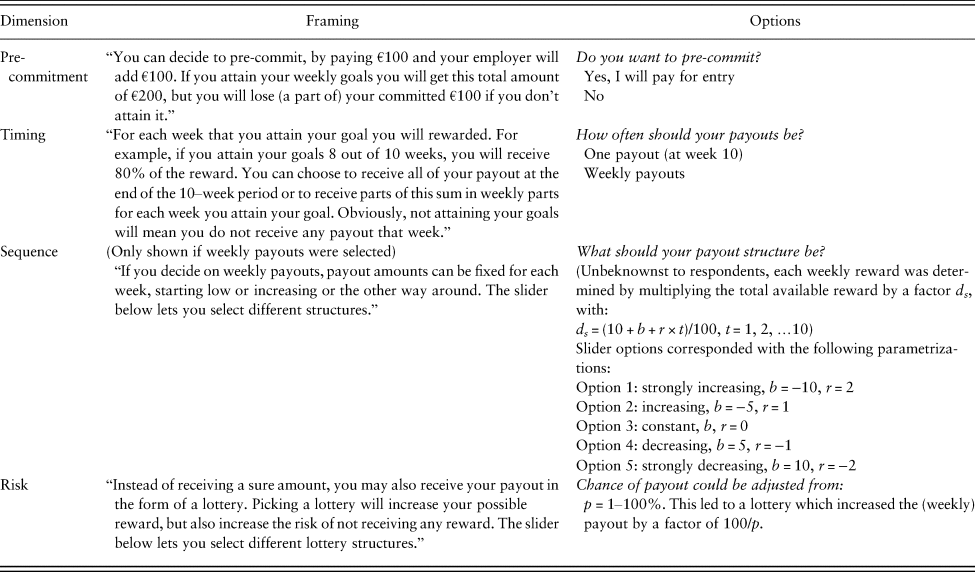
Students could tailor incentives along four dimensions, by: (1) deciding to commit personal funds (Pre-commitment);Footnote 3 (2) picking weekly payouts (Timing); (3) which could be increasing or decreasing (Sequence); and (4) introducing payout risk that increases value (Risk). Table 1 shows an overview of the framing and parametrization used for each dimension.
Table 1. Overview of the dimensions that could be edited to design tailored incentive schemes, with framing, options and parametrization.
Economic preference elicitation
Table 2 provides an overview of the economic preferences elicited in this study and the implications of these risk and time preferences (full detail on measurement and definitions can be found in the Online Supplementary Material). Risk preferences were elicited by measuring loss aversion, utility curvature (for gains and losses) and probability weighting (for gains and losses) using non-parametric methodology (adapted from Abdellaoui, Reference Abdellaoui2000; Abdellaoui et al., Reference Abdellaoui, Bleichrodt, L'Haridon and Van Dolder2016). This methodology has been recently introduced, and inter alia successfully applied to measure behavioral biases for decisions about money and health (Abdellaoui et al., Reference Abdellaoui, Bleichrodt, L'Haridon and Van Dolder2016; Lipman et al., Reference Lipman, Brouwer and Attema2019a, Reference Lipman, Brouwer and Attema2019b). The use of such non-parametric methodology may be preferred, as it does not rely on certain parametric assumptions that may not reflect preferences (Abdellaoui, Reference Abdellaoui2000; Abdellaoui et al., Reference Abdellaoui, Bleichrodt and Paraschiv2007) or have troublesome mathematical properties around extremes (Wakker, Reference Wakker2008). Next, time preferences were measured assuming a quasi-hyperbolic discounting model (Laibson, Reference Laibson1997), where present bias (for gains and losses) and a weekly discount rate (for gains and losses) were elicited.
Table 2. Elicited economic preferences (including median and interquartile range), with the implication of modal (i.e., most frequently occurring) preferences and related dimensions of tailored incentives.
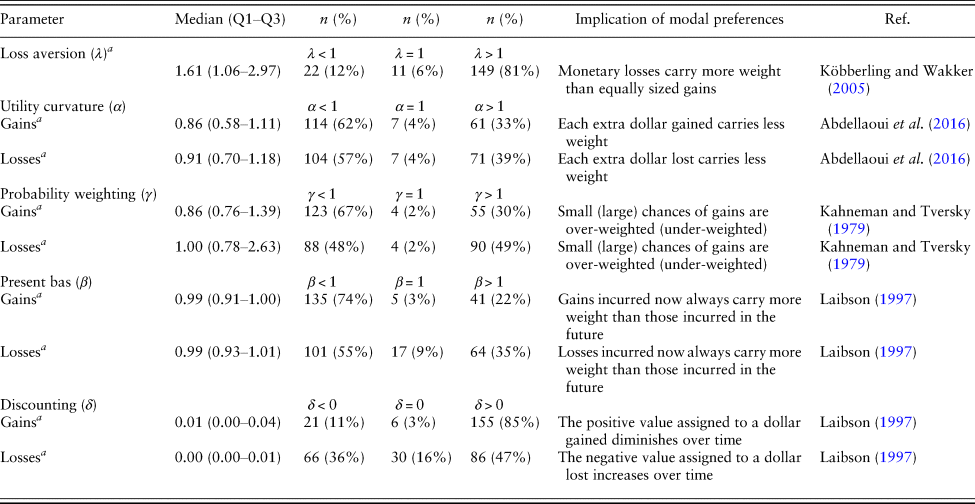
For definitions and implications of λ, α, γ, β and δ, see Online Supplementary Material.
a This distribution was different from that expected by chance, tested with χ 2 tests and a significance level of 0.05.
Exploratory questionnaires
Besides completing tasks aimed at eliciting these economic preferences, subjects filled in a series of questionnaires aimed at exploring the association between various psychological measures and tailored incentives. Several questions and questionnaires were used to measure self-reported health behaviors (alcoholic drinks/cigarettes consumed per week, exercise behavior and body mass index), self-control (Tangney et al., Reference Tangney, Boone and Baumeister2018), cognitive reflection (Toplak et al., Reference Toplak, West and Stanovich2011) and personality (Francis et al., Reference Francis, Brown and Philipchalk1992) (see Online Supplementary Material). These questionnaires were only filled in by subjects in the time remaining after they finished the main experiment, and hence were not completed by all subjects (see Table 3 for the number of complete observations per measure).
Table 3. Descriptive statistics for demographic variables and psychological traits measures.
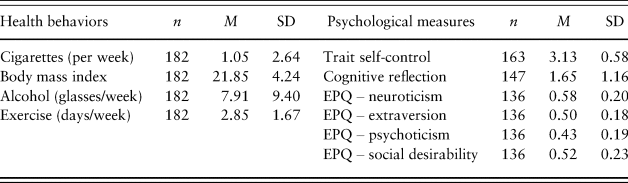
Personality traits were defined and measured according to the taxonomy used in the Eysenck Personality Questionnaire (EPQ).
Results
All analyses are available on request and are reported without correcting for multiple testing.
Descriptive statistics
Table 2 (economic preferences) and Table 3 (demographics and psychological measures) show descriptive statistics for the sample. These results indicate that students generally were: non-smokers, moderate drinkers, engaging in regular exercise, loss averse, diminishingly sensitive to gains and losses, sensitive to extreme probabilities (i.e., inverse S-shaped probability weighting), present biased and not or slightly discounting monetary amounts on a weekly basis. However, the standard deviations reported in Tables 2 and 3 reflect the considerable between-subject heterogeneity that motivated this study.
Tailored incentives
The results of the tool for tailored incentives can be found in Table 4. A significant majority decided to pre-commit personal funds to increase rewards (χ 2(1, n = 182) = 22.51, p < 0.001), and a near-even split existed in the sample for preferences for one or weekly payouts. Those preferring weekly payouts generally preferred slightly increasing or constant payouts. Lottery incentives were infrequently selected, with a negligible group (3 out of 163) selecting the lowest possible chance of winning and a large and significant majority preferring certain payouts rather than any of the other possible probabilities of payout (χ 2(34, n = 182) = 1397, p < 0.001). The three most prominent tailored incentive schemes were: pre-committing with one certain payout (12% of the sample); pre-committing with weekly, constant payouts (8% of the sample); and pre-committing with weekly, slightly increasing payouts (8% of the sample).
Table 4. Descriptive statistics for tailored incentive selection using the newly developed tool.

Association between selected tailored incentives and economic preferences
Next, a series of analyses was performed to explore the association between the tailored incentives students selected and their economic preferences.
First, these associations were explored by means of t-tests (for Pre-commitment and Timing dimensions) and Spearman rank-correlation analyses (Structure and Risk dimensions) between individuals’ choices on each dimension and the various measures obtained, which showed no consistent associations. For example, there were no significant differences between individuals who choose deposit contracts or not for: loss aversion, probability weighting, utility curvature, present bias, time discounting, health behaviors, cognitive reflection, personality and trait self-control (t-tests, all p-values > 0.08). A similar lack of evidence can be observed for Timing (t-tests, all p-values > 0.07), Structure (all Spearman ρ values < 0.15, p-values > 0.08) and Risk (all Spearman ρ values < 0.11, p-values > 0.15). The only exception was the parameter for present bias for losses, with those who chose one payout having stronger present bias for losses (t(160) = –2.02, p = 0.04).
Next, it was explored as to whether those who chose one of the most prominent tailored preference patterns differed on the obtained economic and psychological measures. We found no such differences for respondents pre-committing with one certain payout (t-tests, all p-values > 0.12). A similar lack of evidence is observed for those who chose to commit with certain weekly payouts, either constant (t-tests, all p-values > 0.12) or slightly increasing (t-tests, all p-values > 0.12). Several exceptions were observed: (1) those pre-committing with weekly constant payouts discounted losses at a lower rate (t(160) = –2.02, p = 0.04); and (2) those pre-committing with weekly, slightly increasing payouts had more concave utility curvature for gains, discounted both gains and losses to a lesser extent and had less pronounced present bias for losses (t-tests, all p-values < 0.03).
Finally, this lack of systematic association between the obtained measures and tailored incentives was confirmed by a series of multiple linear or logistic regression analyses, in which subject characteristics, economic preferences and psychological traits were included stepwise as predictors for each tailored incentive dimension (for model specifications used and regression results, see Online Supplementary Material).
Discussion
Heterogeneity in preferences for financial incentives for health behavior change has rarely been studied (one of the few examples being Halpern et al., Reference Halpern, French, Small, Saulsgiver, Harhay, Audrain-McGovern, Loewenstein, Brennan, Asch and Volpp2015), and thus it is unclear who responds to financial incentives and why (Paloyo et al., Reference Paloyo, Reichert, Reuss-Borst and Tauchmann2015). To provide policymakers with some support in the choice between different (behaviorally inspired) financial incentive schemes, this study explored the preferences of respondents themselves. More specifically, this study aimed to explore heterogeneity in the type of financial incentives individuals prefer and if the behavioral insights often used in practice to motivate the choice for a particular design are associated with these preferences.
Surprisingly, the findings of this study indicate a large majority of students would commit their own money to reach their exercise goals, whereas the work by Halpern and colleagues (Reference Halpern, French, Small, Saulsgiver, Harhay, Audrain-McGovern, Loewenstein, Brennan, Asch and Volpp2015) suggested uptake of such deposit contracts to be much lower. Furthermore, even though lottery incentives with small chances of receiving a relatively large sum have been used successfully (e.g., Volpp et al., Reference Volpp, John, Troxel, Norton, Fassbender and Loewenstein2008; Haisley et al., Reference Haisley, Volpp, Pellathy and Loewenstein2012; Kimmel et al., Reference Kimmel, Troxel, Loewenstein, Brensinger, Jaskowiak, Doshi, Laskin and Volpp2012; van der Swaluw et al., Reference van der Swaluw, Lambooij, Mathijssen, Schipper, Zeelenberg, Berkhout, Polder and Prast2018), very few students selected incentives with low chances (<1–5%) of winning a prize for themselves. These tailored preferences were not systematically related to any of the behavioral insights often used to motivate the implementation of behaviorally inspired incentives in practice (or to any of the measured health behaviors and psychological measures). Hence, although autonomy is likely increased by allowing individuals full freedom to design their own financial incentives using a tool like the one developed for this study, the results reported here provide no insight into why individuals prefer particular incentive schemes and if this will improve cost-effectiveness. Before providing interpretations based on this null result and discussing the explanations for the lack of evidence, several methodological limitations deserve noting.
First, the preferences reported here are obtained from students and may not apply to the populations in which financial incentives are used to promote health behavior, such as individuals motivated to change their behavior (e.g., Halpern et al., Reference Halpern, French, Small, Saulsgiver, Harhay, Audrain-McGovern, Loewenstein, Brennan, Asch and Volpp2015; van der Swaluw et al., Reference van der Swaluw, Lambooij, Mathijssen, Schipper, Zeelenberg, Berkhout, Polder and Prast2018) or people in lower/middle-income countries (for a review, see Ranganathan & Lagarde, Reference Ranganathan and Lagarde2012). For example, census data show that the young and highly educated exercise more than other populations (CBS/RIVM, 2018), and students may thus need fewer incentives to go to the gym twice a week. Second, all preferences obtained in this study were for hypothetical outcomes. In other words, this study investigated the association between hypothetical financial incentives for exercise and economic preferences elicited over hypothetical monetary outcomes. Although earlier work has suggested that preferences for hypothetical and real outcomes are not qualitatively different (Camerer & Hogarth, Reference Camerer and Hogarth1999; Hertwig & Ortmann, Reference Hertwig and Ortmann2001), generally the use of real outcomes is preferred in behavioral experiments in health, as hypothetical incentives may lead to increased measurement error (Galizzi & Wiesen, Reference Galizzi and Wiesen2018). Third, the experimental setup and instructions used for this study could have had an influence on the findings reported in this study. For example, students were instructed to tailor incentives for going to the gym twice in order to reach a weight loss goal and also explicitly told that they would know which incentives would motivate them. However, no further information was provided on their weight-loss goal, the nature of the activities they should (imagine themselves to) perform in the gym or how they should know what motivates them. As such, the instructions could have been open to alternative interpretations, which future work could remedy by using different instructions and focusing on individuals’ own health-promotion goals. Furthermore, all measures obtained in this study were filled in by respondents only after they reported their preferences for tailored incentives. Without any counterbalancing procedures, this study could not be controlled for ordering effects, as, for example, found in Carlsson and colleagues (Reference Carlsson, Mørkbak and Olsen2012). However, economic preferences were generally in line with those found in earlier applications of the methods used in this study (Bruhin et al., Reference Bruhin, Fehr-Duda and Epper2010; Abdellaoui et al., Reference Abdellaoui, Bleichrodt, L'Haridon and Van Dolder2016; Lipman et al., Reference Lipman, Brouwer and Attema2019b), and no association was observed between these preferences and the incentives selected. Hence, it is unlikely that respondents aimed to be consistent between the two parts of the experiment.
This study reports an exploration of the economic preferences that influence the incentives individuals prefer and found none to be systematically associated with self-selected incentives. This null result can mean one of two things: (1) no such association exists; or (2) the methods used failed to capture this association between economic preferences and (tailored) incentives. One explanation for the former, as suggested by Halpern and colleagues (Reference Halpern, French, Small, Saulsgiver, Harhay, Audrain-McGovern, Loewenstein, Brennan, Asch and Volpp2015) for the low uptake of deposit contracts (which were the most effective incentive design in their study), is that respondents may lack the sophistication to select financial incentives that would benefit them the most (e.g., they have insufficient knowledge of their own preferences, as found by Hey & Lotito, Reference Hey and Lotito2009). This would explain why no association could be found between behavioral insights such as loss aversion and probability weighting and the incentive dimensions these constructs are hypothesized to amplify.
On the other hand, the null result reported in this study may also be explained by a lack of external validity of economic preferences or insufficient statistical power to detect small but relevant effects. For example, earlier work has questioned whether the elicitation of economic preferences has a bearing on decision-making in the field at all (Schram, Reference Schram2005; Galizzi et al., Reference Galizzi, Machado and Miniaci2016; Galizzi & Navarro-Martínez, Reference Galizzi and Navarro-Martínez2019). As such, one could question the usefulness of measuring economic preferences in the context of the provision of financial incentives. Nonetheless, Björkman Nyqvist et al. (Reference Björkman Nyqvist, Corno, De Walque and & Svensson2018) did find a strong association between risk preferences and lottery incentives for the uptake of secondary prevention in a field study in Lesotho. Compared to the field study by Björkman Nyqvist et al. (Reference Björkman Nyqvist, Corno, De Walque and & Svensson2018), this study used hypothetical incentives and a relatively small sample. Hence, the smaller statistical power and possibly increased noise related to hypothetical incentives may explain why this large effect did not extend to the lab.
To conclude, this study has several implications for future research and policy. The descriptive results reported suggest that that preferences for financial incentives differ between individuals. Hence, governments or organizations aiming to use financial incentives could, for example, use this tool or a similar one to study these preferences in their target population as input for the design of their interventions. Furthermore, whether tailoring incentives improves their cost-effectiveness could be investigated. Such increased cost-effectiveness could, for example, occur as a result of increased motivation through enhanced autonomy or because a subgroup of sophisticated individuals select incentives that are especially beneficial to them. An alternative way forward, to be explored either in future research or policy, is to assign individuals to financial incentives that fit their economic preferences. However, although behavioral insights are often used to motivate one-size-fits-all, behaviorally inspired financial incentives, the theoretical or empirical basis for assigning individual-level tailored incentives is currently lacking.
Supplementary material
To view supplementary material for this article, please visit https://doi.org/10.1017/bpp.2020.21
Acknowledgments
Werner Brouwer, Arthur Attema and Jenny Kudymowa provided helpful comments on this manuscript.


 Open access