Hostname: page-component-77c89778f8-fv566 Total loading time: 0 Render date: 2024-07-17T02:38:18.776Z Has data issue: false hasContentIssue false

An archaeological radiocarbon database for southern Africa

Published online by Cambridge University Press:  08 July 2019

Emma Loftus*
Affiliation:
McDonald Institute for Archaeological Research, University of Cambridge, Downing Street, Cambridge CB2 3ER, UK
Peter J. Mitchell
Affiliation:
School of Archaeology, University of Oxford, 36 Beaumont Street, Oxford OX1 2PG, UK School of Geography, Archaeology and Environmental Studies, University of the Witwatersrand, PO Wits 2050, South Africa
Christopher Bronk Ramsey
Affiliation:
Research Laboratory for Archaeology and the History of Art, University of Oxford, 1 South Parks Road, Oxford OX1 3TS, UK
*
*Author for correspondence (Email: el485@cam.ac.uk)
Rights & Permissions [Opens in a new window]

Abstract

The Southern African Radiocarbon Database (SARD) is a new online, open-access database of published radiocarbon dates from southern African archaeological contexts. Compatible with the calibration, Bayesian modelling and mapping functionality of the OxCal software, the SARD will greatly assist in the documentation and analysis of chronological trends across the subcontinent. This article introduces the database and presents two case studies that demonstrate its utility and its integration with OxCal, comparing the temporal distribution of radiocarbon dates in two archaeologically well-investigated regions, and assessing the timing of Middle to Later Stone Age technological developments across the African subcontinent.

Type
Research
Copyright
Copyright © Antiquity Publications Ltd, 2019 

Introduction

Radiocarbon dating has a long history in southern Africa, beginning in 1967 with the establishment of a radiocarbon laboratory in Pretoria that was at the forefront of dating the now familiar features of the region's prehistoric sequence. The laboratory's achievements include demonstrating that the origins of the Middle Stone Age lie beyond the limits of the radiocarbon method, that the Later Stone Age extends beyond 2000 years ago and that pastoralists—soon followed by Iron Age farming communities—were present in southern Africa from c. 2000 years ago, long before the date promoted by the propaganda of the apartheid government (Beaumont & Vogel Reference Beaumont and Vogel1972; Vogel & Beaumont Reference Vogel and Beaumont1972; Mason et al. Reference Mason, Klapwijk, Welbourne, Sandelowsky and Maggs1973).

Initially, African archaeological radiocarbon dates were largely disseminated through annotated date-lists and review articles in the Journal of African History (e.g. Fagan Reference Fagan1961, Reference Fagan1969). As their number increased, researchers working in distinct areas of Africa produced regional syntheses of the emerging chronological trends (e.g. Maggs Reference Maggs1977; Hall & Vogel Reference Hall and Vogel1980; Parkington & Hall Reference Parkington and Hall1987). These studies, however, often provided only minimal details about the radiocarbon measurements themselves and their archaeological contexts, and routinely omitted details such as the precise location of sites. Date lists in Radiocarbon generally provided more detail about each radiocarbon measurement, including laboratory protocols and stratigraphic associations (e.g. Vogel & Marais Reference Vogel and Marais1971; Vogel & Visser Reference Vogel and Visser1981; Vogel et al. Reference Vogel, Fuls and Visser1986), but typically did not aim to contextualise dating results within a broader archaeological understanding. Globally, the publication of radiocarbon dates within archaeological studies continues under widely varying standards; reports frequently omit important pieces of information, including the unique laboratory identifier, the material dated and even the uncalibrated radiocarbon age itself. Omitting these details can, of course, render the data unusable for inclusion in future synthetic analyses.

The aggregation and modelling of large chronological datasets is a powerful method for detecting broad demographic and cultural transitions. Several researchers have applied ‘dates-as-data’ approaches to southern Africa's archaeological record, beginning with Janette Deacon's (Reference Deacon1974) assessment of the small set of Later Stone Age dates to investigate the effects of changing climate (especially water availability) on the distribution of human occupations across the Terminal Pleistocene and Holocene. Two decades later, Lyn Wadley (Reference Wadley1993) utilised a larger dataset to reconstruct demographic fluctuations through the Middle Stone Age and Pleistocene Later Stone Age, an approach subsequently extended to Holocene hunter-gatherers and Iron Age farming communities (Vogel Reference Vogel1995; Mitchell Reference Mitchell1997; Vogel & Fuls Reference Vogel and Fuls1999). When and how domesticated animals and ceramic technologies first arrived in the pastoralist contexts of southern Africa has also been explored (Sadr & Sampson Reference Sadr and Sampson2006; Sadr Reference Sadr2015).

The recent development of specialist software and methodological approaches for handling spatial and chronological data has led to increasingly sophisticated attempts to model quantitatively radiocarbon data in various archaeological settings around the world. Large research programmes have emerged to compile and analyse radiocarbon dates (e.g. Williams & Smith Reference Williams and Smith2013; Gayo et al. Reference Gayo, Latorre and Santoro2015; Martindale et al. Reference Martindale, Morlan, Betts, Blake, Gajewski, Chaput, Mason and Vermeersch2016). Such applications, however, are still rare in southern Africa (although see Russell et al. Reference Russell, Silva and Steele2014; Bousman & Brink Reference Bousman and Brink2017), partly because of a general scarcity of chronological expertise in the region and a relative paucity of dates for constraining archaeological events over the long time spans and broad landscapes of southern African prehistory. Radiocarbon dates for the region are currently scattered amongst publications spanning decades of research. It is therefore challenging to track changing chronological interpretations not only for a single site, but also for the entire region.

As has been understood for some time in other parts of the world, including Australia and the Southern Andes (Williams & Smith Reference Williams and Smith2013; Gayo et al. Reference Gayo, Latorre and Santoro2015), a first step towards the routine application of radiocarbon data to wide-ranging archaeological questions is the development of a centralised repository for radiocarbon measurements and associated publications. This is precisely the aim of the Southern African Radiocarbon Database (SARD), which, in addition, is fully compatible with the open-access radiocarbon calibration and modelling software OxCal (Bronk Ramsey Reference Bronk Ramsey1995), and includes mapping capabilities and spatial analytical tools. Beyond the vital task of cataloguing published radiocarbon dates, this functionality enables researchers to undertake both simple and more complex analyses of radiocarbon data at a range of temporal and geographic scales. Below, we introduce the SARD and describe the analytical possibilities it offers in conjunction with OxCal by reference to two broad archaeological research questions.

The SARD: compilation and design

The SARD comprises published dates selected from more than 350 papers, books and reports, spanning more than 50 years of archaeological research. At its launch in 2018, the SARD (https://c14.arch.ox.ac.uk/sadb/db) held approximately 2500 archaeological radiocarbon dates (Figure 1) from over 600 sites (Figure 2). South African dates currently dominate the database (>75 per cent), reflecting the preponderance of South African researchers working across the region and the role of the Pretoria radiocarbon laboratory; indeed, approximately 60 per cent of dates are from that laboratory alone. Nearly 50 per cent of the total number of dates currently included in the SARD are from the last 2000 years (Figure 1). Certain essential criteria are deemed necessary for the inclusion of a radiocarbon date in the database, with other non-essential information also gathered, where reported (Table 1).

Figure 1. Southern African Radiocarbon Database: histogram of the entire uncalibrated dataset of approximately 2550 dates (left), and inset of dates less than 10k BP (right).

Figure 2. Distribution of radiocarbon-dated sites currently included in the Southern African Radiocarbon Database.

Table 1. Essential and non-essential criteria for inclusion of an individual radiocarbon date in the SARD.

Essential criteria

Site names are recorded in the database as given in the literature, with individual uncalibrated dates distinguished by the unique radiocarbon laboratory identification code. As a broad indicator of precision and quality (Linick et al. Reference Linick, Damon, Donahue and Jull1989), dates are also characterised as having been measured by either AMS or conventional (i.e. counting) radiocarbon methods. Although locations are listed as reported in site publications (where noted), in many instances only approximate (or conflicting) location information is provided (e.g. to degrees and minutes only, or simply indicated on a map). While the coordinates in the current database are appropriate for regional-scale spatial analyses, they are not guaranteed to be correct at a highly localised scale—and, consequently, are probably not helpful in relocating actual sites on the ground. The broad class of material dated (e.g. bone, charcoal, marine shell) is considered essential for inclusion, not least to allow for the characterisation of potential radiocarbon reservoir effects. Finally, each date also requires a reference, typically in the form of a published research article. Importantly, each date can be associated with every subsequent publication that cites that date, allowing site interpretations to be updated and tracked.

Non-essential criteria

Further non-essential information for each entry includes contextual details, such as the stratigraphic layer for intra-site chronological modelling, and the type of site (e.g. human burials, rockshelters, shell middens). Another variable included to aid with preliminary analyses is archaeological association, although this poses a challenge for standardising the various terms used in the literature to identify key cultural phases. We have adopted the most widely recognised and accepted frameworks—namely the tripartite division between the Middle Stone Age, Later Stone Age and Iron Age, with subdivisions for the Later Stone Age (i.e. early Later Stone Age, Robberg, Oakhurst, Wilton, and Ceramic Later Stone Age; Lombard et al. Reference Lombard, Wadley, Deacon, Wurz, Parsons, Mohapi, Swart and Mitchell2012) and Iron Age (Early and Late Iron Age; Huffman Reference Huffman2007). This system may, of course, overlook certain archaeological episodes or communities, or force a categorisation where more fluid definitions would be more appropriate. Caution is, therefore, required when searching by archaeological association. Finally, two broad environmental variables—vegetation biome and rainfall seasonality (summer, winter and year-round rainfall zones)—are derived for sites within South Africa, Swaziland and Lesotho from the South African National Biodiversity Institute's Vegetation Map (Mucina & Rutherford Reference Mucina and Rutherford2006) and the WorldClim Global Climate Date precipitation dataset (Fick & Hijmans Reference Fick and Hijmans2017).

A key goal in designing the database was to facilitate exploratory analyses within the OxCal software environment, using both the essential and the non-essential information. A ‘filter’ function allows the data to be narrowed down according to broad categories, and the results can be exported as a csv spreadsheet for inclusion in a table or other analytical software. The database is designed to be updated via submission of a spreadsheet available on the SARD website. Certain response fields have restricted options to guide the submitter and limit the profusion of categories with only a single entry within the database.

Integration of the SARD with OxCal

The SARD is hosted by the Oxford Radiocarbon Accelerator Unit (ORAU) at the University of Oxford, and is accessible with the same login credentials for the open-access OxCal software (currently v. 4.3). Developed over the past two decades, OxCal is a widely used software package for the calibration of radiocarbon dates and for Bayesian analysis of chronological data. Additionally, the ORAU website hosts several databases, including that of the ORAU laboratory itself (https://c14.arch.ox.ac.uk/database/db.php), the Egyptian Radiocarbon Database (Bronk Ramsey et al. Reference Bronk Ramsey, Dee, Rowland, Higham, Harris, Brock, Quiles, Wild, Marcus and Shortland2010), the INTIMATE and RESET palaeoenvironmental databases (Bronk Ramsey et al. Reference Bronk Ramsey, Albert, Blockley, Hardiman, Lane, Macleod, Matthews, Muscheler, Palmer and Staff2014, Reference Bronk Ramsey, Lane, Smith and Pollard2015) and now the SARD. The SARD is fully compatible with the calibration and analytical tools of OxCal and allows data to be transferred easily from the database to the OxCal modelling environment. The integration of the SARD with OxCal is an important feature for ensuring the database's longevity and accessibility as part of an institutionally supported and widely used web resource. Moreover, OxCal provides powerful tools for the integration and analysis of radiocarbon data.

Calibration, Bayesian modelling and aggregation

As a primary analytical step, OxCal facilitates the rapid and simple calibration of radiocarbon dates incorporated from the SARD database. Calibration is an essential step for accurately estimating true calendar ages, yet its application in the literature specific to southern African in particular is variable, with uncalibrated ages still routinely referenced and compared. When exporting dates from the SARD into OxCal, the default calibration curve is SHCal13—the most recent curve for the Southern Hemisphere (Hogg et al. Reference Hogg, Hua, Blackwell, Niu, Buck, Guilderson, Heaton, Palmer, Reimer, Reimer, Turney and Zimmerman2013). Given that marine-derived samples are identified in the database, the marine calibration curve (Marine13) can be applied with an appropriate regional offset, where necessary (Dewar et al. Reference Dewar, Reimer, Sealy and Woodborne2012; Reimer et al. Reference Reimer2013).

Once selected dates are imported to the OxCal environment, it is simple to begin incorporating information on stratigraphy and other details for Bayesian and kernel density estimation (KDE) modelling of site and regional data. Models of radiocarbon dates can range from the straightforward—simply aggregating dates via a Sum command (Bronk Ramsey Reference Bronk Ramsey2001), for example—to the very complex, with numerous nested levels of Bayesian stratigraphic priors and outlier weightings across several sites. A valuable function of Bayesian modelling methods, especially as implemented in OxCal, is the detection of chronological outliers. Many of the radiocarbon dates included in the database were obtained many decades ago, using analytical methods that have since been superseded. Consequently, discrepancies are possible between older data and newly acquired radiocarbon dates for any particular site or archaeological event. Modelling these combined datasets in OxCal can identify probable outliers via the assessment of agreement indices produced by OxCal, or through the application of formal outlier models (Bronk Ramsey Reference Bronk Ramsey2009).

A new tool to highlight here, which is useful for the aggregation of larger numbers of radiocarbon dates, is the KDE_Model function (Bronk Ramsey Reference Bronk Ramsey2017). KDE models can be applied to large sets of related dates to characterise visually the overall age range and distribution of the dated events in much the same way as summed distributions. They are, however, more successful at removing high frequency variability, which can make summed probability distributions difficult to interpret.

Mapping

The SARD is integrated with the mapping functionality of OxCal, allowing sites to be easily visualised on the landscape as a preliminary analytical step. The OxCal mapping tool relies upon the Google Maps service, with five base maps: road, terrain, satellite, hybrid and a plain scalable vector graphic (SVG) of the continental outline. Within the database, sites can be easily filtered and mapped, with analytical tools, including spatial KDE analysis, used to identify clusters of related sites.

The more sophisticated mapping and spatial analysis of radiocarbon date distributions through time is notoriously difficult. This is mostly due to the complexity of visualising both time (especially on radiocarbon timescales) and space in standard GIS applications (Green Reference Green, Jerem, Redo and Szeverenyi2011). A common approach is the utilisation of time slices, but these require onerous data processing and are relatively inflexible. OxCal can map the changing probabilities of calibrated radiocarbon dates (as opposed to sites) through time, producing a continuous series of time slices at the desired resolution (e.g. 50 years, 1000 years) (Bronk Ramsey & Lee Reference Bronk Ramsey and Lee2013). The output of OxCal posterior distributions, including Boundaries or KDE distributions, can be geotagged and visualised via the mapping tool.

Archaeological examples

Radiocarbon dates from the southernmost coast of South Africa and Lesotho

Two regions of southern Africa that have witnessed intense archaeological investigation are its southernmost coast (defined here as 19–27° east, 33–35° south and informally referred to in the literature as the ‘southern Cape’) and the highlands of Lesotho and the regions immediately surrounding them (defined here as 26.5–30° east, 28.5–31° south) (Figure 3). Both regions have long records of hunter-gatherer occupation, with well-dated rockshelter deposits spanning the entirety of the Later Stone Age sequence, if not beyond. Recently, archaeologists have contrasted cultural and technological events from coastal locations and the continental interior (Loftus et al. Reference Loftus, Sealy and Lee-Thorp2016; Pargeter et al. Reference Pargeter, Loftus and Mitchell2017, Reference Pargeter, Loftus, MacKay, Mitchell and Stewart2018). Figure 4 contrasts the KDE models of all dates for each region, highlighting large differences between the regions in the frequency of reported radiocarbon dates across the Late Pleistocene and Holocene. Lesotho and its surroundings offer slightly more dates (n = 298) from more sites (n = 42) than the southern Cape (253 dates, 37 sites). The latter's radiocarbon record shows few dates across the Late Pleistocene, with a gradual increase from 15k cal BP, peaking in the early to mid-Holocene c. 7k cal BP. Thereafter, the number of radiocarbon dates from this region decreases slightly, before peaking again in the Late Holocene, c. 4k cal BP. Dates across Lesotho and its surroundings show a more punctuated pattern, with repeated clusters across the Late Pleistocene and two notable peaks c. 10 and 2.5k cal BP, separated by a decline across the mid-Holocene. A more dramatic increase in dates towards the present (i.e. >2000 years) is observed than in the southern Cape. This possibly reflects the displacement of hunter-gatherers in the latter region by low visibility herding communities who made less use of rockshelters (Arthur Reference Arthur2008).

Figure 3. Southern Africa indicating sites in the Southern African Radiocarbon Database from the southern Cape and Lesotho and its surroundings.

Figure 4. KDE-modelled distributions (blue line) for all radiocarbon dates from the southern Cape and from Lesotho and surrounding regions. Radiocarbon determinations appear in red, the SHCal13 calibration curve in blue and the summed distribution in grey. Calibrated ages are shown as grey crosses, modelled ages as black crosses.

The differences between the KDE distributions reflect well-known features of the two archaeological records. The Maloti Mountains of highland Lesotho and the adjoining uKhahlamba-Drakensberg Escarpment collectively form southern Africa's highest region, which today experiences some of the subcontinent's coldest conditions, with frequent winter snowfall. Given the considerably cooler temperatures under glacial conditions, it is plausible that the region was uninhabitable during the height of the Last Glacial Maximum (c. 22.3 ± 3.6 ka)—an interpretation supported by the scarcity of contemporaneous archaeological deposits (Pargeter et al. Reference Pargeter, Loftus and Mitchell2017; Stewart & Mitchell Reference Stewart and Mitchell2018). The KDE distribution also shows a peak in radiocarbon dates between 12 and 9k cal BP, perhaps indicating reoccupation after the end of the Younger Dryas stadial. There is a marked subsequent decrease in dates from the early to mid-Holocene, a period of climate-driven demographic decline across the subcontinent's interior (Deacon Reference Deacon1974).

Familiar features of the regional archaeological record are likewise evident in the KDE model of dates from the southern Cape. Their steady increase along the region's coast reflects rising sea-levels across the Terminal Pleistocene, as the coastline came to assume its modern configuration; areas currently offshore were inundated and people relocated farther inland (for a general discussion of this process, see Compton Reference Compton2011). Early Holocene climatic conditions in the southern Cape, however, clearly also permitted relatively large populations, as only a small decrease in radiocarbon dates is observable here after 7k cal BP. This is despite the region's insulation from the worst effects of water stress during the mid-Holocene that are observed elsewhere across the subcontinent, by coastal resources and a year-round rainfall climate (Sealy Reference Sealy, Jones and Stewart2016).

The Middle to Later Stone Age transition

Two broad archaeological periods in southern Africa intersect with the 50 000-year period for which radiocarbon methods are applicable—namely the Middle and Later Stone Ages. Final Middle Stone Age assemblages are broadly characterised, inter alia, by large triangular flakes produced on Levallois cores and bifacial or unifacial points; in contrast, the earliest ‘true’ Later Stone Age industry, the Robberg, features abundant unretouched bladelets and other microlithic elements (Lombard et al. Reference Lombard, Wadley, Deacon, Wurz, Parsons, Mohapi, Swart and Mitchell2012). Informal ‘transitional’ assemblages between the two are recognised at a few sites. These ‘early Later Stone Age’ assemblages frequently contain an unstandardised microlithic element that distinguishes them from the preceding final Middle Stone Age. They may also reflect mixing of Middle and Later Stone Age assemblages. Thus, the nature of the technological transition across the period c. 40–20 ka is currently only poorly understood (Mitchell Reference Mitchell2008)—an issue compounded by the scarcity of well-dated, extended archaeological sequences throughout the subcontinent.

Figure 5 shows the KDE model distributions for all radiocarbon dates catergorised in the SARD as relating to either the final Middle Stone Age (n = 92), early Later Stone Age (n = 95) or Robberg (n = 106) technological complexes. The number of final Middle Stone Age dates increases sharply just prior to 40k cal BP before decreasing steadily until 25k cal BP. Conversely, the number of early Later Stone Age dates increases gradually from 35k cal BP to a peak at c. 25k cal BP, just after the last final Middle Stone Age dates are recorded. An earlier concentration of early Later Stone Age dates c. 40k cal BP, demonstrating antiphase patterning with the distribution of final Middle Stone Age dates, all come from the site of Border Cave. This site contains an anomalously early but nevertheless intensively and tightly dated assemblage attributed to the Later Stone Age (for discussions of this designation, see d'Errico et al. Reference D'Errico, Backwell, Villa, Degano, Lucejko, Bamford, Higham and Beaumont2012; Villa et al. Reference Villa, Soriano, Tsanova, Degano, Higham, D'Errico, Backwell, Lucejko, Comas and Beaumont2012; cf. Pargeter et al. Reference Pargeter, MacKay, Mitchell, Shea and Stewart2016). In contrast to the gradual decline in the final Middle Stone Age distribution of dates, the early Later Stone Age distribution declines quite abruptly prior to 20k cal BP. The earliest dates of the Robberg assemblages overlap with those of the early Later Stone Age assemblages for approximately 5000 years, but increase markedly after 17k cal BP.

Figure 5. KDE models for all final Middle Stone Age, early Later Stone Age and Robberg dates in the Southern African Radiocarbon Database.

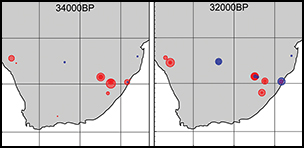
The compilation of dates from the SARD can also be mapped to give a spatial perspective on the Middle to Later Stone Age transition. Figure 6 shows the individual probability distributions of calibrated radiocarbon dates associated with the final Middle Stone Age, early Later Stone Age and Robberg industries across southern Africa in 2000-year time slices, from 34–20k cal BP. The size of the circle reflects the probability of a date occurring within that time slice. The maps clearly show that early Later Stone Age assemblages are earliest in the east of the subcontinent, appearing in the west only after 26k cal BP, and are virtually absent along the well-researched southern Cape coast. They also show that Robberg assemblages occur first on the southern Cape coast and in highland Lesotho, despite the vast distances between these regions, suggesting an extremely rapid spread of the new technology and the necessity for detailed AMS chronologies.

Figure 6. Time-slice maps of calibrated radiocarbon dates for the final Middle Stone Age (red), early Later Stone Age (blue) and Robberg industry (green), constructed using the OxCal mapping feature. Circle size reflects the probability of the calibrated age range for that date lying within the time range of that time slice.

Future developments and conclusion

The design and ongoing maintenance of the SARD allows for the incorporation of new features and larger datasets. Given the extreme time-depth of the southern African archaeological record, a valuable future addition in the SARD will be the inclusion of non-radiocarbon absolute ages derived from methods such as luminescence and uranium-series dating. OxCal must identify and handle non-radiocarbon dates differently from radiocarbon dates to avoid calibrating ages that do not require such manipulation. While modelling non-radiocarbon ages in OxCal is currently possible, an automated arrangement for incorporating such dates from the SARD still needs to be established. This is one of several refinements that we plan to develop. Others include the capability to search by bounding coordinates, and to import new dates directly via the user interface.

The SARD aggregates many decades of archaeological research, and serves as a valuable repository of radiocarbon dates and associated publications. The simple analyses demonstrated here reflect insights into only a few aspects of the subcontinent's archaeological record, but demonstrate the promise of further information through deeper investigation of the database. Other topics that could be explored include the expansion of microlithic technologies during the early and mid Holocene, interaction between hunter-gatherers and farming communities, and the long-term demographic history of southern Africa's drylands compared with those elsewhere in the Southern Hemisphere (Deacon Reference Deacon1974; Sadr & Sampson Reference Sadr and Sampson2006; Barberena et al. Reference Barberena, McDonald, Mitchell and Veth2017). In all of these fields and others, a substantial advantage of the SARD's implementation is its integration with OxCal—software specifically designed for the analysis of radiocarbon probability data. This will also help to ensure the SARD's long-term maintenance and viability as a permanent research tool for investigating the past of southern Africa.

Acknowledgements

E.L. is grateful for support from the Leverhulme Trust Early Career Fellowship programme.

References

Arthur, C. 2008. The archaeology of indigenous herders in the Western Cape of South Africa. Southern African Humanities 20: 205–20.Google Scholar
Barberena, R., McDonald, J., Mitchell, P.J. & Veth, P.. 2017. Archaeological discontinuities in the Southern Hemisphere: a working agenda. Journal of Anthropological Archaeology 46: 111. https://doi.org/10.1016/j.jaa.2016.08.007Google Scholar
Beaumont, P.B. & Vogel, J.C.. 1972. On a new radiocarbon chronology for Africa south of the Equator: part 2. African Studies 31: 155–82. https://doi.org/10.1080/00020187208707381Google Scholar
Bousman, C.B. & Brink, J.S.. 2017. The emergence, spread, and termination of the early Later Stone Age event in South Africa and southern Namibia. Quaternary International 495: 116–35. https://doi.org/10.1016/j.quaint.2017.11.033Google Scholar
Bronk Ramsey, C. 1995. Radiocarbon calibration and analysis of stratigraphy: the OxCal program. Radiocarbon 37: 425–30. https://doi.org/10.1017/S0033822200030903Google Scholar
Bronk Ramsey, C. 2001. Development of the radiocarbon calibration program. Radiocarbon 43(2A): 355–63. https://doi.org/10.1017/S0033822200038212Google Scholar
Bronk Ramsey, C. 2009. Dealing with outliers and offsets in radiocarbon dating. Radiocarbon 51: 1023–45. https://doi.org/10.1017/S0033822200034093Google Scholar
Bronk Ramsey, C. 2017. Methods for summarizing radiocarbon datasets. Radiocarbon 59: 1809–33. https://doi.org/10.1017/RDC.2017.108Google Scholar
Bronk Ramsey, C. & Lee, S.. 2013. Recent and planned developments of the program OxCal. Radiocarbon 55: 720–30. https://doi.org/10.1017/S0033822200057878Google Scholar
Bronk Ramsey, C., Dee, M.W., Rowland, J.M., Higham, T.F.G., Harris, S.A., Brock, F., Quiles, A., Wild, E.M., Marcus, E.S. & Shortland, A.J.. 2010. Radiocarbon-based chronology for dynastic Egypt. Science 328: 1554–57. https://doi.org/10.1126/science.1189395Google Scholar
Bronk Ramsey, C., Albert, P., Blockley, S., Hardiman, M., Lane, C., Macleod, A., Matthews, I.P., Muscheler, R., Palmer, A. & Staff, R.A.. 2014. Integrating timescales with time-transfer functions: a practical approach for an INTIMATE database. Quaternary Science Reviews 106: 6780. https://doi.org/10.1016/j.quascirev.2014.05.028Google Scholar
Bronk Ramsey, C., Lane, C.S., Smith, V.C. & Pollard, A.M.. 2015. The RESET tephra database and associated analytical tools. Quaternary Science Reviews 118: 3347. https://doi.org/10.1016/j.quascirev.2014.11.008Google Scholar
Compton, J.S. 2011. Pleistocene sea-level fluctuations and human evolution on the southern coastal plain of South Africa. Quaternary Science Reviews 30: 506–27. https://doi.org/10.1016/j.quascirev.2010.12.012Google Scholar
Deacon, J. 1974. Patterning in the radiocarbon dates for the Wilton/Smithfield complex in southern Africa. South African Archaeological Bulletin 29(113–114): 318. https://doi.org/10.2307/3887932Google Scholar
D'Errico, F., Backwell, L., Villa, P., Degano, I., Lucejko, J.J., Bamford, M.K., Higham, T.F.G. & Beaumont, P.B.. 2012. Early evidence of San material culture represented by organic artifacts from Border Cave, South Africa. Proceedings of the National Academy of Sciences of the USA 109: 13214–19. https://doi.org/10.1073/pnas.1204213109Google Scholar
Dewar, G.I., Reimer, P.J., Sealy, J.C. & Woodborne, S.. 2012. Late Holocene marine radiocarbon reservoir correction ({Delta}R) for the west coast of South Africa. The Holocene 22: 1481–89. https://doi.org/10.1177/0959683612449755Google Scholar
Fagan, B.M. 1961. Radiocarbon dates for sub-Saharan Africa. Journal of African History 2: 137–39. https://doi.org/10.1017/S002185370000219XGoogle Scholar
Fagan, B.M. 1969. Radiocarbon dates for sub-Saharan Africa: VI. Journal of African History 10: 149–69. https://doi.org/10.1017/S0021853700009336Google Scholar
Fick, S.E. & Hijmans, R.J.. 2017. WorldClim 2: new 1-km spatial resolution climate surfaces for global land areas. International Journal of Climatology 37: 4302–15. https://doi.org/10.1002/joc.5086Google Scholar
Gayo, E.M., Latorre, C. & Santoro, C.M.. 2015. Timing of occupation and regional settlement patterns revealed by time-series analyses of an archaeological radiocarbon database for the South-central Andes (16°–25°S). Quaternary International 356: 414. https://doi.org/10.1016/j.quaint.2014.09.076Google Scholar
Green, C. 2011. It's about time: temporality and intra-site GIS, in Jerem, E., Redo, F. & Szeverenyi, V. (ed.) Proceedings of the 36th CAA Conference 2008: 213–18. Budapest: Archaeolingua.Google Scholar
Hall, M. & Vogel, J.C.. 1980. Some recent radiocarbon dates from southern Africa. Journal of African History 21: 431–55. https://doi.org/10.1017/S0021853700018673Google Scholar
Hogg, A.G., Hua, Q., Blackwell, P.G., Niu, M., Buck, C.E., Guilderson, T.P., Heaton, T.J., Palmer, J.G., Reimer, P.J., Reimer, R.W., Turney, C.S.M. & Zimmerman, S.R.H.. 2013. SHCal13 southern hemisphere calibration, 0–50 000 years cal BP. Radiocarbon 55: 18891903. https://doi.org/10.2458/azu_js_rc.55.16783Google Scholar
Huffman, T.N. 2007. Handbook to the Iron Age: the archaeology of pre-colonial farming societies in southern Africa. Pietermaritzburg: University of KwaZulu-Natal Press.Google Scholar
Linick, T.W., Damon, P.E., Donahue, D.J. & Jull, A.J.T.. 1989. Accelerator mass spectrometry: the new revolution in radiocarbon dating. Quaternary International 1: 16. https://doi.org/10.1016/1040-6182(89)90004-9Google Scholar
Loftus, E., Sealy, J.C. & Lee-Thorp, J.A.. 2016. New radiocarbon dates and Bayesian models for Nelson Bay Cave and Byneskranskop 1: implications for the South African Later Stone Age sequence. Radiocarbon 58: 365–81. https://doi.org/10.1017/RDC.2016.12Google Scholar
Lombard, M., Wadley, L., Deacon, J., Wurz, S., Parsons, I., Mohapi, M., Swart, J. & Mitchell, P.J.. 2012. South African and Lesotho Stone Age sequence updated (I). South African Archaeological Bulletin 67(195): 120–44.Google Scholar
Maggs, T. 1977. Some recent radiocarbon dates from Eastern and Southern Africa. Journal of African History 18: 161–91. https://doi.org/10.1017/S0021853700015486Google Scholar
Martindale, A., Morlan, R., Betts, M., Blake, M., Gajewski, K., Chaput, M., Mason, A. & Vermeersch, P.M.. 2016. Canadian Archaeological Radiocarbon Database (CARD 2.1). Available at: http://www.canadianarchaeology.ca/help (accessed 25 April 2019).Google Scholar
Mason, R.J., Klapwijk, M., Welbourne, R.G., Sandelowsky, B.H. & Maggs, T.. 1973. Early Iron Age settlement of southern Africa. South African Journal of Science 69: 324–26.Google Scholar
Mitchell, P.J. 1997. Holocene Later Stone Age hunter-gatherers south of the Limpopo River, ca. 10,000–2000 B.P. Journal of World Prehistory 11: 359424. https://doi.org/10.1007/BF02220555Google Scholar
Mitchell, P.J. 2008. Developing the archaeology of Marine Isotope Stage 3. South African Archaeological Society Goodwin Series 10: 5265.Google Scholar
Mucina, L. & Rutherford, M.. 2006. The vegetation of South Africa, Lesotho and Swaziland. Pretoria: South African National Biodiversity Institute.Google Scholar
Pargeter, J., MacKay, A., Mitchell, P.J., Shea, J.J. & Stewart, B.A.. 2016. Primordialism and the ‘Pleistocene San’ of southern Africa. Antiquity 90: 1072–79. https://doi.org/10.15184/aqy.2016.100Google Scholar
Pargeter, J., Loftus, E. & Mitchell, P.J.. 2017. New ages from Sehonghong rock shelter: implications for the Late Pleistocene occupation of highland Lesotho. Journal of Archaeological Science: Reports 12: 307–15. https://doi.org/10.1016/j.jasrep.2017.01.027Google Scholar
Pargeter, J., Loftus, E., MacKay, A., Mitchell, P.J. & Stewart, B.A.. 2018. New ages from Boomplaas Cave, South Africa, provide increased resolution on Late/Terminal Pleistocene human behavioural variability. Azania: Archaeological Research in Africa 53: 156–84. https://doi.org/10.1080/0067270X.2018.1436740Google Scholar
Parkington, J.E. & Hall, M.. 1987. Patterning in recent radiocarbon dates from southern Africa as a reflection of prehistoric settlement and interaction. Journal of African History 28: 125. https://doi.org/10.1017/S002185370002939XGoogle Scholar
Reimer, P.J. et al. 2013. IntCal13 and Marine13 radiocarbon age calibration curves 0–50 000 years cal BP. Radiocarbon 55: 1869–87. https://doi.org/10.2458/azu_js_rc.55.16947Google Scholar
Russell, T., Silva, F. & Steele, J.. 2014. Modelling the spread of farming in the Bantu-speaking regions of Africa: an archaeology-based phylogeography. PLoS ONE 9: e87854. https://doi.org/10.1371/journal.pone.0087854Google Scholar
Sadr, K. 2015. Livestock first reached southern Africa in two separate events. PLoS ONE 10: e0134215. https://doi.org/10.1371/journal.pone.0134215Google Scholar
Sadr, K. & Sampson, C.G.. 2006. Through thick and thin: early pottery in southern Africa. Journal of African Archaeology 4: 235–52. https://doi.org/10.3213/1612-1651-10074Google Scholar
Sealy, J.C. 2016. Cultural change, demography, and the archaeology of the last 100 kyr in southern Africa, in Jones, S. & Stewart, B.A. (ed.) Africa from MIS 6-2: population dynamics and paleoenvironments. Dordrecht: Springer. https://doi.org/10.1007/978-94-017-7520-5_4Google Scholar
Stewart, B.A. & Mitchell, P.J.. 2018. Late Quaternary palaeoclimates and human-environment dynamics of the Maloti-Drakensberg region, southern Africa. Quaternary Science Reviews 196: 120. https://doi.org/10.1016/j.quascirev.2018.07.014Google Scholar
Villa, P., Soriano, S., Tsanova, T., Degano, I., Higham, T.F.G., D'Errico, F., Backwell, L., Lucejko, J.J., Comas, D. & Beaumont, P.B.. 2012. Border Cave and the beginning of the Later Stone Age in South Africa. Proceedings of the National Academy of Sciences of the USA 109: 13208–13. https://doi.org/10.1073/pnas.1202629109Google Scholar
Vogel, J.C. 1995. The temporal distribution of radiocarbon dates for the Iron Age in southern Africa. South African Archaeological Bulletin 50: 106109. https://doi.org/10.2307/3889059Google Scholar
Vogel, J.C. & Beaumont, P.B.. 1972. Revised radiocarbon chronology for the Stone Age in South Africa. Nature 237: 5051. https://doi.org/10.1038/237050a0Google Scholar
Vogel, J.C. & Fuls, A.. 1999. Spatial distribution of radiocarbon dates for the Iron Age in southern Africa. South African Archaeological Bulletin 54(170): 97101. https://doi.org/10.2307/3889287Google Scholar
Vogel, J.C. & Marais, M.. 1971. Pretoria radiocarbon dates I. Radiocarbon 13: 378–94. https://doi.org/10.1017/S003382220000850XGoogle Scholar
Vogel, J.C. & Visser, E.. 1981. Pretoria radiocarbon dates II. Radiocarbon 23: 4380. https://doi.org/10.1017/S0033822200037462Google Scholar
Vogel, J.C., Fuls, A. & Visser, E.. 1986. Pretoria radiocarbon dates III. Radiocarbon 28: 1133–72. https://doi.org/10.1017/S003382220002018XGoogle Scholar
Wadley, L. 1993. The Pleistocene Later Stone Age south of the Limpopo River. Journal of World Prehistory 7: 243–96. https://doi.org/10.1007/BF00974721Google Scholar
Williams, A. & Smith, M.. 2013. AustArch3: a database of 14C and luminescence ages from archaeological sites in southern Australia. Australian Archaeology 76: 102.Google Scholar
Figure 0

Figure 1. Southern African Radiocarbon Database: histogram of the entire uncalibrated dataset of approximately 2550 dates (left), and inset of dates less than 10k BP (right).

Figure 1

Figure 2. Distribution of radiocarbon-dated sites currently included in the Southern African Radiocarbon Database.

Figure 2

Table 1. Essential and non-essential criteria for inclusion of an individual radiocarbon date in the SARD.

Figure 3

Figure 3. Southern Africa indicating sites in the Southern African Radiocarbon Database from the southern Cape and Lesotho and its surroundings.

Figure 4

Figure 4. KDE-modelled distributions (blue line) for all radiocarbon dates from the southern Cape and from Lesotho and surrounding regions. Radiocarbon determinations appear in red, the SHCal13 calibration curve in blue and the summed distribution in grey. Calibrated ages are shown as grey crosses, modelled ages as black crosses.

Figure 5

Figure 5. KDE models for all final Middle Stone Age, early Later Stone Age and Robberg dates in the Southern African Radiocarbon Database.

Figure 6

Figure 6. Time-slice maps of calibrated radiocarbon dates for the final Middle Stone Age (red), early Later Stone Age (blue) and Robberg industry (green), constructed using the OxCal mapping feature. Circle size reflects the probability of the calibrated age range for that date lying within the time range of that time slice.