


Introduction
Mafic rock weathering (e.g. basalt), involving chemical and physical processes, is a major process that governs the release and mobility of elements, thus profoundly impacting the geochemical compositions of rivers, seawater, soils and sediments under the various surface conditions of the Earth, which feed back into the long-term evolution of Earth's climate (Sharp et al. Reference Sharp, Tranter, Brown and Skidmore1995, Elango & Kannan Reference Elango, Kannan, Sarkar, Datta and Hannigan2007). By influencing the geochemical characteristics of different components of Earth, water-rock interactions may leave geochemical and mineralogical signals in newly formed sediments of different water reservoirs that, along with their water chemistry, can be used to interpret the source of the primary materials.
Revealing the geochemical records of mafic rock weathering in particularly cold and dry regions such as Continental Antarctica and the sub-Antarctic has been the focus of intensive research (Marra et al. Reference Marra, Madden, Soreghan and Hall2015, Kim et al. Reference Kim, Jeen, Lim, Lee, Kim, Lee and Hong2020), as they have implications for the effects of changing climatic conditions on the global carbon cycle on Earth and for sedimentary processes on Mars dominated by a basaltic crust (Rutledge et al. Reference Rutledge, Horgan, Havig, Rampe, Scudder and Hamilton2018, Thorpe et al. Reference Thorpe, Hurowitz and Dehouck2019).
Chemical weathering and physical weathering generating sediments are often coupled during weathering processes. Compared to Continental Antarctica, enhanced rock weathering is expected in Maritime Antarctic regions due to the presence of a larger deglaciated area where fresh rock surfaces are created and exposed to increasing summer temperatures (Vasyukova et al. Reference Vasyukova, Oliva, Viers, Martin, Dupré and Pokrovsky2019). Water and sediment geochemistry as well as secondary products (e.g. clay minerals) are geochemical archives that can be used to trace the source rocks that contribute to sediment and water geochemistry. For example, the formation of clay minerals is often correlated with the intensity of chemical weathering, and various types of clay minerals (e.g. vermiculite, smectite clays) are reported as evidence for chemical weathering in the Maritime Antarctic (Vasyukova et al. Reference Vasyukova, Oliva, Viers, Martin, Dupré and Pokrovsky2019). However, the factors controlling the geochemical and mineralogical compositions of the sediment and water chemistry characteristics of different reservoirs are complex. Dissolution mechanisms and elemental flux of mafic/ultramafic Maritime Antarctic rocks have been investigated experimentally by Gunes & Balci (Reference Gunes and Balci2021), including the effects of microorganisms. There are unfortunately few studies dealing with the water and particularly sediment geochemistry records of different reservoirs of the Maritime Antarctic (i.e. King George Island; KGI). Furthermore, the sources of the chemical constituents within the various water reservoirs (e.g. lakes, streams) are not clearly known. The chemical composition of fresh water is limited to a few studies carried out primarily on Livingston Island (Toro et al. Reference Toro, Camacho, Rochera, Rico, Bañón and Fernández-Valiente2007), James Ross Island (Hawes & Brazier Reference Hawes and Brazier1991) and the western shore of Admiralty Bay (Nędzarek et al. Reference Nędzarek, Tórz and Podlasińska2015, Zwoliński et al. Reference Zwoliński, Kejna, Rachlewicz, Sobota, Szpikowski, Beylich, Doxon and Zwoliński2016).
The western shore of Admiralty Bay, located in KGI in the Maritime Antarctic, is characterized by mild temperatures and considerable precipitation along with a large ice-free area underlain predominantly by mafic rocks. This Maritime Antarctic site offers an excellent opportunity to reveal the influence of contemporary rock weathering on the water and sediment geochemistry of various freshwater reservoirs created by glacial meltwater in the form of ephemeral and perennial streams and lakes. Although the geology (Birkenmajer Reference Birkenmajer2003, Mozer Reference Mozer2012), hydrology/hydrogeology (Szopińska et al. Reference Szopińska, Szumińska, Bialik, Chmiel, Plenzler and Polkowska2018, Potapowicz et al. Reference Potapowicz, Szumińska, Szopińska, Bialik, Machowiak, Chmiel and Polkowska2020) and sediment geochemistry (Santos et al. Reference Santos, Fávaro, Schaefer and Silva-Filho2007, Mozer Reference Mozer2012) of the western shore of Admiralty Bay have been studied over the years, the rock weathering processes and associated geochemical fingerprints linked to widespread deglaciation processes have not been comprehensively studied. By conducting this research, we attempt to answer the following main questions: 1) What are the main sources influencing the water and sediment geochemistry under the influence of the Maritime Antarctic climate? 2) To what extent are the weathering processes faithfully reflected in the sediment and water geochemistry as well as in the secondary mineral products? To improve our current understanding of rock weathering processes and their geochemical records under Maritime Antarctic conditions, we use an integrated approach composed of studying the partitioning of major and trace elements among the different reservoirs (rocks, sediments, water), along with their mineralogical and geochemical compositions. For this purpose, various rocks, sediments and surface waters from perennial and ephemeral streams, lakes and meltwaters were collected within the western shore of Admiralty Bay, KGI, South Shetland Islands (SSIs), Antarctic Peninsula.
Description of study area
The main study area, the western coast of Admiralty Bay, is located in KGI, the largest of the SSIs, which are sited on the northernmost part of the Antarctic Peninsula. The island group is separated from the Antarctic Peninsula by the Bransfield Strait extension (Fig. 1). The study area is a part of the Warszawa Block (Birkenmajer Reference Birkenmajer2003) with an ~1310 km2 surface area. The majority of the surface area (~90%) is permanently glaciated, and permafrost processes are generally restricted to the ice-free area. Recent studies conducted on the SSIs show that permafrost ranging from 20 to 100 cm in thickness is most common in the ice-free areas of the sub-Antarctic region (López-Martínez et al. Reference López-Martínez, Serrano, Schmid, Mink and Linés2012).

Fig. 1. Location map of Admiralty Bay, King George Island, South Shetland Island Group, Antarctica.
From south to west, the elevation of the terrain changes from 60 to 170 m above sea level. The area is under the influence of the sub-polar and Maritime Antarctic climate, characterized by short-term weather and current variability (e.g. year to year) resulting from the interactions between the ocean, atmosphere and sea ice (Oerlemans & Fortuin Reference Oerlemans and Fortuin1992). The annual average temperature range is -1.8 to +4°C. The annual humidity is 82% and the pressure is 991 hPa. In general, the area is characterized by rainfall and snowfall, with the mean annual precipitation rate being 550 mm near Arctowski Station, Admiralty Bay (Beyer Reference Beyer2002). Ice-free areas are locally vegetated with mosses and lichens.
The main study area, the western shore of Admiralty Bay, is located on the Warszawa Block, KGI, where the ages of the stratigraphic units range from Late Cretaceous to Early Miocene. The studied area is composed of volcanic, volcanoclastic and, to a lesser extent, sedimentary rocks. Volcanic units range from basalt to dacite in composition, while sedimentary units are mostly composed of conglomerate and shale. The hypabyssal intrusions are in the form of basalt-andesite plugs and dykes. Overall, K2O abundance of the area is in the range of the calc-alkaline series (Birkenmajer et al. Reference Birkenmajer, Francalanci and Peccerillo1991).
The majority of the sampling area is in Antarctic Specially Protected Area (ASPA) No. 128 and comprises 46 streams ranging from small (meltwater) to continuously running perennial streams, along with 36 lakes and ponds. Most of the surface water sources are ephemeral, being fed by glacial melt and/or snowmelt. The presence of a permafrost layer inhibiting infiltration limits detailed hydrological study due to the inconsistency and difficulty of determining the amounts and exact flows of the streams (i.e. short freeze-thaw cycle) (Zwoliński et al. Reference Zwoliński, Szpikowski and Wiśniewska2012).
The current research was conducted on seven streams, two previously uncharacterized lakes and one glacier located on the largest ice-free area of KGI (Fig. 2). The Petrified Forest Creek (PFC), at 1.62 km in length, represents the longest stream fed by snowmelt, rainfall and permafrost thaw, draining the ice-free area to the south-west and south of the Henryk Arctowski Polish Antarctic Station. During summer, its flow rate changes from 10 to 50 m3 s-1 (Szopińska et al. Reference Szopińska, Szumińska, Bialik, Chmiel, Plenzler and Polkowska2018), and PFC is classified as a non-glaciated catchment without tundra. Italian Valley Creek (IV), located at the shore of Ezcurra Inlet and probably fed by permafrost thaw, shows weak but continuous water flow over various types of moraines until it reaches the bay. Similarly, Vanishing Creek (VC) flows over fine-grained moraines with a low discharge. These two creeks are fed by Ecology Glacier. Ecology Glacier Creek (EG) drains the immediate forefield of Ecology Glacier and flows on poorly sorted moraine deposits with contributions of snow patch melt. The other three small streams studied for the first time are associated with Upper Lake (UL), Mud Lake (ML) and Tower Glacier and are named as ‘Upper Creek’ (UC), ‘Mud Creek’ (MC) and ‘Tower Creek’ (TC). UL and ML are both located on Paradise Cove in the Demay region. UL is dominantly fed by Tower Glacier (Fig. 2), and the stability of the lake is therefore highly dependent on daily and seasonal atmospheric conditions. Compared to UL, ML is located in a more preserved area covered by high topography. The catchment areas in close proximity to the lakes are generally barren, deglaciated landscapes with the occasional presence of mosses and lichens. Currently, there is no available information on either the hydrological or the geochemical properties of the lakes, and this study provides the first detailed research on these lakes.

Fig. 2. Field sampling points of the studied areas. Each circle indicates water and the associated sediment, and the triangles and crosses indicate mineralogically and elementally characterized rocks, respectively. EG = Ecology Glacier Creek; IV = Italian Valley Creek; MC = Mud Creek; ML = Mud Lake; PFC = Petrified Forest Creek; TC = Tower Creek; UC = Upper Creek; UL = Upper Lake; VC = Vanishing Creek.
Material and methods
Field sampling and measurements
The field excursion was conducted at the end of the summer of 2018 (17 March–12 April) to collect rocks, sediments and surface water samples from the western shore of Admiralty Bay. A list of rocks, sediments and surface water samples is presented in Table S1. Representative bedrocks (n = 12) were collected within Admiralty Bay (Fig. 2). Surface water and sediment samples were collected from lakes (UL at six different points and ML at five different points; Fig. S1) and streams (PFC at seven different points, UC at three different points, IV, MC and EG at two different points and TC and VC at one different point; Fig. S2 & Table S1). The sediment and water samples were labelled with the stream and lake names. The lowest-numbered sample indicates that the sample was collected nearest to or at the mount of the stream. A careful sampling strategy was applied to collect samples in particular waters, at the mouth and ends of the creeks and near the middle of the flow channel, if possible. The sampling was also undertaken in such a way as to minimize contamination (e.g. human-induced), and polyethylene gloves were used during the sampling. Water samples (n = 29) were manually collected into 1 l high-density polyethylene (HDPE) bottles, and each bottle was rinsed with the respective surface water three times before filling. Subsequently, the first 200 ml of water was immediately filtered through sterile, single-use Millipore filters (0.2 μm) and 100 ml was acidified with ultrapure HNO3 acid (pH < 2; Merck) for cation and trace metal analysis, stored in HDPE bottles previously washed with ultrapure HCI (0.1 M; Merck) and rinsed with ultrapure water, and the rest of the filtered water was preserved for anion analysis without acidification. All bottles were filled completely to prevent possible evaporation into the headspace and further covered by parafilm and stored at +4°C until being analysed. After sampling, analysis of the physicochemical properties of the unfiltered water samples (pH, electrical conductivity (EC) and temperature) as well as total dissolved solid (TDS) measurements were performed in situ by using a pre-calibrated WTW multiprobe (WTW 303). Before the measurements, the pH electrode was calibrated against a NIST buffer solutions (pH = 4 and 6.8 at 25°C) with an accuracy of ± 0.03 pH units.
Surface sediments were manually collected from each water (lake and stream) sampling point with a pre-sterilized metal spoon. Upon collection, each sediment sample was stored in an airtight sterile plastic sampling bag, and all samples (n = 27) were stored at +4°C until being analysed.
Chemical analysis of streams, lakes and meltwaters
Major anions (SO42−, NO2−, NO3−, F−, CaCO3, HCO3−, CO32− and Br−; n = 5), cations (Mg2+, Ca2+, K+ and Na+) and trace element concentrations (n = 29) were measured using ion chromatography (Dionex ICS 2000) and inductively coupled plasma-mass spectrometry with uncertainties of 5% and 2%, respectively, at ACME Bureau Veritas Mineral Laboratories (Canada). Alkalinity was measured by using a MColortest™ 111109 test (acid capacity to pH 8.2 and 4.3; titrimetric method with an MQuant® titration pipette).
Chemical and mineralogical analysis of rocks and sediments
Mineralogical analysis of both altered and unaltered rock samples was performed on polished thin sections (n = 12) using a Leica DM 750P polarized microscope and X-ray diffractometer (XRD) at Istanbul Technical University (ITU) Laboratory. Unaltered representative rock samples (n = 5) and sediment samples (n = 27) previously dried at 50°C in a desiccating oven overnight were carefully crushed, pulverized and homogenized. The sediment samples were further sieved through a 2 mm sieve and powdered rock and sediment samples were used for major and trace element analyses. Elemental analyses were performed at ACME Bureau Veritas Mineral Laboratories (Procedure Code: MA250).
For XRD analysis, rock and sediment samples that had been previously crushed and ground to powder were thoroughly rinsed with deionized water and acetone. The samples were then collected on a silicon sample holder and measurements were performed with a D8 Advance Bruker diffractometer using Cu-Kα radiation. Data were collected between 2° and 72° with a total counting time of 15 min. The X'Pert HighScore Plus software was used for background subtraction, peak identification and matching with XRD patterns of reference compounds (US Institute of Standards and Technology).
The grain size distributions of the representative sediment samples obtained from lakes (ML (n = 1) and UL (n = 1)) and streams (PFC (n = 7), MC (n = 1) and UC (n = 1)) were analysed. First, bulk sediment samples were sieved by using ASTM mesh sizes of 230, 200, 140, 60, 35 and 10. After removing the particles > 2 mm, Mastersizer analysis was conducted on the remaining sediments by using sodium hexametaphosphate as a dispersant (Mastersizer 3000 User Manual (Mano474 Issue 2.1, August 2013)). Each analysis was run three times with ultrasound on and the particle size percentages were obtained via Mastersizer 3000 software.
The total organic carbon (TOC) content of the sediments was analysed by using the Walkley-Black (WB) chromic acid wet oxidation method (Gaudette et al. Reference Gaudette, Flight, Toner and Folger1974, Sarı et al. Reference Sarı, Ünlü, Balcı, Apak, Kurt and Koldemir2013). In brief, concentrated H2SO4 is added to a mixture of sediment and 1 N aqueous K2Cr2O7. The heat resulting from the addition of H2SO4 raises the temperature sufficiently to induce substantial oxidation. Residual dichromate is titrated by ferrous sulphate. The difference in added FeSO4 compared with a blank titration gives the amount of easily oxidisable organic carbon. The percentage of WB carbon (WBC) is given by the following formula:
 $${\rm WBC\ } = M \times ( {V_1-V_2} ) /W \times 0.30 \times {\rm CF}$$
where M is the molarity of the FeSO4 solution (from blank titration), V 1 is the volume (ml) of FeSO4 required in blank titration, V 2 is the volume (ml) of FeSO4 required in actual titration and W is the weight (g) of the dried sediment sample. The correction factor (CF) acts as a compensation for the incomplete oxidation and is the inverse of the recovery, set by Walkley & Black (Reference Walkley and Black1934) to 1.32 (recovery of 76%).
Results
Basic characteristics and major ion chemistry of fresh water
In general, all water samples, regardless of the sampling location and type, have slightly alkaline characteristics, with pH values ranging from 7.9 to 9.0 and EC values ranging from 100 to 260 μS/cm (Table I). The TDS values varied from 50 to 260 ppm with an average of 85 ppm. Compared to the lakes, stream waters have high TDS values. In general, major cations in all the water samples exhibit similar values. On a molar basis, Na+ accounts for > 65% of the total cations, while K+ represents a minor component of the water samples (< 1.5%). Compared to Na+, Ca2+ and Mg2+ commonly account for > 20% of the total cations; averaging ~29% (22% Ca2+) in the PFC, 27% (24% Ca2+) in the UC, 23% (21% Ca2+) in the MC, 20% (13% Ca2+) in the IV, 28% (25% Ca2+) in the TC, 24% (18% Ca2+) in the VC and 21% (16% Ca2+) in the EG meltwater. Similarly, Ca2+ and Mg2+ in the lake waters account for 26% (23% Ca2+) and 23% (21% Ca2+) of the total cations in the UL and ML, respectively. HCO3− is the most abundant anion in the ML, accounting for an average of 68% of total anions, while it is the second most abundant anion (47% of total anions) in the UL. Averages of 63% and 53% of total anions in the outflow water (MC) of ML and in the VC stream water are composed of HCO3−, respectively. In contrast, stream waters showed the lowest HCO3− values, accounting for < 40% of the total anions, particularly in the PFC (average of 36%) and TC (37%) streams and the EG (38%) meltwater. Except for the ML (average of 24%), its outflow waters (MC, 29%) and the VC (47%) stream, Cl− is the most dominant anion, with a concentration ranging from 0.338 to 1.156 mmol/l. SO42− ranges from 0.010 to 0.281 mmol/l, and the highest values occur in the UL (Table I). NO3− is below the detection limits for the majority of samples. The molar sum of the two anions (SO42−, Cl−) is highly dependent on the sample, accounting for between < 35% and > 65% of the total anions, where SO42− alone accounts for an average of 7%. Dissolved silica is mainly derived from silicate weathering and shows fairly uniform values across the study area. The mean concentration of dissolved silica is 0.049 mmol/l in the lakes and 0.058 mmol/l in the lake-associated outflow waters, while its values are 0.085 and 0.045 mmol/l in the PFC and IV stream waters, respectively. Frontline meltwaters (EG and VC) have dissolved silica contents ranging from 0.030 to 0.10 mmol/l. Among the water catchment areas, PFC showed the highest Si content, followed by ML and UL. The lowest Si values were detected in the IV2 and EG2 waters obtained from frontline meltwaters. All water samples display low Fe and Al concentrations in accordance with their slightly alkaline characteristics.
Table I. Physicochemical, major anion and cation compositions of waters.

bdl = below detection limits; EC = electrical conductivity; EG = Ecology Glacier Creek; IV = Italian Valley Creek; MC = Mud Creek; ML = Mud Lake; n.a. = not analysed; PFC = Petrified Forest Creek; T = temperature; TC = Tower Creek; TDS = total dissolved solids; UC = Upper Creek; UL = Upper Lake; VC = Vanishing Creek.
Based on the major cation and anion characteristics of all water samples, surface waters of the western shore of Admiralty Bay can be mainly categorized into two groups as sodium chloride-rich and sodium bicarbonate-rich waters, except for ML, which indicates a mixed type due to its plotting more closely to the bicarbonate end of the spectrum (Fig. 3).

Fig. 3. Piper diagram showing the relative abundances of the major ion concentrations of the water samples. EG = Ecology Glacier Creek; IV = Italian Valley Creek; MC = Mud Creek; ML = Mud Lake; PFC = Petrified Forest Creek; TC = Tower Creek; UC = Upper Creek; UL = Upper Lake; VC = Vanishing Creek.
Mineralogy and geochemistry of bedrocks and sediments
Mineralogical identifications of B2, B3 and B7 bedrocks, collected from in the vicinity of Ezcurra Inlet in the north-west of Admiralty Bay, revealed the presence of andesine, clinopyroxene, magnetite and augite, while albite, mordenite, magnetite, titanomagnetite and vermiculite were present in B1, B5, B6, B8, B9 and B10 rock samples (Fig. 2). Minor amounts of glassy material were particularly observed in B2, B3 and B7 rock samples. Altered rock samples B4, B11 and B12 comprise albite as plagioclase, unidentified zeolites, augite, natrolite, hematite, heulandite, spangolite and quartz (Fig. S3).
The whole-rock geochemistry analyses show that the bedrocks (mafic volcanic rocks) are basalt-basaltic andesite in composition (Table II). Consistently, the SiO2 contents of the bedrocks range from 51.43% to 62.90%, implying a mafic to intermediate nature of the bedrocks in the studied area. In general, the rock samples have high Al2O3 contents ranging from 15.66% to 20.12%. As expected, a good negative correlation exists between SiO2 and Al2O3 (R = -0.88), Fe2O3(T) (R = -0.97), CaO (R = -0.92), MgO (R = -0.95) and TiO2 contents (R = -0.66) in the bedrocks. In contrast, there are slight and strong positive correlations, respectively, between SiO2 and Na2O (R = 0.44) and K2O contents (R = 0.95) (Table II).
Table II. Major oxide, total organic carbon (TOC), loss on ignition (LOI), Index of Compositional Variability (ICV), Chemical Index of Alteration (CIA), Plagioclase Index of Alteration (PIA) and Mafic Index of Alteration (MIA) values of sediment and rock samples (in %).

EG = Ecology Glacier Creek; IV = Italian Valley Creek; MC = Mud Creek; ML = Mud Lake; n.a. = not analysed; PFC = Petrified Forest Creek; TC = Tower Creek; UC = Upper Creek; UL = Upper Lake; VC = Vanishing Creek.
Loss on ignition (LOI) values range from 4.8% to 7.9%, indicating the presence of various amounts of carbonate, organic matter, phyllosilicates and, to a lesser extent, amphiboles. Major oxides diagrams of SiO2 vs Al2O3 and SiO2 vs CaO indicate slight compositional variability among the samples. For example, SiO2 contents range from 52.2% to 60.9% and Al2O3 contents range from 14.9% to 17.1%. As observed in the rocks, a good negative correlation exists between SiO2 and Al2O3 in the ML (R = -0.8) and UL (R = -0.8) sediments, and a moderate negative correlation exists in the PFC sediments (R = -0.4). Consistently, there are good negative correlations between SiO2 and Fe2O3 in the ML (R = -0.8) and UL sediments (R = -0.95) and a weak negative correlation in the PFC sediments (R = -0.3) (Fig. 4). Although there are no clear subdivisions between sediment samples based on bedrocks, the cross-plots of SiO2 vs CaO, Al2O3 vs K2O and Al2O3 vs CaO suggest that the lakes sediments dominantly originated from andesite, while the stream channel sediments are both from andesite and basaltic-andesine, as revealed by the total alkali-silica diagram (Fig. 5) (Le Bas et al. Reference Le Bas, Maitre, Streckeisen and Zanettin1986). Overall, the major element concentrations of all sediments followed the order of Si > Al > Fe > Ca = Na > Mg > K.

Fig. 4. Bivariate plots of the oxides of CaO. a. & b. K2O vs Al2O3 and c.–f. Al2O3. TiO2. Fe2O3. CaO vs SiO2 in the sediment and bedrock from the western part of Admiralty Bay. EG = Ecology Glacier Creek; IV = Italian Valley Creek; MC = Mud Creek; ML = Mud Lake; PFC = Petrified Forest Creek; TC = Tower Creek; UC = Upper Creek; UL = Upper Lake; VC = Vanishing Creek.
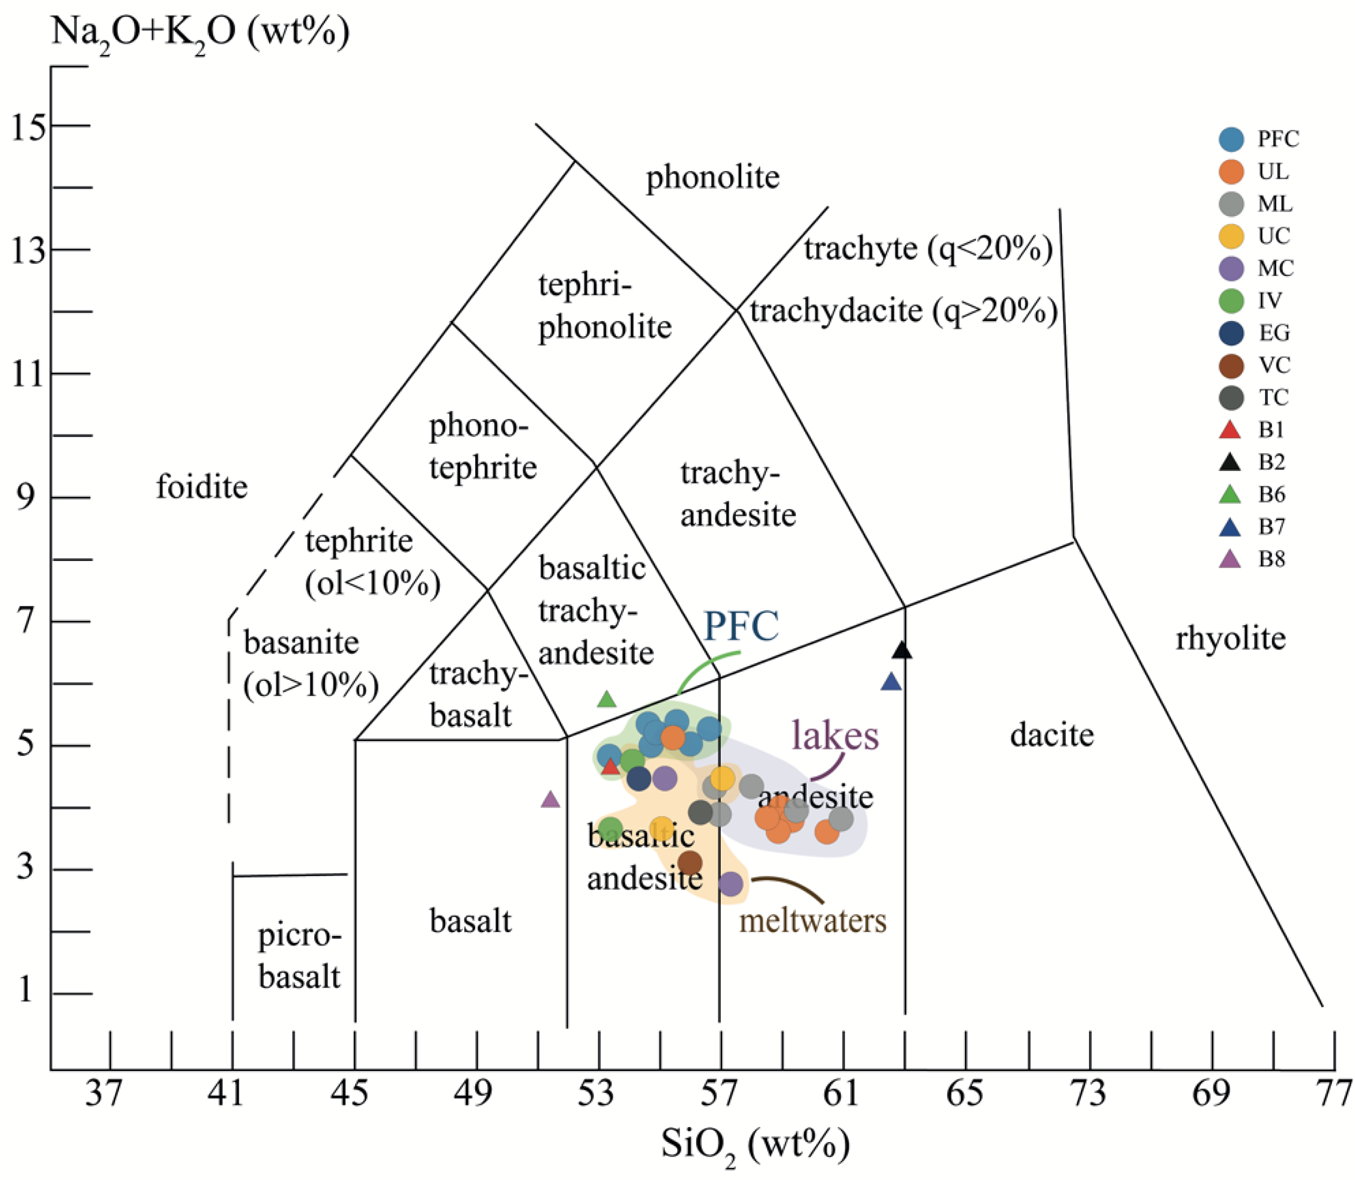
Fig. 5. Comparison of the sediment samples with the bedrocks in the total alkali-silica diagram (Le Bas et al. Reference Le Bas, Maitre, Streckeisen and Zanettin1986). EG = Ecology Glacier Creek; IV = Italian Valley Creek; MC = Mud Creek; ML = Mud Lake; ol = olivine; PFC = Petrified Forest Creek; q = quartz; TC = Tower Creek; UC = Upper Creek; UL = Upper Lake; VC = Vanishing Creek.
The mineralogical compositions of all sediments (bulk) comprise predominantly plagioclases as either albite or anorthite accompanied by quartz, zeolite group minerals (stilbite, laumontite, gonnardite and natrolite) and clay minerals (undifferentiated smectites and vermiculite). Magnetite and occasionally calcite were present. The comparison of sediment mineralogy reveals some differences in particular zeolite group minerals. For example, a wide range of zeolite minerals (stilbite, laumontite, gonnardite and natrolite) were only identified in the PFC sediments throughout the flow paths from source to sink with almost identical mineral compositions (Fig. S4). The bulk mineral compositions of ML and UL are similar to those of their stream channel sediments (MC and UC), comprising predominantly plagioclase and quartz as suggested by the intensity of the peaks. Anorthite was identified only in the ML sediments, while zeolite minerals of laumontite and faujasite were only present in the UL sediments. As suggested by the peak intensity, clay minerals comprise a minor part of the sediments. The broad carbon peak occasionally observed in the PFC sediments is attributed to the remnants of wood fragments from the vegetated, pre-glaciation period (Mozer Reference Mozer2012).
The TOC content of the sediments showed great variability among the samples, ranging from 0.01% to 1.14% with an average value of 0.35%. Relative to the stream sediments, the lake sediments have slightly higher TOC contents (e.g. UL3 and ML4; Table II). In contrast to the stream sediments, a strong positive correlation exists between the TOC and LOI contents of the UL (R = 0.76), indicating that LOI values represent the organic matter content, while ML sediments exhibiting a strong negative correlation (R = -0.89) probably represent other sources, such as inorganic carbon and/or hydrated minerals (e.g. clays).
Trace and rare earth element distributions
The trace element and rare earth element (REE) compositions of the sediments and the bedrocks are presented in Table III. The average concentrations of Rb, Sr and Ba range from 10.0 (B1) to 82.6 (B7) ppm, from 461.8 (B2) to 1005.6 (B6) ppm and from 219 (B8) to 615 (B6) ppm in the bedrocks, respectively. In the sediments, Rb ranges from 2.0 (EG) to 28.58 ppm (ML), Sr from 383.0 (MC) to 657.5 ppm (IV) and Ba from 130 (EG) to 430 ppm (UL). There exists a clear correlation between SiO2 wt% and trace elements, as presented in Fig. 6. Ba, Zr, La, Ce and, to a lesser degree, U and Th positively correlate with increasing SiO2 contents, whereas V, Ni, Cu, Zn, Sc and Sr correlate negatively. A significant increase in Pb contents of the sediments relative to the bedrocks is evident. Ocean island basalt-normalized REE distribution patterns of the sediments and the bedrock samples are presented in Fig. 7.

Fig. 6. Correlation plots of the trace elements (ppm) against SiO2 (wt%).

Fig. 7. Ocean island basalt-normalized rare earth element distribution patterns of sediments and bedrocks of the western part of Admiralty Bay (Sun & McDonough Reference Sun, McDonough, Saunders and Norry1989). EG = Ecology Glacier Creek; IV = Italian Valley Creek; MC = Mud Creek; ML = Mud Lake; PFC = Petrified Forest Creek; TC = Tower Creek; UC = Upper Creek; UL = Upper Lake; VC = Vanishing Creek.
Table III. Average trace element and rare earth element (REE) concentrations (ppm) of the bedrocks and sediments of the western part of Admiralty Bay.

bdl = below detection limits; EC = electrical conductivity; EG = Ecology Glacier Creek; IV = Italian Valley Creek; MC = Mud Creek; ML = Mud Lake; n.a. = not analysed; PFC = Petrified Forest Creek; TC = Tower Creek; UC = Upper Creek; UL = Upper Lake; VC = Vanishing Creek.
Grain size distribution
The grain size distribution of the particles varied among the stream channel, lake and lake-associated outflow sediments. In contrast to the lake sediments, the majority of the stream channel sediments are sand-sized (2 mm; Fig. 8). In the stream channel (PFC) and the lake outflow sediments (MC and UC), the fine fraction sediments (clay to silt size; < 63 μm) comprise < 0.4% of the bulk sediments. Consistently, outflow stream sediments (MC and UC2) contain dominantly granule size materials (> 2 mm), ranging from 53% to 60%, and the remainder is composed of mostly coarse to very coarse sand (from 33% to 38%). The lake sediments are composed of very fine to fine size sand fractions (50% in the ML and 26% in the UL) along with > 3% and 1% clay to silt size fractions in the ML and UL sediments, respectively (Table S2).

Fig. 8. Grain size distribution of selected sediments. Results of sieve analysis; weight in percentages. MC = Mud Creek; ML = Mud Lake; PFC = Petrified Forest Creek; UC = Upper Creek; UL = Upper Lake.
The distribution of particles size < 2 mm showed that the majority of the stream channel sediments consist of materials with a size of > 63 μm (80% ± 8%). The lake and the lake-associated outflow stream sediments hold the largest amount of < 4 μm-sized particles (from 9% to 18%) and correspondingly fewer > 63 μm-sized fractions (from 45% to 55%) (Table S2).
Discussion
Sources of major ions as inferred from water chemistry
The relative contributions of water-rock interactions, atmospheric deposition and evaporation-induced crystallization to the surface water chemistry of the western part of Admiralty Bay were evaluated. The surface waters of the western part of Admiralty Bay are classified into two groups: Na+-CI− and Na+-HCO3− (Fig. 3). Na+ and CI−-normalized Gibbs plots revealed that the majority of water samples were predominantly plotted in the atmospheric precipitation (marine aerosols) area with a few samples indicating rock weathering, but not by evaporation (Fig. 9). Our results accord well with those obtained from Thomas Point Oasis, Admiralty Bay, and Potter Peninsula on KGI, as well as those of Nędzarek et al. (Reference Nędzarek, Tórz and Podlasińska2015). As in the current study, the authors showed that various freshwater bodies were dominated by Na+ and CI− ions (Nędzarek et al. Reference Nędzarek, Tórz and Podlasińska2015, Szopińska et al. Reference Szopińska, Szumińska, Bialik, Chmiel, Plenzler and Polkowska2018). Compared to the lake waters, the stream water samples, particularly those obtained from the frontline of meltwaters (EG and VC) in close proximity to the glacial zone (TC), clearly reflect atmospheric precipitation (marine aerosols or sea spray) as the main elemental input into water (Fig. 9).

Fig. 9. Gibbs plots of stream meltwater and lake water of the western part of Admiralty Bay. EG = Ecology Glacier Creek; IV = Italian Valley Creek; MC = Mud Creek; ML = Mud Lake; PFC = Petrified Forest Creek; TC = Tower Creek; TDS = total dissolved solids; UC = Upper Creek; UL = Upper Lake; VC = Vanishing Creek.
In Fig. 10a, by comparing with lake waters (ML and UL), the majority of the stream data points closely plot a 1:1 trend line, suggesting that atmospheric deposition (marine aerosols) is a significant source, particularly for the stream waters. Conversely, the majority of the lake water data deviate from and scatter below the 1:1 trend line, suggesting Na+ enrichment. Therefore, the excess Na+ and K+ to Cl− should be derived from sodium and potassium aluminosilicate weathering. It is particularly noticeable that the Na+/Cl− ratios of the lake waters and associated outflow waters are significantly greater than those of the stream waters, further implying the significance of water-rock retention time for the intensity of chemical weathering (Table IV). Figure 10b shows that Ca2+ and Mg2+ are less relevant to sulphate sources, except that a minor contribution of sulphate to MC1 and UL2 may be attributed to atmospheric deposition or localized sulphate-bearing secondary phases. In the Ca2+ + Mg2+ vs HCO3− scatter diagram, the ionic compositions of ML, its outflow waters (MC) and a few points from UL fall above the 1:1 trend line. Compared to the stream waters, a significant increase in the bicarbonate trend of the lake waters, irrespective of Ca2+ and Mg2+ contents, is a good indication for weathering of prevailing Na-rich silicate rocks in the water catchment areas (Figs S3 & S4). Accordingly, excess Ca2+ + Mg2+ to HCO3− is a good indication of atmospheric precipitation. In fact, a strong correlation exists, particularly in the stream waters, between Mg2+ and CI− ions (e.g. PFC, R = 0.94; UL, R = 0.91), further implying an atmospheric origin for the Mg2+ ions. In order to further evaluate the contributions of atmospheric sources to the major ions of surface waters, we estimated the highest chloride concentration from atmospheric input to be 1.05 mmol/l (average of the EG samples). This estimation is based on the samples (EG) that show the highest atmospheric input as revealed by Gibbs plots (Fig. 9). Then, the relative contributions of Na+ ions released by silicate weathering can be evaluated, as the 1:1 ratio of Na+/Cl− is attributed to salt dissolution (Elango & Kannan Reference Elango, Kannan, Sarkar, Datta and Hannigan2007). This estimate may carry some uncertainties regarding the actual amount of atmospheric input for each sample, as atmospheric precipitation can spatially and temporarily vary. Nevertheless, the highest CI− content of water may help to confine the upper limit of atmospheric input of major ions in the studied area.

Fig. 10. Plots of a. Cl− vs Na+, b. (HCO3− + SO42−) vs (Ca2+ + Mg2+), c. HCO3− vs (Ca2+ + Mg2+) and d. HCO3− vs (Na + K)Si. EG = Ecology Glacier Creek; IV = Italian Valley Creek; MC = Mud Creek; ML = Mud Lake; PFC = Petrified Forest Creek; TC = Tower Creek; UC = Upper Creek; UL = Upper Lake; VC = Vanishing Creek.
Table IV. Ratios of selected major elements used as source indicators for water samples.

EG = Ecology Glacier Creek; IV = Italian Valley Creek; MC = Mud Creek; ML = Mud Lake; n.a. = not analysed; PFC = Petrified Forest Creek; TC = Tower Creek; UC = Upper Creek; UL = Upper Lake; VC = Vanishing Creek.
After subtraction of Na+ precipitated from atmospheric input from the measured Na+, the remainder is the fraction of Na+ (named as NaSi) from silicate weathering. Figure 10d was constructed by using NaSi + K vs HCO3−, and it suggests that, except for lake waters, the majority of the data points imply a relatively large atmospheric input. A remarkable difference in grain sizes of the stream (PFC) and lake samples and their outflow sediments is probably an important factor in the enhanced silicate dissolution in the lakes of Admiralty Bay.
Marine aerosols determine the ionic composition of atmospheric inputs and show variation during the winter and summer seasons, mainly due to changes in the area covered by ice in Admiralty Bay. It is well demonstrated that concentrations of major ions in atmospheric inputs increase during summer (~500 mm/year for Admiralty Bay; Beyer Reference Beyer2002). As a result, the relative contribution of atmospheric precipitation to the major ion compositions of the streams and lakes in the Maritime Antarctic is probably more intense during summer seasons. Compared to KGI, another long-term studied region on the continent, the Antarctic Dry Valleys (ADVs), exhibit highly dissimilar atmospheric properties. The mean annual temperatures in the ADVs are between -15°C and -30°C, and the valley bottoms reach an annual maximum of ~50 mm precipitation (in the form of snow) water equivalent (Obryk et al. Reference Obryk, Doran, Fountain, Myers and McKay2020). Variations in the Na+/Cl− ratio are frequently used to trace their sources. An Na+/Cl− ratio exceeding 1.7 in the surface waters of the ADVs is an indicator for the salts originated from weathering of mirabilite or feldspars (Green et al. Reference Green, Angle and Chave1988, Nędzarek Reference Nędzarek, Tórz and Podlasińska2015). Accordingly, the Na+/Cl− ratios of PFC samples (1.2–1.6) indicate that the salts mainly originated from atmospheric precipitation (Table IV). Consistently, as observed in the Gibbs plots, water samples from EG and IV, with the lowest Na+/Cl− ratios, clearly indicate that the salts originated from atmospheric deposition (Fig. 9 & Table IV).
In contrast, the Na+/Cl− ratios of lake waters (ML and UL) and their outflow waters (MC and UC) did exceed 1.7, implying the weathering of silicate, mainly feldspars, as the predominant source that contributed to these salts. Similarly, the high Ca2+/Mg2+ ratios of the respected samples further highlight the contribution of silicate weathering to the water chemistry of the lakes and associated outflow waters.
The Na+/Cl− and Ca2+/Mg2+ ratios measured in the stream and lakes waters of Admiralty Bay are significantly higher than those measured in the previous studies on KGI (Thomas Point Oasis, KGI, Na+/Cl− < 1.15; Ca2+/Mg2+ = 0.89), but they are lower than the ADVs (Na+/Cl− > 1.7; Ca2+/Mg2+ = 2.6–20.7) (Green et al. Reference Green, Angle and Chave1988, Nędzarek et al. Reference Nędzarek, Tórz and Podlasińska2015, Szopińska et al. Reference Szopińska, Szumińska, Bialik, Chmiel, Plenzler and Polkowska2018). The Mg2+/Cl− ratio of the lakes and associated waters was two times lower in comparison to the stream waters (e.g. PFC). A comparatively higher Mg2+/Cl− ratio indicates that Mg2+, similar to Na+ and Ca2+, predominantly originated from atmospheric precipitation in the stream waters. Similarly, the low Ca2+/Na+ ratio (0.1–0.2) varied uniformly among all of the water samples, and the HCO3−/Cl− ratio being greater in the lake samples showed that Na+ and CI− are dominant ions in the stream waters, while Na+ and HCO3− are dominant in the lake waters. These results suggest that the ionic compositions of the stream waters in Admiralty Bay, in contrast to the lake waters, are predominantly under the influence of atmospheric precipitation occurring via evaporation and accumulation of the salts in the sediments and their subsequent washing out.
Major element changes as indications of weathering degree
Changes in the major cation contents of sediments are widely used to estimate the degree of chemical weathering (Young & Nesbitt Reference Young and Nesbitt1998). There are few approaches to estimating the degree of chemical weathering. The Index of Compositional Variability (ICV) is one of them (Cox et al. Reference Cox, Lowe and Cullers1995):
 $$ \eqalign{{\rm ICV\ } & = ( {{\rm F}{\rm e}_2{\rm O}_3 + {\rm K}_2{\rm O\ } + {\rm N}{\rm a}_2{\rm O\ } + {\rm CaO\ } } \cr + {\rm MgO\ } \cr & + {\rm MnO\ } + {\rm Ti}{{\rm O}_2} ) /{\rm A}{\rm l}_2{\rm O}_3}$$
For example, the ICV is usually higher for the non-clay minerals due to their relatively high levels of major cations compared to Al2O3. Thus, sediments with a high percentage of non-clay silicate minerals or unaltered minerals will have ICV values of > 1. In contrast, sediment samples with mostly clay minerals under intense weathering conditions should have ICV values of < 1. Accordingly, the ICV values of the PFC sediments range from 1.44 to 1.57, those of UL range from 1.25 to 1.55, those of ML range from 1.24 to 1.42 and those of the rest of stream channel sediments range from 0.90 to 1.53, closely reflecting those obtained from the rocks, varying from 1.20 to 1.54 (Table II). A good positive correlation exists between the ICV values of the rocks and sediments, indicating that the sediments are dominated by non-clay minerals, thus reflecting a lower degree chemical weathering of the bedrocks. This ICV values (> 1) also implies that physical disintegration of the bedrocks is the major source of sediments, and chemical weathering is very minor in the region, as evidenced by the mineralogical characterization of the sediments (Fig. S4). This finding corroborates well with previous studies that also reported that chemical weathering and thus clay formation seem to be insignificant in the western part of Admiralty Bay (Nędzarek et al. Reference Nędzarek, Tórz and Podlasińska2015). Thus, physical weathering favoured by glacial comminution and freeze-and-thaw processes is still the dominant source of the sediments in Admiralty Bay.
Relative to the bedrock, changes in the major element compositions of the sediments are evaluated by computing the enrichment factor (EF). The EF calculation is based on the degree of mobility of elements, and Al, with its low solubility and mobility under most of the Earth's surface conditions, is widely used as a reference element for the immobility scale (Young & Nesbitt Reference Young and Nesbitt1998). By using the following formula and the Al2O3 contents of the sediment samples, we estimate the elemental changes that occurred during weathering:
 $${\rm EF\ } = ( {E/{\rm A}{\rm l}_{{\rm sediment}}} ) /( {E/{\rm A}{\rm l}_{{\rm bedrock}}} ) $$
where E/Alsediment and E/Albedrock represent the concentrations of the respective element E and of Al in the sediment and in the bedrock, respectively. The obtained EF values revealed that the changes in elements are less than a factor of 2 and generally represent a slight depletion or enrichment in major elements, except for Ca, Na, K and P depletion and Mg enrichment in some sediments, compared to the bedrocks (Fig. 11). Concurrent depletion of Ca and Na in the lakes (UL and ML) and associated outflow sediments (UC and MC) along with the VC and TC sediments compared to the bedrock samples appears to have been related to slight alterations of the plagioclase minerals. The existence of appreciable amounts of Na- and Ca-plagioclase in the bedrocks implies a lower degree weathering of the bedrocks. Minor or even a lack of clay minerals in the sediments is consistent with a lower degree of chemical weathering. Alternatively, as suggested by previous studies, Ca leaching due to organic excretions produced by the lichens that cover the rocks and sediments is also possible (Fig. 2c). Compared to depletion of Ca, particularly in the lake sediments, enrichment of Na, especially in the PFC and EG1 channel sediments, is noticeable, suggesting the influence of marine aerosols on the stream sediments, as observed in the water geochemistry. Among the major elements, Mg is the most enriched in the stream channel sediments of MC, VC, UC, IV, EG1 and PFC rather than the lake sediments compared to the bedrocks.

Fig. 11. Spider plot of average Al-normalized major element contents of each sediment unit normalized against the bedrocks. EF = enrichment factor; EG = Ecology Glacier Creek; IV = Italian Valley Creek; MC = Mud Creek; ML = Mud Lake; PFC = Petrified Forest Creek; TC = Tower Creek; UC = Upper Creek; UL = Upper Lake; VC = Vanishing Creek.
Compared to the bedrocks, moderate K and P and slight Ti depletion in the PFC, EG1, IV and VC channel sediments are obtained. The bedrock composition, particularly in B2 and B7, in the vicinity of these channel sediments shows intermediate characteristics, and K depletion is probably controlled by the bedrock composition as well as a mixed source. Even though Ti is generally considered to be a fairly immobile element during weathering, its depletion from the source has been reported during weathering of granitic rocks (Girty et al. Reference Girty, Marsh, Meltzner, McConnell, Nygren and Nygren2003). Depletion of Ti in the channel sediments therefore suggests a source that is susceptible to weathering reactions. The bedrocks, in particular B2 and B7, which feed the watersheds of the stream channels (PFC, EG1 and IV), contain volcanic glass, which is more susceptible to weathering, and Ti-bearing magnetite. Weathering of volcanic glass and Ti-bearing magnetite may cause the depletion of Ti in the sediments as observed in previous studies (Nowaczyk Reference Nowaczyk2011). This interpretation is supported by a significant correlation (R = 0.57) between the EFs for iron (EFFe) and Ti (EFTi). Enrichment due to hydraulic sorting of the other metals during sediment transport might also be the reason for the relative depletion of Ti in the channel sediments. A slight enrichment in Fe and Mn, especially in UL and ML and their outflow channel sediments UC and MC, respectively, suggests that the weathering occurred under oxic conditions. Mineralogical identification of iron oxides in the respective sediments corroborates this interpretation (Fig. S4).
Trace element and REE distributions of bedrocks and sediments
Except for Cs, Rb and partly U and Th, all of the sediment samples have similar distribution patterns compared to those of B6, B1, B7 and B2 bedrocks (Fig. 7). Compared to the stream channel sediments obtained from the Ezcurra Inlet site, trace element patterns of the lakes and associated outflow sediments showed enrichments compared to B8 bedrock, but were depleted relative to the rest of the bedrock samples. Compared to the B8 and B1 bedrocks, which generally correspond better to patterns in the lake sediments, slight enrichment of trace elements refers a low degree of chemical weathering in the lake sediments. The REEs of the sediments have very similar distribution patterns to those of the B2 and B7 bedrocks (Fig. 7). Furthermore, all sediment samples have total REE contents that are lower than their respective bedrocks, except for B8, representing a weathered rock sample (74.7%) (Table III). A lack of significant enrichment of REEs in the respective sediment samples compared to the bedrock samples may indicate a lower degree of chemical weathering of the bedrocks. Most sediment samples show similar fractionated distribution patterns compared to bedrocks, except for B8. It is well demonstrated that REEs are mobile during weathering, particularly during the early stages of weathering (Nesbitt Reference Nesbitt1979, Condie Reference Condie1991). Based on the negligible changes in major element contents of the sediments relative to the bedrocks as evidenced by the calculated EF and ICV values, suggesting a low degree of chemical weathering, REE mobility in surface sediments is assumed to be insignificant. Homogeneous REE distribution patterns in all of the sediment samples evidently imply that the sediment REEs were not affected much during weathering. Moreover, the comparable La/(La + Ce) ratios of the sediments with those of the rocks suggest insignificant or a lack of chemical weathering, as a decrease in the ratio would be suggestive of oxidation of Ce3+ to Ce4+, resulting in the production of Ce4+-bearing nanocrystalline weathering products such as hydroxides.
Intensity of chemical weathering
The Chemical Index of Alteration (CIA), suggested by Nesbitt & Young (Reference Nesbitt and Young1984), has been successfully and widely used to measure original and primary minerals along with secondary minerals such as clay minerals. The CIA is calculated based on the following formula:
 $${\rm CIA} = \left[{\displaystyle{{{\rm Al}_2{\rm O}_3} \over {( {{\rm Al}_2{\rm O}_3 + {\rm CaO^\ast } + {\rm Na}_2{\rm O} + {\rm K}_2{\rm O}} ) }}} \right]\times \;100$$
where the major oxide values in the formula are expressed as molar proportions. For the calculation of CIA values, CaO is considered to be sourced only from silicate minerals (CaO*). Generally, CIA values for fresh mafic sources are ~30–35; values > 40 imply some influence from chemical weathering and values > 50 are firm evidence for chemical weathering (Nesbitt & Young Reference Nesbitt and Young1984).
Generally, CIA values range from ~50 for fresh rocks to 100 for substantially weathered rocks (i.e. secondary minerals; e.g. kaolinite). The calculated CIA values of all sediment samples ranged between 41.5% and 56.4%, with a mean of 47.3% (Table II). In general, these values imply little or no chemical weathering associated with the sediments. The stream channel sediments showed the lowest CIA values amongst all sediments (Table II). For example, PFC sediments had CIA values ranging from 41.5% to 43.5% (average = 42.3%). Little or no chemical weathering being determined in the studied area corroborates well with previous studies (Nędzarek et al. Reference Nędzarek, Tórz and Podlasińska2015).
The Al2O3-(CaO* + Na2O)-K2O contents of the sediments and bedrocks are used to construct an A-CN-K diagram to further evaluate the degree of chemical weathering in the area. All sediment samples plotted almost parallel to the A-CN boundary and clustered around the feldspar line, resembling the source composition. In Fig. 12, the arrow represents the probable weathering trends of the bedrocks (i.e. basaltic andesite and andesine). All sediments, in particular the PFC, EG and IV stream sediments, closely plot to the weathering trends of basalt and andesite. This order in CIA values of sediment is a good indication of the degree of chemical weathering.

Fig. 12. A-CN-K ternary diagram of sediment and rock samples showing the degree of silicate weathering through the Chemical Index of Alteration (CIA) (Nesbitt & Young Reference Nesbitt and Young1984). EG = Ecology Glacier Creek; IV = Italian Valley Creek; MC = Mud Creek; ML = Mud Lake; PFC = Petrified Forest Creek; TC = Tower Creek; UC = Upper Creek; UL = Upper Lake; VC = Vanishing Creek.
All sediments follow the general weathering trends with minor variations (Fig. 12). A slight shift towards the A-CN line observed in the stream channel sediments (PFC, EG and IV) was most probably related to K2O depletion as indicated by EFK (Fig. 11). K2O is expected to be fixed in the weathering product (clay minerals) compared to CaO and Na2O. Therefore, it is improbable that K2O depletion in the respective sediments would be caused by chemical weathering as suggested by the lack of weathering products in the sediment compositions. This assumption is also evidenced by the CIA values indicating nearly no weathering (Table II). The most plausible explanation is that these sediments may have been mixed with other sediments with relatively low K2O contents. This seems possible as fluvial sediments are the main sources for the respective sediments. The presence of seemingly fresh euhedral-shaped pyroxene and plagioclases in the sediments of PFC, IV and EG with low CIA values further confirm the reduced rate of weathering.
Unlike the stream channel sediments, the CIA values of lakes and their associated outflow stream sediments indicate that bedrocks have undergone some degree of chemical weathering, as evidenced by the REE distribution patterns in Fig. 7 (e.g. B8 bedrock). By contrast to what was observed in the stream channel sediments, although they are local, clay minerals were occasionally present as vermiculite and unidentified smectite groups, especially in the lake sediments. The contribution of smectite originating from the transformation of glassy volcanic dusts emitted from a nearby active volcano on Deception Island to the sediments cannot be completely ruled out in the region. The presence of minor amounts of highly localized clay minerals along with comparable ICV and CIA values of the lake sediments are good indications of the low degree chemical weathering of the bedrocks that feed the watersheds of the lakes. Similarly to our results, Vašinka et al. (Reference Vašinka, Krmíček, Všianský, Hrbáček and Nývlt2020) recently reported the low degree chemical weathering of volcanic rocks, particularly those rich in anorthite, contributing to the Big Lachman Lake sediments.
Consistent with Vašinka et al. (Reference Vašinka, Krmíček, Všianský, Hrbáček and Nývlt2020), strong consistency exists between the Plagioclase Index of Alteration (PIA) (Fedo et al. Reference Fedo, Wayne Nesbitt and Young1995) and the CIA values of sediments, indicating that plagioclase, in particular the anorthite component, dominated chemical weathering under mostly oxic conditions, as evidenced by a strong positive correlation (R 2 = 0.93) between the CIA and the Mafic Index of Alteration (MIA) (Babechuk et al. Reference Babechuk, Widdowson and Kamber2014) values of the sediments, in particular lake sediments (Table II).
There has been a long debate as to what controls the weathering rate of rocks (e.g. climate vs lithology) under Antarctic conditions, particularly following the reporting of a wide range of CIA values. Compared to ADV sediments (~40–55%), relatively high CIA values were obtained from the soils of Barton Peninsula, KGI, ranging from 57.5% to 65.3%, which has been attributed to the moderate climate of KGI (Bishop et al. Reference Bishop, Englert, Patel, Tirsch, Roy and Koeberl2014). However, our CIA values calculated for the sediments of the various components (e.g. streams and lakes) of Admiralty Bay, KGI, located near Barton Peninsula, are comparable with those of ADV sediments. These comparable CIA values suggest that climate may not be the only key factor that influences the weathering rate of rocks. In contrast to the neutral to basic characteristics of the surface waters of Admiralty Bay, acidic surface waters originating from the pyrite-rich andesite covering part of Barton Peninsula probably accelerated the weathering of the rocks, resulting in the higher CIA values.
Future fieldwork is needed to rigorously explore the geological factors affecting these weathering trends. For example, a recent study carried by Hochella et al. (Reference Hochella, Mogk, Ranville, Allen, Luther and Marr2019) has revealed that particle size may have a greater impact on the chemistry of natural waters, and the influence of nanoparticles in natural waters has been neglected. Therefore, the accuracy of the elemental flux in a given surface water and thus the extent to which fresh water chemistry can faithfully reflect or not reflect the weathering rate of rocks should be reconsidered in future studies, which should be undertaken using proper filtration techniques.
Conclusion
In general, the major ion compositions of all freshwater bodies in the western part of Admiralty Bay, KGI, are similar and are characterized by the enrichment in Na+, Ca2+ and Mg2+ cations with CI−-rich contents. Compared to the stream channels and meltwaters, excess Na+ and Ca2+ along with HCO3− in the lakes and their outflow stream waters are signs of the contemporary chemical weathering of the bedrocks. The Gibbs plots constructed from the water chemistry data and the relatively higher Na+/Cl− (> 2) and Ca2+/Mg2+ (> 4) ratios of the lake waters and their outflow waters suggest that lakes waters are under the influence of both bedrock weathering and atmospheric precipitation, while the major ions of the streams and meltwaters reflect predominantly atmospheric precipitation. The CIA along with ICV calculations and A-CN-K plot indicate that the stream sediments of Admiralty Bay have undergone minimal or no chemical weathering, while a low degree of chemical alteration has occurred in the lake sediments. The ICV values with slight or no depletion or enrichment compared to the bedrocks along with the larger EF values of Mg and Na calculated for the stream channel sediments reflect minimal chemical weathering. A minor presence of secondary products as well as a dominant presence of slightly weathered detrital minerals in the lake sediments are suggestive that the initial stage of chemical weathering occurred largely by elemental loss rather than mineralogical transformation relative to the source rocks.
Taken together, our results suggest that chemical weathering seems insignificant even in the warmer and humid climatic conditions in the Maritime Antarctic region and largely occurs as elemental loss. Additionally, the current study suggests that the physically weathered silicate minerals and rock fragments mixed with atmospheric inputs are the major sources of ions and sediments in the Maritime Antarctic, and the chemical weathering of the bedrocks, though slight, is more pronounced in the lake waters and sediments compared to the stream channel sediments. Hence, geochemical analyses of the stream channel sediments in the Maritime Antarctic, such as those found in Admiralty Bay, may provide a more representative composition of the source material, while the lake sediments may demonstrate more dynamic geochemical processes, such as deglaciation-regulated weathering processes.
Acknowledgements
We would like to thank the 42nd expedition crew for their hospitality and help at Henryk Arctowski Polish Antarctic Station. We would like to thank the reviewers for their constructive comments, which significantly improved the manuscript.
Financial support
This study was carried under the auspices of the Presidency of the Republic of Turkey, supported by the Ministry of Industry and Technology, and coordinated by Istanbul Technical University (ITU) Polar Research Center (PolReC). This study was conducted within the frame of the bilateral agreement with the Polish Institute of Biochemistry and Biophysics (IBB) and PolReC. This project was supported by TUBITAK (the Scientific and Technological Research Council of Turkey, grant 119Y411) to N. Balci and by the ITU Scientific Research Projects Division (Project ID: 41729).
Author contributions
NB developed the concepts and approach and performed the data analysis, in addition to writing and editing the manuscript prior to submission. YG performed field sampling and data analysis, in addition to contributing to writing the manuscript.
Supplemental material
Two supplemental tables and four supplemental figures will be found at https://doi.org/10.1017/S0954102021000560.


 Open access